Accelerator Card Market Size & Overview:
Get more information on the Accelerator Card Market - Request Sample Report
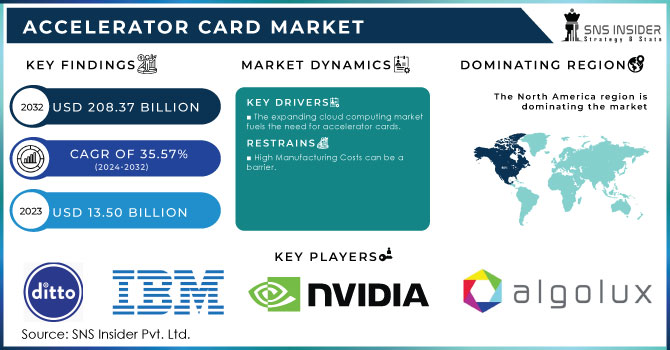
The Accelerator Card Market Size was valued at USD 13.50 Billion in 2023 and it is estimated to reach USD 208.37 Billion by 2032, growing at a CAGR of 35.57% during 2024-2032.
The accelerator cards market is experiencing substantial expansion due to the growing need for high-performance computing, artificial intelligence (AI), and data-heavy applications in different sectors. Accelerator cards are becoming crucial tools in helping organizations achieve faster data processing and more efficient computational capabilities as they strive for these objectives. The quick progress in AI and machine learning technologies is a key factor driving the accelerator card market. By 2032, the generative AI market is forecasted to achieve significant growth of USD 1.3 trillion, with a strong 42% CAGR, indicating a transformative period for AI and ML in 2024. 44% of executives are realizing the potential of generative AI, which organizations are increasingly recognizing as having the ability to revolutionize operational methodologies. Sectors like healthcare, finance, Machine learning, and telecommunications are utilizing these technologies to extract valuable information from large datasets. In healthcare, accelerator cards are utilized in fields such as medical imaging, genomics, and drug discovery, where processing intricate algorithms and large datasets efficiently is imperative. This feature doesn't just accelerate research and diagnostics but also allows for real-time data analysis, improving patient care and treatment results.
Accelerator cards are also widely used in the gaming industry as a significant application area. As high-definition gaming and virtual reality (VR) become more popular, gamers are looking for systems that can provide immersive experiences. In 2024, the gaming industry in the United States maintain its robust expansion, fueled by rising digital purchases and the prevalence of mobile gaming. Nearly 90% of total revenue comes from digital game sales, as gamers are showing a growing preference for downloadable content instead of physical copies. The popularity of mobile gaming has increased significantly, with in-game transactions expected to surpass USD 74 billion worldwide by 2025. Accelerator cards can enhance graphics performance by increasing frame rates and enhancing rendering quality. This has caused a higher need for specialized gaming accelerator cards designed for gamers, enhancing the user experience.
Market Dynamics
Drivers
-
Surging Demand for AI and HPC drives the market growth.
The rise in interest in Artificial Intelligence (AI) and High-Performance Computing (HPC) is a major factor fueling the expansion of the Accelerator Card Market. With the rising use of AI technologies like machine learning, deep learning, and data analytics in organizations, the demand for high-performance computational power has become crucial. Specialized cards like GPUs and TPUs are optimized for efficient processing of intricate computations and large amounts of data, making them well-suited for tasks involving artificial intelligence and high-performance computing. Sectors like finance, healthcare, and self-driving cars are at the forefront of this technological transition. In the financial industry, companies use accelerator cards to analyze large volumes of market information instantly, helping them make trades quicker and improve investment tactics. In healthcare, AI-powered diagnostic tools also use these algorithms to examine medical images and patient information, resulting in more precise diagnoses and customized treatment strategies.
-
The expanding cloud computing market fuels the need for accelerator cards.
The growing cloud computing industry greatly increases the demand for accelerator cards, specialized hardware that boosts processing efficiency and speed. As more companies transition to cloud-based services, the need for advanced processing capabilities grows with the increasing demand for high-performance computing (HPC). Accelerator cards, like GPUs and FPGAs, offer the required strength for managing intricate calculations, extensive data processing, and immediate analytics crucial in the current data-focused setting. Accelerator cards are crucial in industries such as artificial intelligence (AI) and machine learning. For example, in the field of AI, deep learning algorithms need extensive data to properly train models. Utilizing GPUs enables simultaneous processing, leading to quicker training periods and enhanced model precision. NVIDIA and other companies have experienced a rise in the need for their GPU products, especially in cloud services where scalability is important.
Restraints
-
High Manufacturing Costs as a Barrier in the Accelerator Card Market
Significant obstacles in the form of expensive manufacturing costs are impeding the Accelerator Card Market, limiting production capabilities and market entrance. Accelerator cards need complex manufacturing processes and advanced materials to boost computing performance in tasks such as data processing, artificial intelligence, and scientific simulations. The increased production costs are due to the requirement of specific parts like fast connectors, cooling systems, and strong circuit layouts. Higher expenses can hinder smaller manufacturers from entering the market, which in turn limits competition and innovation. Moreover, bigger companies might encounter difficulties in preserving profit margins while striving to provide products at competitive prices. In the financial services sector, companies heavily depend on accelerator cards for high-frequency trading, where speed and efficiency are crucial. Utilizing these cards allows companies to analyze large volumes of data instantly, giving them a competitive advantage.
Market Segmentation
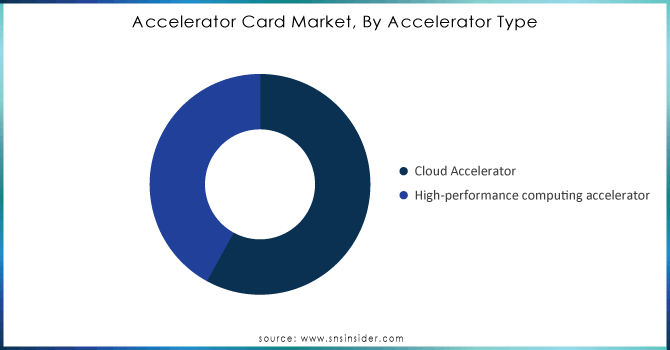
BY ACCELERATOR TYPE
The cloud accelerator sector dominated the market in 2023 with 58% market share as cloud computing services are increasingly used in different industries. These accelerators are created to improve the efficiency of cloud-based applications by optimizing workload handling and data processing. They provide adaptable resources that can be customized according to demand, making them perfect for companies seeking to enhance efficiency without significant capital investment. The growth of cloud accelerators has been driven by the demand for real-time data analytics, machine learning, and AI applications to reduce latency and enhance computational speed.
The HPC accelerator sector is identified as the most rapidly expanding region in the Accelerator Card Market during 2024-2032. These accelerators are specifically designed for scientific research, simulations, and complex computational tasks that demand high processing power. HPC accelerators provide enhanced performance for tasks like computational fluid dynamics, weather modeling, and molecular dynamics simulations by incorporating numerous processing units. This sector is picking up speed thanks to the growing demand for enhanced computational abilities in academic, government research institutions, and large companies.
Need any customization research on Accelerator Card Market - Enquiry Now
BY PROCESSOR TYPE
The Graphic Processing Units (GPU) category led the accelerator card market in 2023 with a 42% market share, mainly because of its versatility and unmatched performance in parallel processing tasks. GPUs are designed to efficiently process demanding calculations, which are crucial for tasks in gaming, machine learning, artificial intelligence, and data presentation. Their design permits numerous concurrent threads, resulting in quicker data processing when compared to typical CPUs. Companies such as NVIDIA and AMD have had a significant influence on this industry, particularly with the widespread use of NVIDIA's GPUs in AI-related applications such as autonomous vehicles and deep learning.
Field Programmable Gate Arrays (FPGA) are to experience a rapid growth rate during 2024-2032 in the Accelerator Card Market because of their flexibility and effectiveness in specific roles. FPGAs, in contrast to fixed-function chips, can be reprogrammed to meet specific application needs, enabling companies to tailor their hardware for the best possible performance. This adaptability is especially advantageous in industries like telecommunications, healthcare, and aerospace, where swift technological progress requires immediate changes in processing capabilities. Xilinx and Intel are leading in this sector by providing FPGA solutions for tasks such as 5G networks and real-time data processing in medical imaging.
Regional Analysis
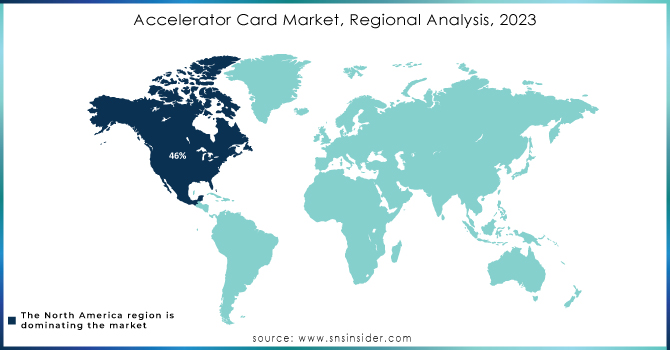
North America dominated the market in 2023 with a 46% market share due to its advanced technological infrastructure and significant investments in research and development. The area's focus on cloud computing and high-performance computing (HPC) is increasing the need for accelerator cards, as companies aim to improve their computational power and effectiveness. AMD and IBM, along with other corporations, are playing a significant role in this market by offering advanced solutions that meet the growing need for fast processing and parallel computing.
The APAC region is becoming the most rapidly expanding market for accelerator cards market during 2024-2032, driven mainly by quick digital transformation and the growing use of advanced technologies. Nations such as China, Japan, and India are seeing significant growth in areas like cloud computing, artificial intelligence, and big data analytics, leading to an increased need for effective processing solutions. The growing technology industry in APAC, including both startups and well-known companies such as Huawei and Alibaba, is driving the advancement and incorporation of accelerator cards in different uses, such as data centers and smart devices.
Key Players
The key players in the Accelerator Card market are:
-
NVIDIA (NVIDIA A100, NVIDIA RTX A6000)
-
AMD (Radeon Pro VII, Radeon RX 6000 Series)
-
Intel (Intel Xeon Phi, Intel FPGA PAC N3000)
-
Xilinx (now part of AMD) (Versal ACAP, Kintex UltraScale FPGA)
-
Micron Technology (Micron 9300 NVMe SSD, Micron 5210 ION SSD)
-
Broadcom (Broadcom NetXtreme II, Broadcom StrataXGS)
-
IBM (IBM Cloud Accelerator, IBM Power System AC922)
-
AWS (Amazon Web Services) (AWS Inferentia, AWS Graviton)
-
Qualcomm (Snapdragon 8cx, Qualcomm Cloud AI 100)
-
HPE (Hewlett Packard Enterprise) (HPE Apollo 6500 Gen10, HPE ProLiant DL380 Gen10)
-
Dell Technologies (Dell PowerEdge R740, Dell EMC VxRail)
-
Lenovo (ThinkSystem SR670, ThinkSystem SR850)
-
Mellanox Technologies (now part of NVIDIA) (Mellanox ConnectX-6, Mellanox Spectrum)
-
Supermicro (SuperServer 1029P-NDR, SuperServer 2029GP-TRT)
-
Oracle (Oracle Exadata Database Machine, Oracle Cloud Infrastructure)
-
Fusion-io (now part of Western Digital) (ioMemory, ioScale)
-
Samsung Electronics (Samsung PM1733, Samsung 970 EVO Plus)
-
Seagate Technology (Seagate Exos X16, Seagate IronWolf Pro)
-
Crucial (a brand of Micron Technology) (Crucial P5 SSD, Crucial MX500 SSD)
-
SK Hynix (SK Hynix Gold S31 SSD, SK Hynix P31 NVMe SSD)
Recent Development
-
February 2024: Intel introduced its Data Center GPU Max series, aimed at optimizing cloud workloads and AI applications. These GPUs are designed to handle extensive computational tasks while being energy efficient.
-
December 2023: AMD launched the Instinct MI300, its latest accelerator card targeting AI and high-performance computing (HPC). This product combines CPU and GPU capabilities on a single chip, significantly improving data processing speeds.
-
January 2023: Xilinx, now part of AMD, launched the Versal AI Core series, which integrates AI engines into a versatile architecture for various applications, including 5G and data center solutions.
-
April 2023: Achronix unveiled the Speedster7t FPGA, targeting AI inference and high-performance computing applications. This FPGA is designed to provide significant acceleration for data processing tasks.
| Report Attributes | Details |
|---|---|
| Market Size in 2023 | USD 13.50 Billion |
| Market Size by 2032 | USD 208.37 Billion |
| CAGR | CAGR of 35.57% From 2024 to 2032 |
| Base Year | 2023 |
| Forecast Period | 2024-2032 |
| Historical Data | 2020-2022 |
| Report Scope & Coverage | Market Size, Segments Analysis, Competitive Landscape, Regional Analysis, DROC & SWOT Analysis, Forecast Outlook |
| Key Segments | • By Accelerator Type (Cloud Accelerator, High-Performance Computing Accelerator) • By Processor Type (Graphics Processing Units (GPU), Central Processing Units (CPU), Application Specific Integrated Circuits (ASIC), Field Programmable Gate Arrays (FPGA)) • By Application (Machine Learning, Mobile Phones, Video And Image Processing, Data Analytics, Financial Computing, Others) |
| Regional Analysis/Coverage | North America (US, Canada, Mexico), Europe (Eastern Europe [Poland, Romania, Hungary, Turkey, Rest of Eastern Europe] Western Europe] Germany, France, UK, Italy, Spain, Netherlands, Switzerland, Austria, Rest of Western Europe]), Asia Pacific (China, India, Japan, South Korea, Vietnam, Singapore, Australia, Rest of Asia Pacific), Middle East & Africa (Middle East [UAE, Egypt, Saudi Arabia, Qatar, Rest of Middle East], Africa [Nigeria, South Africa, Rest of Africa], Latin America (Brazil, Argentina, Colombia, Rest of Latin America) |
| Company Profiles | NVIDIA, AMD, Intel, Xilinx, Micron Technology, Broadcom, IBM, AWS, Qualcomm, HPE, Dell Technologies, Lenovo, Mellanox Technologies, Supermicro, Oracle, Fusion-io, Samsung Electronics, Seagate Technology, Crucial, SK Hynix |
| Key Drivers | • Surging Demand for AI and HPC drives the market growth. • The expanding cloud computing market fuels the need for accelerator cards. |
| RESTRAINTS | • High Manufacturing Costs as a Barrier in the Accelerator Card Market |
Get in Touch
