Automotive Dyno Market Report Scope & Overview:

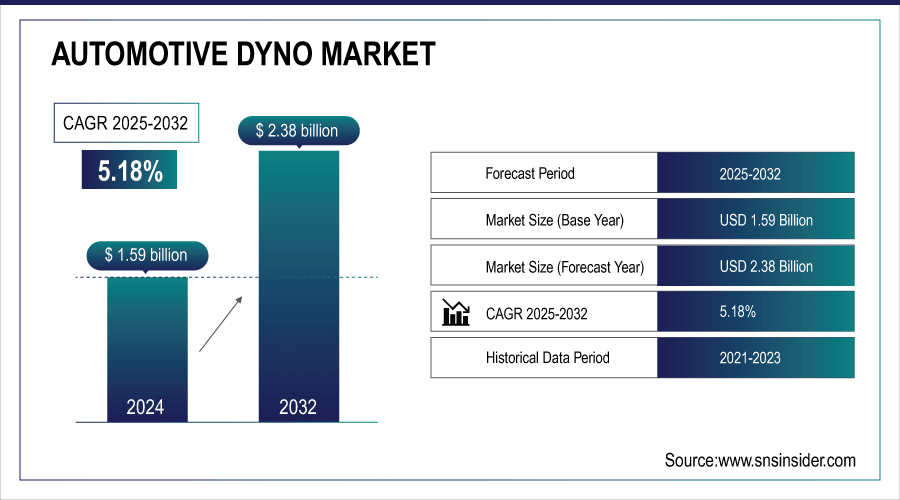
The Automotive Dyno Market size was valued at USD 1.59 Billion in 2024 and is projected to reach USD 2.38 Billion by 2032, growing at a CAGR of 5.18% during 2025–2032.

The Automotive Dyno Market is experiencing significant growth driven by innovations in compact and versatile dynamometers. Advancements such as adjustable mounts, enhanced multi-motor drive systems, and the integration of USB-C and battery-powered options are improving efficiency and user convenience. Growing interest in dynamic testing solutions, especially for scale-model and miniature vehicles, is expanding the market scope among hobbyists, researchers, and collectors. The ability to simulate speed and aerodynamics in controlled environments is further fueling adoption. These developments highlight the market’s focus on cost-effective, portable, and high-performance solutions for enhanced vehicle testing and performance analysis.

July 24, 2025 – Runsible Dynamometer Brings Mini Cars to Life in Wind Tunnel TestsFun Tech Labs has launched the Runsible dynamometer for 1:64-scale cars, featuring adjustable mounts, a four-motor drive system, and USB-C or battery power, priced at $39.90. It fits inside the Windsible wind tunnel, allowing miniature cars to spin their wheels and run through fog streams for a dynamic, fun testing experience.

Automotive-Dyno-Market

To Get More Information On Automotive Dyno Market - Request Free Sample Report

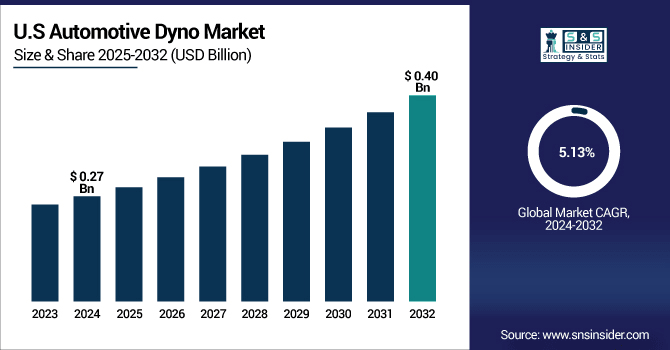
The U.S. Automotive Dyno Market size was valued at USD 0.27 Billion in 2024 and is projected to reach USD 0.40 Billion by 2032, growing at a CAGR of 5.13% during 2025 – 2032, driven by rising demand for advanced vehicle testing solutions, increasing focus on emission regulations, and growing adoption of performance optimization technologies. Innovations in portable and high-precision dynamometers further support market expansion, catering to automotive manufacturers, research facilities, and hobbyist segments.

Automotive-Dyno-Market-Us

Automotive Dyno Market Highlights:

  • Growing need for precise measurement of real-world vehicle performance is driving demand for advanced dynamometers.

  • High-power performance vehicles and rising consumer expectations increase adoption of high-precision chassis dynos.

  • High initial costs, technical complexities, and specialized expertise requirements restrain widespread implementation.

  • Space constraints in urban facilities and regulatory hurdles limit market expansion.

  • Rapid EV and autonomous vehicle growth is fueling demand for hub and steerable dynamometers.

  • Integration of hardware-in-the-loop, torque vectoring, and intelligent software platforms enhances testing capabilities and market innovation.

Automotive Dyno Market Drivers:

  • Power Discrepancies Drive Demand for High-Precision Chassis Dynamometers

The growing need for accurate measurement of real-world vehicle performance is driving demand for advanced chassis dynamometers. As performance vehicles become more powerful, manufacturers, tuners, and testing facilities require precise tools to validate horsepower and torque outputs, ensuring transparency and compliance with industry standards. This demand is fueled by increasing consumer expectations for verified performance data, the rise of high-output engines, and the push for enhanced tuning and optimization. High-precision dynos capable of handling elevated power levels and reducing measurement inaccuracies are becoming essential for both OEMs and aftermarket performance sectors.

June 25, 2025 – Chassis Dyno Reveals Chevrolet C8 ZR1 Packs More Power Than Claimed

Paragon Performance’s dyno test showed the C8 Corvette ZR1 delivering 1,028.6 horsepower and 839.5 lb-ft of torque at the wheels, exceeding GM’s official 1,064 hp flywheel claim after accounting for drivetrain losses.

Automotive Dyno Market Restraints:

  • High Costs and Technical Complexities Restrain Automotive Dyno Market Expansion

The Automotive Dyno Market faces restraints primarily due to high initial investment costs and ongoing maintenance expenses associated with advanced dynamometer systems. Technical complexities in calibration and operation further limit adoption, particularly among small-scale manufacturers and testing facilities with constrained budgets. Additionally, the requirement for specialized expertise to manage high-performance testing setups increases operational challenges. Space constraints in urban facilities and regulatory hurdles related to emissions testing equipment also pose barriers. These factors collectively slow down widespread implementation, affecting market growth despite rising demand for accurate vehicle performance measurement and emissions compliance solutions.

Automotive Dyno Market Opportunities:

  • EV and Autonomous Growth Drives Demand for Advanced Dynamometer Systems

The rapid advancement of electric and autonomous vehicles is driving the need for next-generation dynamometer systems that enable precise simulation of real-world driving scenarios. Growing requirements for hardware-in-the-loop testing, torque vectoring, and advanced load handling capabilities are pushing manufacturers to adopt hub and steerable dynos. These systems allow efficient validation of autonomous driving functions, enhanced drivetrain performance, and reduced reliance on physical proving grounds. As the automotive industry moves toward connected and zero-emission mobility, the integration of intelligent software and flexible testing platforms is expected to accelerate market adoption and innovation.

February 24, 2025 – Ascential Technologies Unveils Hub and Steerable Dynos for EV and Autonomous Vehicle Testing

Ascential Technologies introduced new hub and steerable dynamometers designed for precise simulation of electric and autonomous vehicles, featuring advanced torque vectoring, hardware-in-the-loop integration, and enhanced load handling for comprehensive vehicle testing and validation.

Automotive Dyno Market Segment Highlights:

  • By Type – Dominating: Engine Dynamometers (51.13% in 2024), Fastest: Transmission Dynamometers (8.0% CAGR)

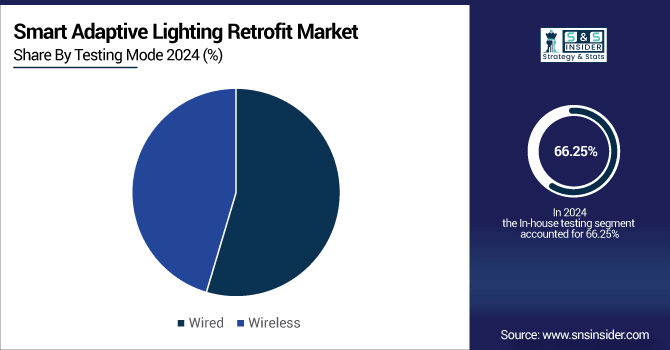
  • By Testing Mode – Dominating: In-house Testing (66.25% in 2024), Fastest: Outsourced Testing (6.82% CAGR)

  • By Vehicle – Dominating: Passenger Vehicles (58.25% in 2024), Fastest: Commercial Vehicles (6.52% CAGR)

  • By End Use – Dominating: Automotive OEMs (54.38% in 2024), Fastest: Aftermarket Service Providers (6.66%CAGR)

By Testing, Mode In-house Testing Leads While Outsourced Testing Shows Rapid Growth

In-house testing dominates the market due to its greater control over testing processes and seamless integration with internal operations. However, outsourced testing is growing at the fastest pace, driven by cost efficiency, access to specialized expertise, and increasing reliance on third-party testing facilities for advanced vehicle validation.

Automotive-Dyno-Market-By-Testing-Mode

By Type, Engine Dynamometers Lead While Transmission Dynamometers Fastest Growth

Engine dynamometers dominate the market, driven by their widespread use in powertrain testing and emission compliance validation. Transmission dynamometers are witnessing the fastest growth, fueled by increasing demand for advanced drivetrain testing and their expanding role in electric and hybrid vehicle development.

By Vehicle, Passenger Vehicles Lead While Commercial Vehicles Gain Momentum

Passenger vehicles dominate the market, supported by their extensive production volumes and consistent demand for performance and emissions testing. However, commercial vehicles are experiencing the fastest growth, driven by the rising focus on fleet efficiency, stricter regulatory standards, and increasing adoption of advanced testing solutions for heavy-duty applications.

By End Use, Automotive OEMs Lead While Aftermarket Service Providers Grow Fastest

Automotive OEMs dominate the market due to their large-scale production and consistent need for vehicle testing and validation. Meanwhile, aftermarket service providers are growing the fastest, driven by increasing vehicle customization, performance upgrades, and the rising demand for reliable testing solutions in the aftermarket and service sectors.

Automotive Dyno Market Regional Highlights:

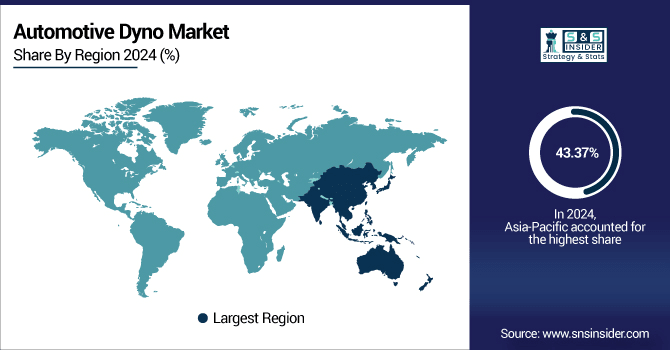
  • By Region – Dominating: Asia-Pacific (43.37% in 2024), Fastest: North America (25.25% in 2024 → 27.66% in 2032, CAGR 6.37%)

  • Europe: 20.25% → 21.78% (CAGR 6.14%)

  • South America: 6.13% → 5.14% (CAGR 2.88%, declining)

  • Middle East & Africa: 5.00% → 4.13% (CAGR 2.65%, declining)

Automotive Dyno Market Regional Analysis:

Asia-Pacific Automotive Dyno Market Insights:

The Asia-Pacific Automotive Dyno Market dominates globally due to high vehicle production, expanding automotive R&D, and increasing adoption of advanced testing solutions. Strong growth in passenger and commercial vehicle segments, along with government support for emissions compliance and performance optimization, is driving demand for both engine and chassis dynamometers across the region.

Automotive-Dyno-Market-By-Region

Get Customized Report as Per Your Business Requirement - Enquiry Now

  • China Automotive Dyno Market Insights

China leads the Asia-Pacific Automotive Dyno market, driven by high vehicle production, growing R&D activities, and increased adoption of advanced testing solutions.

North America Automotive Dyno Market Insights:

North America is the fastest-growing Automotive Dyno market, fueled by advanced automotive infrastructure, increasing electric and hybrid vehicle adoption, and rising demand for accurate performance testing. Strong investments in R&D, stringent emission regulations, and growing focus on drivetrain optimization are accelerating the adoption of engine, chassis, and transmission dynamometers.

  • U.S. Automotive Dyno Market Insights

The U.S. Automotive Dyno market is growing rapidly due to advanced vehicle testing, performance optimization, and increasing EV and hybrid adoption.

Europe Automotive Dyno Market Insights:

The Europe Automotive Dyno market is witnessing steady growth, driven by increasing vehicle production, stringent emission regulations, and rising demand for performance testing. Investments in R&D, adoption of advanced dynamometer technologies, and growing focus on electric and hybrid vehicle validation are supporting market expansion across key European countries.

  • Germany Automotive Dyno Market Insights

Germany dominates the European Automotive Dyno market, driven by its strong automotive manufacturing base, advanced R&D infrastructure, and high adoption of vehicle testing and validation technologies.

Latin America Automotive Dyno Market Insights:

The Latin America Automotive Dyno market is expanding steadily, supported by growing automotive production, increasing demand for performance and emissions testing, and gradual adoption of advanced dynamometer technologies. Emerging markets in Brazil and Mexico are driving growth, while investments in vehicle R&D and testing infrastructure continue to rise across the region.

  • Brazil Automotive Dyno Market Insights

Brazil leads the Latin America Automotive Dyno, driven by its large automotive manufacturing industry, growing vehicle production, and increasing adoption of advanced testing and validation solutions.

Middle East & Africa Automotive Dyno Market Insights:

The Middle East & Africa Automotive Dyno market is growing steadily, supported by increasing automotive production, rising demand for performance and emissions testing, and gradual adoption of advanced dynamometer technologies. Key markets like the UAE and South Africa are driving growth, with ongoing investments in vehicle R&D and testing infrastructure.

  • United Arab Emirates (UAE) Automotive Dyno Market Insights

United Arab Emirates (UAE) is dominating the Middle East & Africa Automotive Dyno market, driven by its advanced automotive infrastructure, high adoption of testing technologies, and growing investments in vehicle performance and validation solutions.

Automotive Dyno Market Competitive Landscape:

Established in 1975, Mustang Dynamometer is a U.S.-based leader in designing and manufacturing high-precision testing equipment, including chassis, engine, and transmission dynamometers. The company serves automotive OEMs, aftermarket providers, and motorsport teams, offering innovative solutions, calibration services, and advanced ADAS testing systems to ensure accurate and reliable vehicle performance validation.

  • In Aug 2025 Mustang releases 2025 catalogs, introduces a revolutionary ADAS testing system, and offers calibration services to ensure precise and repeatable dynamometer testing.

Rototest International AB, founded in January 1988, is a Swedish technology company specializing in high-dynamic, hub-coupled dynamometers for automotive testing. Initially developed to commercialize a Swedish-patented dynamometer, it has since become a global leader in powertrain testing solutions. In late 2023, Rototest was acquired by TOYO Corporation, a Japanese provider of advanced measurement solutions, to enhance its global presence and innovation capabilities.

  • In Jun 2024 – Rototest Showcases Advanced Powertrain Dynos Rototest exhibited its latest dynamometer range at a European expo, highlighting high-performance models for ADAS testing and educational applications, including the Energy a62 4WD for dynamic braking and the cost-efficient Energy u14 4WD for universities.

Automotive Dyno Market Key Players:

  • AVL List GmbH

  • Dynojet Research

  • HORIBA Automotive

  • Magtrol Inc.

  • MAHA Maschinenbau Haldenwang GmbH

  • Meidensha Corporation

  • Mustang Dynamometer

  • Power Test

  • Rototest

  • SuperFlow Technologies

  • Dynotech Research Inc.

  • Dynotronics

  • Flh Dyno Technologies

  • Ardic

  • Dynametric Dyne Systems

  • Mainline Dyno

  • Taylor Dynamometer

  • Phoenix Dynamometer Technologies LLC

  • Com-Ten Industries

  • Dynapack USA

Automotive Dyno Market Report Scope:

Report Attributes Details
Market Size in 2024 USD 1.59 Billion
Market Size by 2032 USD 2.38 Billion
CAGR CAGR of 5.18% From 2024 to 2032
Base Year 2024
Forecast Period 2025-2032
Historical Data 2021-2023
Report Scope & Coverage Market Size, Segments Analysis, Competitive Landscape, Regional Analysis, DROC & SWOT Analysis, Forecast Outlook
Key Segments • By Type (Engine Dynamometers, Chassis Dynamometers, Transmission Dynamometers)
• By Testing Mode (In-house Testing, Outsourced Testing)
• By Vehicle (Passenger Vehicles, Commercial Vehicles)
• By End Use (Automotive OEMs, Aftermarket Service Providers, Motorsport Teams)
Regional Analysis/Coverage North America (US, Canada), Europe (Germany, UK, France, Italy, Spain, Russia, Poland, Rest of Europe), Asia Pacific (China, India, Japan, South Korea, Australia, ASEAN Countries, Rest of Asia Pacific), Middle East & Africa (UAE, Saudi Arabia, Qatar, South Africa, Rest of Middle East & Africa), Latin America (Brazil, Argentina, Mexico, Colombia, Rest of Latin America).
Company Profiles AVL List GmbH, Dynojet Research, HORIBA Automotive, Magtrol Inc., MAHA Maschinenbau Haldenwang GmbH, Meidensha Corporation, Mustang Dynamometer, Power Test, Rototest, SuperFlow Technologies, Dynotech Research Inc., Dynotronics, Flh Dyno Technologies, Ardic, Dynametric Dyne Systems, Mainline Dyno, Taylor Dynamometer, Phoenix Dynamometer Technologies LLC, Com-Ten Industries, and Dynapack USA.

Table Of Contents

1. Introduction

1.1 Market Definition & Scope

 1.2 Research Assumptions & Abbreviations

 1.3 Research Methodology

2. Executive Summary

2.1 Market Snapshot

 2.2 Market Absolute $ Opportunity Assessment & Y-o-Y Analysis, 2021–2032

 2.3 Market Size & Forecast, By Segmentation, 2021–2032

  2.3.1 Market Size By Type

  2.3.2 Market Size By Testing Mode

  2.3.3 Market Size  By Vehicle

  2.3.4 Market Size By End Use

 2.4 Market Share & Bps Analysis By Region, 2024

 2.5 Industry Growth Scenarios – Conservative, Likely & Optimistic

 2.6 Industry CxO’s Perspective

3. Market Overview

3.1 Market Dynamics

  3.1.1 Drivers

  3.1.2 Restraints

  3.1.3 Opportunities

  3.1.4 Key Market Trends

 3.2 Industry PESTLE Analysis

 3.3 Key Industry Forces (Porter’s) Impacting Market Growth

 3.4 Industry Supply Chain Analysis

  3.4.1 Raw Material Suppliers

  3.4.2 Manufacturers

  3.4.3 Distributors/Suppliers

  3.4.4 Customers/End-Users

 3.5 Industry Life Cycle Assessment

 3.6 Parent Market Overview

 3.7 Market Risk Assessment

4. Statistical Insights & Trends Reporting

4.1 Technological & Digital Advancements

4.1.1 Integration rate of cloud-based data logging and AI analytics (%)

4.1.2 Use of regenerative braking energy recovery in dynamometer setups (%)

4.1.3 Digital twin & simulation-enabled testing adoption (%)

4.1.4 Compatibility with upcoming standards (Euro 7, EPA Tier 4, etc.) (%)

4.2 Cost, Pricing & Investment Metrics

4.2.1 Average cost per test session (USD) by application type

4.2.2 Total cost of ownership (TCO) reduction (%) with modern dynamometers

4.2.3 Share of capital expenditure in R&D vs. production testing (%)

4.2.4 Average selling price fluctuation (USD/unit) over the past 5 years

4.3 Innovation & Development Indicators

4.3.1 Annual patent filings in EV & hybrid vehicle dynamometry

4.3.2 Collaborations with research institutes and regulatory bodies (%)

4.3.3 Emerging innovations: wireless sensors, NVH (Noise, Vibration & Harshness) testing modules (%)

4.5.4 Share of automated vs. manually operated dynamometers (%)

5. Automotive Dyno Market Segmental Analysis & Forecast, By Type, 2021 – 2032, Value (USD Billion)

5.1 Introduction

 5.2 Engine dynamometers

  5.2.1 Key Trends

  5.2.2 Market Size & Forecast, 2021 – 2032

 5.3 Chassis dynamometers

 5.4 Transmission dynamometers

6. Automotive Dyno Market Segmental Analysis & Forecast, By Testing Mode, 2021 – 2032, Value (USD Billion)

    6.1 Introduction

 6.2 In-house testing

  6.2.1 Key Trends

  6.2.2 Market Size & Forecast, 2021 – 2032

 6.3 Outsourced testing

7. Automotive Dyno Market Segmental Analysis & Forecast,  By Vehicle, 2021 – 2032, Value (USD Billion)

    7.1 Introduction

 7.2 Passenger vehicles 

  7.2.1 Key Trends

  7.2.2 Market Size & Forecast, 2021 – 2032

 7.3 Commercial vehicles 

8. Automotive Dyno Market Segmental Analysis & Forecast, By End Use, 2021 – 2032, Value (USD Billion)

    8.1 Introduction

 8.2 Automotive OEMs

  8.2.1 Key Trends

  8.2.2 Market Size & Forecast, 2021 – 2032

 8.3 Aftermarket service providers

    8.4 Motorsport teams

9. Automotive Dyno Market Segmental Analysis & Forecast By Region, 2021 – 2025, Value (USD Billion)

9.1 Introduction

9.2 North America

 9.2.1 Key Trends

 9.2.2 Automotive Dyno Market Size & Forecast, By Type, 2021 – 2032

 9.2.3 Automotive Dyno Market Size & Forecast, By Testing Mode, 2021 – 2032

 9.2.4 Automotive Dyno Market Size & Forecast,  By Vehicle, 2021 – 2032

 9.2.5 Automotive Dyno Market Size & Forecast, By End Use, 2021 – 2032

 9.2.6 Automotive Dyno Market Size & Forecast, By Country, 2021 – 2032

  9.2.6.1 USA

   9.2.6.1.1 Automotive Dyno Market Size & Forecast, By Type, 2021 – 2032

   9.2.6.1.2 Automotive Dyno Market Size & Forecast, By Testing Mode, 2021 – 2032

   9.2.6.1.3 Automotive Dyno Market Size & Forecast,  By Vehicle, 2021 – 2032

   9.2.6.1.4 Automotive Dyno Market Size & Forecast, By End Use, 2021 – 2032

  9.2.6.2 Canada

   9.2.6.2.1 Automotive Dyno Market Size & Forecast, By Type, 2021 – 2032

   9.2.6.2.2 Automotive Dyno Market Size & Forecast, By Testing Mode, 2021 – 2032

   9.2.6.2.3 Automotive Dyno Market Size & Forecast,  By Vehicle, 2021 – 2032

   9.2.6.2.4 Automotive Dyno Market Size & Forecast, By End Use, 2021 – 2032

9.3 Europe

 9.3.1 Key Trends

 9.3.2 Automotive Dyno Market Size & Forecast, By Type, 2021 – 2032

 9.3.3 Automotive Dyno Market Size & Forecast, By Testing Mode, 2021 – 2032

 9.3.4 Automotive Dyno Market Size & Forecast,  By Vehicle, 2021 – 2032

 9.3.5 Automotive Dyno Market Size & Forecast, By End Use, 2021 – 2032

 9.3.6 Automotive Dyno Market Size & Forecast, By Country, 2021 – 2032

  9.3.6.1 Germany

   9.3.6.1.1 Automotive Dyno Market Size & Forecast, By Type, 2021 – 2032

   9.3.6.1.2 Automotive Dyno Market Size & Forecast, By Testing Mode, 2021 – 2032

   9.3.6.1.3 Automotive Dyno Market Size & Forecast,  By Vehicle, 2021 – 2032

   9.3.6.1.4 Automotive Dyno Market Size & Forecast, By End Use, 2021 – 2032

  9.3.6.2 UK

   9.3.6.2.1 Automotive Dyno Market Size & Forecast, By Type, 2021 – 2032

   9.3.6.2.2 Automotive Dyno Market Size & Forecast, By Testing Mode, 2021 – 2032

   9.3.6.2.3 Automotive Dyno Market Size & Forecast,  By Vehicle, 2021 – 2032

   9.3.6.2.4 Automotive Dyno Market Size & Forecast, By End Use, 2021 – 2032

  9.3.6.3 France

   9.3.6.3.1 Automotive Dyno Market Size & Forecast, By Type, 2021 – 2032

   9.3.6.3.2 Automotive Dyno Market Size & Forecast, By Testing Mode, 2021 – 2032

   9.3.6.3.3 Automotive Dyno Market Size & Forecast,  By Vehicle, 2021 – 2032

   9.3.6.3.4 Automotive Dyno Market Size & Forecast, By End Use, 2021 – 2032

  9.3.6.4 Italy

   9.3.6.4.1 Automotive Dyno Market Size & Forecast, By Type, 2021 – 2032

   9.3.6.4.2 Automotive Dyno Market Size & Forecast, By Testing Mode, 2021 – 2032

   9.3.6.4.3 Automotive Dyno Market Size & Forecast,  By Vehicle, 2021 – 2032

   9.3.6.4.4 Automotive Dyno Market Size & Forecast, By End Use, 2021 – 2032

  9.3.6.5 Spain

   9.3.6.5.1 Automotive Dyno Market Size & Forecast, By Type, 2021 – 2032

   9.3.6.5.2 Automotive Dyno Market Size & Forecast, By Testing Mode, 2021 – 2032

   9.3.6.5.3 Automotive Dyno Market Size & Forecast,  By Vehicle, 2021 – 2032

   9.3.6.5.4 Automotive Dyno Market Size & Forecast, By End Use, 2021 – 2032

  9.3.6.6 Russia

   9.3.6.6.1 Automotive Dyno Market Size & Forecast, By Type, 2021 – 2032

   9.3.6.6.2 Automotive Dyno Market Size & Forecast, By Testing Mode, 2021 – 2032

   9.3.6.6.3 Automotive Dyno Market Size & Forecast,  By Vehicle, 2021 – 2032

   9.3.6.6.4 Automotive Dyno Market Size & Forecast, By End Use, 2021 – 2032

  9.3.6.7 Poland

   9.3.6.7.1 Automotive Dyno Market Size & Forecast, By Type, 2021 – 2032

   9.3.6.7.2 Automotive Dyno Market Size & Forecast, By Testing Mode, 2021 – 2032

   9.3.6.7.3 Automotive Dyno Market Size & Forecast,  By Vehicle, 2021 – 2032

   9.3.6.7.4 Automotive Dyno Market Size & Forecast, By End Use, 2021 – 2032

  9.3.6.8 Rest of Europe

   9.3.6.8.1 Automotive Dyno Market Size & Forecast, By Type, 2021 – 2032

   9.3.6.8.2 Automotive Dyno Market Size & Forecast, By Testing Mode, 2021 – 2032

   9.3.6.8.3 Automotive Dyno Market Size & Forecast,  By Vehicle, 2021 – 2032

   9.3.6.8.4 Automotive Dyno Market Size & Forecast, By End Use, 2021 – 2032   

9.4 Asia-Pacific

 9.4.1 Key Trends

 9.4.2 Automotive Dyno Market Size & Forecast, By Type, 2021 – 2032

 9.4.3 Automotive Dyno Market Size & Forecast, By Testing Mode, 2021 – 2032

 9.4.4 Automotive Dyno Market Size & Forecast,  By Vehicle, 2021 – 2032

 9.4.5 Automotive Dyno Market Size & Forecast, By End Use, 2021 – 2032

 9.4.6 Automotive Dyno Market Size & Forecast, By Country, 2021 – 2032

  9.4.6.1 China

   9.4.6.1.1 Automotive Dyno Market Size & Forecast, By Type, 2021 – 2032

   9.4.6.1.2 Automotive Dyno Market Size & Forecast, By Testing Mode, 2021 – 2032

   9.4.6.1.3 Automotive Dyno Market Size & Forecast,  By Vehicle, 2021 – 2032

   9.4.6.1.4 Automotive Dyno Market Size & Forecast, By End Use, 2021 – 2032

  9.4.6.2 India

   9.4.6.2.1 Automotive Dyno Market Size & Forecast, By Type, 2021 – 2032

   9.4.6.2.2 Automotive Dyno Market Size & Forecast, By Testing Mode, 2021 – 2032

   9.4.6.2.3 Automotive Dyno Market Size & Forecast,  By Vehicle, 2021 – 2032

   9.4.6.2.4 Automotive Dyno Market Size & Forecast, By End Use, 2021 – 2032

  9.4.6.3 Japan

   9.4.6.3.1 Automotive Dyno Market Size & Forecast, By Type, 2021 – 2032

   9.4.6.3.2 Automotive Dyno Market Size & Forecast, By Testing Mode, 2021 – 2032

   9.4.6.3.3 Automotive Dyno Market Size & Forecast,  By Vehicle, 2021 – 2032

   9.4.6.3.4 Automotive Dyno Market Size & Forecast, By End Use, 2021 – 2032

  9.4.6.4 South Korea

   9.4.6.4.1 Automotive Dyno Market Size & Forecast, By Type, 2021 – 2032

   9.4.6.4.2 Automotive Dyno Market Size & Forecast, By Testing Mode, 2021 – 2032

   9.4.6.4.3 Automotive Dyno Market Size & Forecast,  By Vehicle, 2021 – 2032

   9.4.6.4.4 Automotive Dyno Market Size & Forecast, By End Use, 2021 – 2032

  9.4.6.5 Australia

   9.4.6.5.1 Automotive Dyno Market Size & Forecast, By Type, 2021 – 2032

   9.4.6.5.2 Automotive Dyno Market Size & Forecast, By Testing Mode, 2021 – 2032

   9.4.6.5.3 Automotive Dyno Market Size & Forecast,  By Vehicle, 2021 – 2032

   9.4.6.5.4 Automotive Dyno Market Size & Forecast, By End Use, 2021 – 2032

  9.4.6.6 ASEAN Countries

   9.4.6.6.1 Automotive Dyno Market Size & Forecast, By Type, 2021 – 2032

   9.4.6.6.2 Automotive Dyno Market Size & Forecast, By Testing Mode, 2021 – 2032

   9.4.6.6.3 Automotive Dyno Market Size & Forecast,  By Vehicle, 2021 – 2032

   9.4.6.6.4 Automotive Dyno Market Size & Forecast, By End Use, 2021 – 2032

  9.4.6.7 Rest of Asia-Pacific

   9.4.6.7.1 Automotive Dyno Market Size & Forecast, By Type, 2021 – 2032

   9.4.6.7.2 Automotive Dyno Market Size & Forecast, By Testing Mode, 2021 – 2032

   9.4.6.7.3 Automotive Dyno Market Size & Forecast,  By Vehicle, 2021 – 2032

   9.4.6.7.4 Automotive Dyno Market Size & Forecast, By End Use, 2021 – 2032

9.5 Latin America

 9.5.1 Key Trends

 9.5.2 Automotive Dyno Market Size & Forecast, By Type, 2021 – 2032

 9.5.3 Automotive Dyno Market Size & Forecast, By Testing Mode, 2021 – 2032

 9.5.4 Automotive Dyno Market Size & Forecast,  By Vehicle, 2021 – 2032

 9.5.5 Automotive Dyno Market Size & Forecast, By End Use, 2021 – 2032

 9.5.6 Automotive Dyno Market Size & Forecast, By Country, 2021 – 2032

  9.5.6.1 Brazil

   9.5.6.1.1 Automotive Dyno Market Size & Forecast, By Type, 2021 – 2032

   9.5.6.1.2 Automotive Dyno Market Size & Forecast, By Testing Mode, 2021 – 2032

   9.5.6.1.3 Automotive Dyno Market Size & Forecast,  By Vehicle, 2021 – 2032

   9.5.6.1.4 Automotive Dyno Market Size & Forecast, By End Use, 2021 – 2032

  9.5.6.2 Argentina

   9.5.6.2.1 Automotive Dyno Market Size & Forecast, By Type, 2021 – 2032

   9.5.6.2.2 Automotive Dyno Market Size & Forecast, By Testing Mode, 2021 – 2032

   9.5.6.2.3 Automotive Dyno Market Size & Forecast,  By Vehicle, 2021 – 2032

   9.5.6.2.4 Automotive Dyno Market Size & Forecast, By End Use, 2021 – 2032

  9.5.6.3 Mexico

   9.5.6.3.1 Automotive Dyno Market Size & Forecast, By Type, 2021 – 2032

   9.5.6.3.2 Automotive Dyno Market Size & Forecast, By Testing Mode, 2021 – 2032

   9.5.6.3.3 Automotive Dyno Market Size & Forecast,  By Vehicle, 2021 – 2032

   9.5.6.3.4 Automotive Dyno Market Size & Forecast, By End Use, 2021 – 2032

  9.5.6.4 Colombia

   9.5.6.4.1 Automotive Dyno Market Size & Forecast, By Type, 2021 – 2032

   9.5.6.4.2 Automotive Dyno Market Size & Forecast, By Testing Mode, 2021 – 2032

   9.5.6.4.3 Automotive Dyno Market Size & Forecast,  By Vehicle, 2021 – 2032

   9.5.6.4.4 Automotive Dyno Market Size & Forecast, By End Use, 2021 – 2032

  9.5.6.5 Rest of Latin America

   9.5.6.5.1 Automotive Dyno Market Size & Forecast, By Type, 2021 – 2032

   9.5.6.5.2 Automotive Dyno Market Size & Forecast, By Testing Mode, 2021 – 2032

   9.5.6.5.3 Automotive Dyno Market Size & Forecast,  By Vehicle, 2021 – 2032

   9.5.6.5.4 Automotive Dyno Market Size & Forecast, By End Use, 2021 – 2032

9.6 Middle East & Africa

 9.6.1 Key Trends

 9.6.2 Automotive Dyno Market Size & Forecast, By Type, 2021 – 2032

 9.6.3 Automotive Dyno Market Size & Forecast, By Testing Mode, 2021 – 2032

 9.6.4 Automotive Dyno Market Size & Forecast,  By Vehicle, 2021 – 2032

 9.6.5 Automotive Dyno Market Size & Forecast, By End Use, 2021 – 2032

 9.6.6 Automotive Dyno Market Size & Forecast, By Country, 2021 – 2032

  9.6.6.1 UAE

   9.6.6.1.1 Automotive Dyno Market Size & Forecast, By Type, 2021 – 2032

   9.6.6.1.2 Automotive Dyno Market Size & Forecast, By Testing Mode, 2021 – 2032

   9.6.6.1.3 Automotive Dyno Market Size & Forecast,  By Vehicle, 2021 – 2032

   9.6.6.1.4 Automotive Dyno Market Size & Forecast, By End Use, 2021 – 2032

  9.6.6.2 Saudi Arabia

   9.6.6.2.1 Automotive Dyno Market Size & Forecast, By Type, 2021 – 2032

   9.6.6.2.2 Automotive Dyno Market Size & Forecast, By Testing Mode, 2021 – 2032

   9.6.6.2.3 Automotive Dyno Market Size & Forecast,  By Vehicle, 2021 – 2032

   9.6.6.2.4 Automotive Dyno Market Size & Forecast, By End Use, 2021 – 2032

  9.6.6.3 Qatar

   9.6.6.3.1 Automotive Dyno Market Size & Forecast, By Type, 2021 – 2032

   9.6.6.3.2 Automotive Dyno Market Size & Forecast, By Testing Mode, 2021 – 2032

   9.6.6.3.3 Automotive Dyno Market Size & Forecast,  By Vehicle, 2021 – 2032

   9.6.6.3.4 Automotive Dyno Market Size & Forecast, By End Use, 2021 – 2032

  9.6.6.4 Egypt

   9.6.6.4.1 Automotive Dyno Market Size & Forecast, By Type, 2021 – 2032

   9.6.6.4.2 Automotive Dyno Market Size & Forecast, By Testing Mode, 2021 – 2032

   9.6.6.4.3 Automotive Dyno Market Size & Forecast,  By Vehicle, 2021 – 2032

   9.6.6.4.4 Automotive Dyno Market Size & Forecast, By End Use, 2021 – 2032

  9.6.6.5 South Africa

   9.6.6.5.1 Automotive Dyno Market Size & Forecast, By Type, 2021 – 2032

   9.6.6.5.2 Automotive Dyno Market Size & Forecast, By Testing Mode, 2021 – 2032

   9.6.6.5.3 Automotive Dyno Market Size & Forecast,  By Vehicle, 2021 – 2032

   9.6.6.5.4 Automotive Dyno Market Size & Forecast, By End Use, 2021 – 2032

  9.6.6.6 Rest of Middle East & Africa

   9.6.6.6.1 Automotive Dyno Market Size & Forecast, By Type, 2021 – 2032

   9.6.6.6.2 Automotive Dyno Market Size & Forecast, By Testing Mode, 2021 – 2032

   9.6.6.6.3 Automotive Dyno Market Size & Forecast,  By Vehicle, 2021 – 2032

   9.6.6.6.4 Automotive Dyno Market Size & Forecast, By End Use, 2021 – 2032

10. Competitive Landscape

 10.1 Key Players' Positioning

 10.2 Competitive Developments

  10.2.1 Key Strategies Adopted (%), By Key Players, 2024

  10.2.2 Year-Wise Strategies & Development, 2021 – 2025

  10.2.3 Number Of Strategies Adopted By Key Players, 2024

 10.3 Market Share Analysis, 2024

 10.4 Product/Service & Application Benchmarking

  10.4.1 Product/Service Specifications & Features By Key Players

  10.4.2 Product/Service Heatmap By Key Players

  10.4.3 Application Heatmap By Key Players

 10.5 Industry Start-Up & Innovation Landscape

10.6 Key Company Profiles

 10.6.1 AVL List GmbH

  10.6.1.1 Company Overview & Snapshot

  10.6.1.2 Product/Service Portfolio

  10.6.1.3 Key Company Financials

  10.6.1.4 SWOT Analysis

 10.6.2 Dynojet Research

 10.6.3 HORIBA Automotive

 10.6.4 Magtrol Inc.

 10.6.5 MAHA Maschinenbau Haldenwang GmbH

 10.6.6 Meidensha Corporation

 10.6.7 Mustang Dynamometer

 10.6.8 Power Test

 10.6.9 Rototest

 10.6.10 SuperFlow Technologies

 10.6.11 Dynotech Research Inc.

 10.6.12 Dynotronics

 10.6.13 Flh Dyno Technologies

 10.6.14 Ardic

 10.6.15 Dynametric Dyne Systems

 10.6.16 Mainline Dyno

 10.6.17 Taylor Dynamometer

 10.6.18 Phoenix Dynamometer Technologies LLC

 10.6.19 Com-Ten Industries

 10.6.20 Dynapack USA

11. Analyst Recommendations

 11.1 SNS Insider Opportunity Map

 11.2 Industry Low-Hanging Fruit Assessment

 11.3 Market Entry & Growth Strategy

 11.4 Analyst Viewpoint & Suggestions on Market Growth

12. Assumptions

13. Disclaimer

14. Appendix

 14.1 List Of Tables

 14.2 List Of Figures

Key Segments:

By Type

  • Engine dynamometers

  • Chassis dynamometers

  • Transmission dynamometers

By Testing Mode

  • In-house testing

  • Outsourced testing

By Vehicle

  • Passenger vehicles 

  • Commercial vehicles 

By End Use

  • Automotive OEMs

  • Aftermarket service providers

  • Motorsport teams

Request for Segment Customization as per your Business Requirement: Segment Customization Request

Regional Coverage: 

North America

  • US

  • Canada

Europe

  • Germany

  • UK

  • France

  • Italy

  • Spain

  • Russia

  • Poland

  • Rest of Europe

Asia Pacific

  • China

  • India

  • Japan

  • South Korea

  • Australia

  • ASEAN Countries

  • Rest of Asia Pacific

Middle East & Africa

  • UAE

  • Saudi Arabia

  • Qatar

  • South Africa

  • Rest of Middle East & Africa

Latin America

  • Brazil

  • Argentina

  • Mexico

  • Colombia

  • Rest of Latin America

Request for Country Level Research Report: Country Level Customization Request

Available Customization 

With the given market data, SNS Insider offers customization as per the company’s specific needs. The following customization options are available for the report: 

  • Detailed Volume Analysis 

  • Criss-Cross segment analysis (e.g. Product X Application) 

  • Competitive Product Benchmarking 

  • Geographic Analysis 

  • Additional countries in any of the regions 

  • Customized Data Representation 

  • Detailed analysis and profiling of additional market players


An accurate research report requires proper strategizing as well as implementation. There are multiple factors involved in the completion of good and accurate research report and selecting the best methodology to compete the research is the toughest part. Since the research reports we provide play a crucial role in any company’s decision-making process, therefore we at SNS Insider always believe that we should choose the best method which gives us results closer to reality. This allows us to reach at a stage wherein we can provide our clients best and accurate investment to output ratio.

Each report that we prepare takes a timeframe of 350-400 business hours for production. Starting from the selection of titles through a couple of in-depth brain storming session to the final QC process before uploading our titles on our website we dedicate around 350 working hours. The titles are selected based on their current market cap and the foreseen CAGR and growth.


The 5 steps process:

Step 1: Secondary Research:

Secondary Research or Desk Research is as the name suggests is a research process wherein, we collect data through the readily available information. In this process we use various paid and unpaid databases which our team has access to and gather data through the same. This includes examining of listed companies’ annual reports, Journals, SEC filling etc. Apart from this our team has access to various associations across the globe across different industries. Lastly, we have exchange relationships with various university as well as individual libraries.

Secondary Research

Step 2: Primary Research

When we talk about primary research, it is a type of study in which the researchers collect relevant data samples directly, rather than relying on previously collected data.  This type of research is focused on gaining content specific facts that can be sued to solve specific problems. Since the collected data is fresh and first hand therefore it makes the study more accurate and genuine.

We at SNS Insider have divided Primary Research into 2 parts.

Part 1 wherein we interview the KOLs of major players as well as the upcoming ones across various geographic regions. This allows us to have their view over the market scenario and acts as an important tool to come closer to the accurate market numbers. As many as 45 paid and unpaid primary interviews are taken from both the demand and supply side of the industry to make sure we land at an accurate judgement and analysis of the market.

This step involves the triangulation of data wherein our team analyses the interview transcripts, online survey responses and observation of on filed participants. The below mentioned chart should give a better understanding of the part 1 of the primary interview.

Primary Research

Part 2: In this part of primary research the data collected via secondary research and the part 1 of the primary research is validated with the interviews from individual consultants and subject matter experts.

Consultants are those set of people who have at least 12 years of experience and expertise within the industry whereas Subject Matter Experts are those with at least 15 years of experience behind their back within the same space. The data with the help of two main processes i.e., FGDs (Focused Group Discussions) and IDs (Individual Discussions). This gives us a 3rd party nonbiased primary view of the market scenario making it a more dependable one while collation of the data pointers.

Step 3: Data Bank Validation

Once all the information is collected via primary and secondary sources, we run that information for data validation. At our intelligence centre our research heads track a lot of information related to the market which includes the quarterly reports, the daily stock prices, and other relevant information. Our data bank server gets updated every fortnight and that is how the information which we collected using our primary and secondary information is revalidated in real time.

Data Bank Validation

Step 4: QA/QC Process

After all the data collection and validation our team does a final level of quality check and quality assurance to get rid of any unwanted or undesired mistakes. This might include but not limited to getting rid of the any typos, duplication of numbers or missing of any important information. The people involved in this process include technical content writers, research heads and graphics people. Once this process is completed the title gets uploader on our platform for our clients to read it.

Step 5: Final QC/QA Process:

This is the last process and comes when the client has ordered the study. In this process a final QA/QC is done before the study is emailed to the client. Since we believe in giving our clients a good experience of our research studies, therefore, to make sure that we do not lack at our end in any way humanly possible we do a final round of quality check and then dispatch the study to the client.