Automotive 3D Map System Market Size
Get More Information on Automotive 3D Map System Market - Request Sample Report
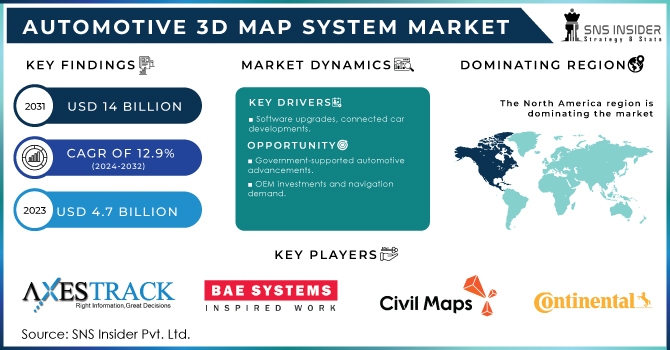
The Automotive 3D Map System Market size was recorded at USD 4.7 Billion in 2023 and is expected to reach USD 14 Billion by 2031 and grow at a CAGR of 12.9% over the forecast period of 2024-2031.
With a greater awareness of their surroundings thanks to 3D maps, drivers can negotiate tricky intersections and stay clear of potential hazards. 3D maps can produce navigation instructions that are more accurate by accounting for variables like elevation and road curvature. Advanced driver assistance systems (ADAS), which assist drivers in collisions avoiding, can be developed using 3D maps. For instance, ADAS can recognize possible hazards using 3D maps and alert drivers in accordance with those findings.
Automotive 3D mapping systems are a quickly evolving field of technology that could completely change how we drive. Comparing these systems to conventional 2D maps reveals several benefits, such as increased safety, more precise navigation, and better situational awareness. Nevertheless, there are a number of difficulties with 3D map systems, including expense, data collection, and data updates. The automotive 3D mapping systems market is anticipated to expand quickly in the upcoming years despite these obstacles. The growing need for self-driving cars, the creation of high-definition maps, and the introduction of 5G networks will propel this expansion. Overall, 3D map systems for automobiles are a promising technology that could improve the safety and effectiveness of our roads.
The growing popularity of smart transportation and driverless cars is driving a sharp increase in the automotive 3D map system market. To speed up the collection and accuracy of map data, cooperation between tech companies, automakers, and mapping providers is becoming more widespread. New developments in data distribution, integration, and collection are being fueled by the demand for real-time data updates.
| Report Attributes | Details |
|---|---|
| Market Segmentation | • by Navigation (In Dash Navigation, Portable Navigation), • by System (Hardware, Software), • by Vehicle Type (Passenger Vehicles, Commercial Vehicles) • by Sales Channel (OEM, Aftermarket) |
| Regional Analysis | North America (US, Canada, Mexico), Europe (Eastern Europe [Poland, Romania, Hungary, Turkey, Rest of Eastern Europe] Western Europe] Germany, France, UK, Italy, Spain, Netherlands, Switzerland, Austria, Rest of Western Europe]), Asia Pacific (China, India, Japan, South Korea, Vietnam, Singapore, Australia, Rest of Asia Pacific), Middle East & Africa (Middle East [UAE, Egypt, Saudi Arabia, Qatar, Rest of Middle East], Africa [Nigeria, South Africa, Rest of Africa], Latin America (Brazil, Argentina, Colombia, Rest of Latin America) |
| Company Profiles | Axestrack, BAE Systems, Civil Maps, Continental AG, Aptiv PLC, DENSO Corp, Google, HERE, NVIDIA Corp, Robert Bosch, V Tech GPS, Nippon Seiki |
Market Dynamics:
Driver:
The increase in software upgradation and the developments of connected cars.
In order to alert drivers to potential dangers and avert collisions, connected cars can communicate with infrastructure and with one another. Vehicle-to-vehicle (V2V) and vehicle-to-infrastructure (V2I) communication, for instance, can assist drivers in avoiding collisions and safely navigating through construction zones and traffic jams. Real-time traffic updates, remote diagnostics, and over-the-air software updates are just a few of the features that connected cars have to offer. With the aid of these features, drivers can drive more leisurely and save time and money.
Restrain:
The high cost associated with the manufacturing and the issues related to SKUs.
Opportunity
The rising technological advancement in automotive industry which is supported by government.
The investments by the major OEMs, and the ongoing trends related to the demand for navigations.
Because electric vehicles frequently have shorter ranges than conventional vehicles, it's critical for drivers to be able to carefully plan their routes. Drivers can avoid running out of battery life and find the best routes with the aid of navigation systems. Navigation systems are used by ride-sharing services like Uber and Lyft to assist drivers in finding their passengers and reaching their destinations quickly and effectively. With more traffic jams, construction zones, and other risks, urban traffic is getting more complicated. Drivers can avoid these risks and reach their destinations quickly and safely with the aid of navigation systems.
Challenges
The adaptability and the barriers related to shortages of semiconductors.
Impact of Russia Ukraine War:
With sanctions hampering Russia's auto industry, demand for 3D mapping systems in the region is expected to drop by 25%. This decline translates to a significant loss, considering Russia's pre-war contribution to the market. Conversely, the war has raised defense spending globally, pushing the development of high-precision 3D maps for military applications. This newfound demand is projected to inflate overall market costs by up to 10% as companies prioritize advanced mapping features and prioritize rapid development. Key players like Here Technologies, TomTom, and Baidu are strategically adapting their offerings to cater to this shift in demand, with a focus on high-definition maps for autonomous vehicles and defense applications. The long-term impact of the war on the market remains to be seen, but it has undoubtedly reshaped the focus and priorities within the automotive 3D map system landscape.
Impact of Economic Slowdown:
Reduced consumer spending power might lead to a dip in demand for new vehicles, particularly high-end models often equipped with these advanced navigation systems. This could potentially shrink the market by 5-7% in the short term. However, the long-term outlook remains positive. The slowdown is unlikely to derail the development of autonomous vehicles, which heavily rely on 3D maps for accurate navigation. Additionally, cost reductions in sensor technology down 10% annually and data storage solutions down 15% annually are making 3D maps more affordable to integrate into future vehicles.
Market Segmentation
By System:
Hardware, including LiDAR sensors, cameras, and GPS units, acts as the eyes and ears, capturing real-world data. This data makes up 20% of the market share. Software, the brain of the system and holds up to 80% of revenue share, it processes the data to generate high-definition 3D maps, enabling features like lane guidance and real-time traffic updates. Software advancements like AI and machine learning are crucial for refining map accuracy and integrating seamlessly with advanced driver-assistance systems (ADAS).
By Sales Channel:
The automotive 3D map system market is bifurcated by the channel through which they reach consumers: Original Equipment Manufacturers (OEMs) and the Aftermarket. OEMs, representing roughly two-thirds 65% of the market share, integrate 3D maps directly into new vehicles. This segment benefits from economies of scale and driver preference for factory-installed features. However, the Aftermarket, holding the remaining 35%, provides to older cars lacking 3D navigation or those seeking upgrades.
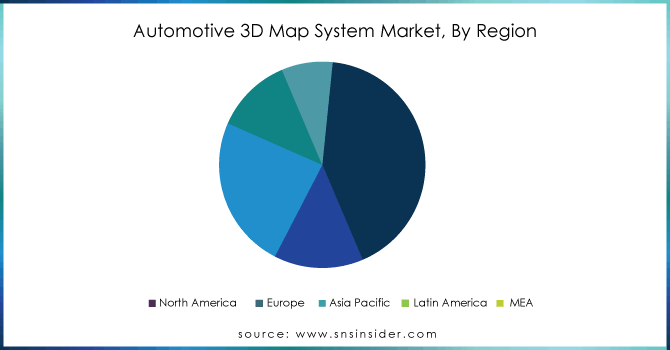
Regional Analysis:
The car 3D map system market is heavily influenced by the North American market, which comprises the US and Canada. The market for 3D mapping systems is driven by the existence of well-known automakers, technological firms, and a rising interest in self-driving cars. The development of 3D mapping in this area has been fueled by investments in autonomous driving technologies and regulatory support. There are a few key companies that control the majority of the North American automotive 3D map system market: HERE Technologies, TomTom, and Nvidia. These businesses are devoting significant resources to creating and enhancing their 3D mapping systems. For instance, HERE Technologies and Daimler have teamed to create HD maps specifically for driverless cars. Real-time 3D mapping for ADAS systems is being developed by TomTom in collaboration with Volkswagen and Audi. Additionally, Nvidia is creating DriveWorks, a 3D mapping system specifically designed for self-driving cars.
In APAC, China leads the markets for automotive 3D map systems, which are followed by South Korea, Japan, and India. The need for automotive 3D map systems is being driven by the Chinese government's significant investments in the development of intelligent transportation and smart city systems. The need for automotive 3D map systems is being driven by the significant investments made in autonomous driving technology by the automotive industries in South Korea and Japan.
Get Customized Report as per Your Business Requirement - Request For Customized Report
Key Players
The major key players are Axestrack, BAE Systems, Civil Maps, Continental AG, Aptiv PLC, DENSO Corp, Google, HERE, NVIDIA Corp, Robert Bosch, V Tech GPS, Nippon Seiki and others.
Axestrack-Company Financial Analysis
RECENT DEVELOPMENTS:
-
HERE Technologies is collaborating with data providers like INCREMENT P to expand their map content.
-
Nvidia are working with automakers to develop high-definition maps specifically for autonomous vehicles.
-
Partnerships are forming between mapping companies and traditional automotive suppliers, like the one between Dynamic Map Platform and Valeo, to create seamless localization and map update solutions.
| Report Attributes | Details |
| Market Size in 2023 | US$ 4.7 Billion |
| Market Size by 2031 | US$ 14 Billion |
| CAGR | CAGR of 12.9 % From 2024 to 2031 |
| Base Year | 2023 |
| Forecast Period | 2024-2031 |
| Historical Data | 2020-2022 |
| Report Scope & Coverage | Market Size, Segments Analysis, Competitive Landscape, Regional Analysis, DROC & SWOT Analysis, Forecast Outlook |
| Key Drivers | The increase in software upgradation and the developments of connected cars. |
| Market Restraints | The adaptability and the barriers related to shortages of semiconductors. |
Frequently Asked Questions
The increase in software upgradation and the developments of connected cars.
The major key players are Axestrack, BAE Systems, Civil Maps, Continental AG, Aptiv PLC, DENSO Corp, Google, HERE, NVIDIA Corp, Robert Bosch, V Tech GPS, Nippon Seiki and others.
Asia Pacific is the dominating and the fastest growing region of the Automotive 3D Map System Market.
The Automotive 3D Map System Market System was recorded at USD 4.7 Bn in 2023 and is expected to reach USD 14 Bn by 2031.
The Compound Annual Growth rate for Automotive 3D Map System Market over the forecast period is 12.9 %.
Get in Touch
