Bag On Valve Product Market Report Scope & Overview:
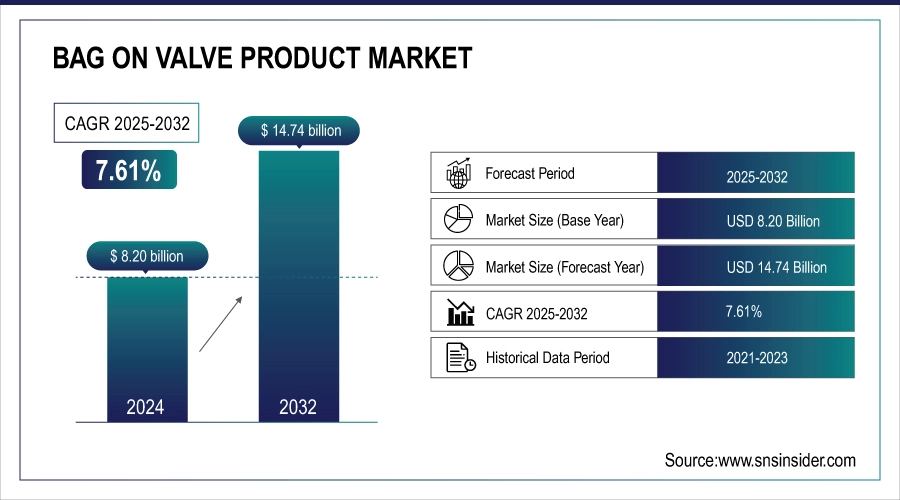
The Bag On Valve (BOV) Product Market was valued at USD 8.20 Billion in 2024 and is projected to reach USD 14.74 Billion by 2032, expanding at a CAGR of 7.61% during 2025–2032.
The Bag On Valve Product Market is on an Evolution Track with Growing Demand from Consumers for Easy-to-use, Quick, Hygienic, and Eco-friendly Packaging Products. In recent years, innovations in aerosol and dispensing technologies are likely to play an important role in shaping the Bag On Valve Product Market Trends by providing a high-fidelity product delivery mechanism along with extended shelf life and lower wastage. A significant growth is observed in sectors such as industrial, personal care, pharmaceuticals, food & beverage, which require packaging to be airtight & contamination-free. The Bag On Valve Product Market Growth is poised with the increasing awareness regarding sustainability and rapidly improving valve design technology. In addition to that, expanding applications and increasing adoption in developing regions are some factors have a positive impact on the market.
Bag On Valve (BOV) Product Market Size and Forecast
-
Market Size in 2024: USD 8.20 Billion
-
Market Size by 2032: USD 14.74 Billion
-
CAGR: 7.61% from 2025 to 2032
-
Base Year: 2024
-
Forecast Period: 2025–2032
-
Historical Data: 2021–2023
To Get more information On Bag On Valve Product Market - Request Free Sample Report
In October 2023, LINDAL Group expanded its Bag-on-Valve (BoV) production in Europe and North America, adding new lines in France and the USA. This move aims to meet growing global demand, improve lead times, and offer more flexibility to customers. The expansion also supports R&D services and technical guidance through LINDAL’s Application Lab.
Key Bag On Valve Product Market Trends
-
High adoption of recyclable aluminum cans and eco-friendly propellants.
-
Rising penetration due to product purity, accurate dosing, and contamination prevention.
-
Development of lightweight, cost-efficient, and high-performance male and female valves.
-
Green building standards and circular economy initiatives driving compliance adoption.
-
Pipeline for hybrid and bio-based can materials strengthening sustainability.
U.S. Bag On Valve Product Market Insights
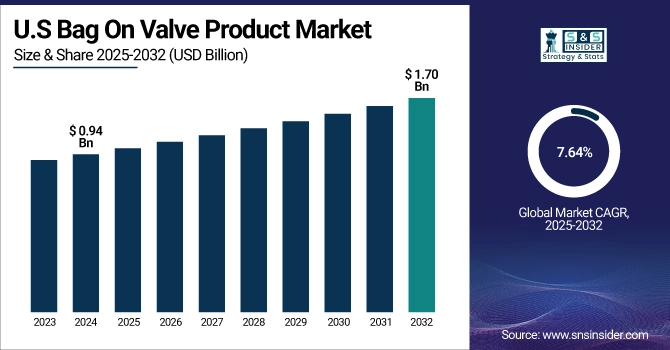
The U.S. Bag-on-Valve (BOV) market was valued at around USD 0.94 billion in 2024 and is expected to grow to USD 1.70 billion by 2032, reflecting a strong CAGR of 7.64%. This growth is primarily driven by increasing consumer preference for eco-friendly and sustainable packaging solutions in personal care, cosmetics, and food products. Additionally, advancements in BOV technology, such as improved dispensing accuracy, reduced product wastage, and enhanced product preservation, are encouraging manufacturers to adopt these systems more widely.
Bag On Valve Product Market Growth Drivers:
-
Bag-On-Valve (Bov) Technology – Eco-Friendly Packaging Reducing Vocs and Boosting Consumer Preference
On bag-on-valve product Industry is rapidly evolving with the adoption of Bag-on-valve technology, which is transforming the packaging sector. Bag-on-valve packaging serves as an alternative to conventional aerosols by decreasing VOC emissions and using recyclable products, such as aluminum. Compressed air/nitrogen driven BoV technology in a move towards BoV technology that utilizes compressed air or nitrogen as opposed to hydrocarbon propellants, which results in low VOC emissions and reduced indoor & outdoor air pollution. BoV packaging also predominantly uses aluminum a material with a high recycling rate, whose beverage can recycle rates in the EU reach around 76%. This innovation addresses the increasing consumer and regulatory requirements for sustainable packaging options, as 90% of consumers are more inclined to purchase brands that use sustainable packaging, and 54% have made a conscious effort to purchase products with sustainable packaging in the past six months.
In July 2025, Wejing Machinery highlights the eco-friendly benefits of Bag-on-Valve (BoV) aerosols. Using compressed air or nitrogen instead of chemical propellants, BoV reduces emissions and fire risks. Its design allows up to 99.5% product usage, minimizing waste and improving recyclability. Separating product and propellant prevents pollution, supporting sustainable and safer packaging trends.
Bag On Valve Product Market Restraints:
-
Rising Production Costs Impact the Adoption of Bag-On-Valve (Bov) Packaging Despite Its Benefits
The Bag-on-Valve (BoV) packaging system, while offering advantages like product purity and extended shelf life, incurs higher production costs compared to traditional aerosol packaging. For instance, the price of a BoV valve is in the range of USD 0.15, while a classical solenoid valve is about USD 0.03. Moreover, the complexity of the production process, using special parts like multi-layer laminate bags and specialized filling machines, leads to a higher price. Such inflated expenses can cause BoV products to command a higher price point at retail, and as a result, may hinder uptake among the mass market of cost-conscious consumers and small to medium-sized manufacturers. As a result, although BoV tech increases the integrity of the product itself, the higher production costs are still a major consideration for a manufacturer or consumer to weigh.
Bag On Valve Product Market Opportunities:
-
Bag-on-Valve (BoV) Technology Advancing Precision, Hygiene, and Sustainability in Pharmaceutical and Cosmetic Packaging
Bag-on-Valve (BoV) technology is revolutionizing the pharmaceutical and cosmetic industries by offering precise, hygienic, and eco-friendly dispensing solutions. In 2024, over 320 pharmaceutical brands globally transitioned to BoV packaging to meet clean-label demands and ensure accurate dosage delivery. Demand for these is most pronounced in aerosol-based inhalers as well as antiviral sprays and wound care products where the product must be kept in pristine condition. In cosmetic industry, BoV systems are increasingly applied in products such as deodorants, hairsprays and shaving foams given booming consumer demand for natural and organic personal care products. Easily dispensed at any angle, the technology is well-suited for use in difficult-to-reach locations, where convenience is a factor. Carbon footprints can also be lowered through the use of compressed air or nitrogen as propellants in BoV packaging with the goal of reaching sustainability. The synergy of cleanliness, accuracy, and eco-friendliness put BoV technology as one of the most significant leap forward in the pharmaceutical and cosmetic packaging field.
Bag On Valve Product Market Segment highlights
-
By Product, Pharmaceutical dominates with 38% in 2024; Food & Beverage is the fastest growing.
-
By Container Type, Aluminum Cans dominate with 48% in 2024; Plastic Cans are the fastest growing.
-
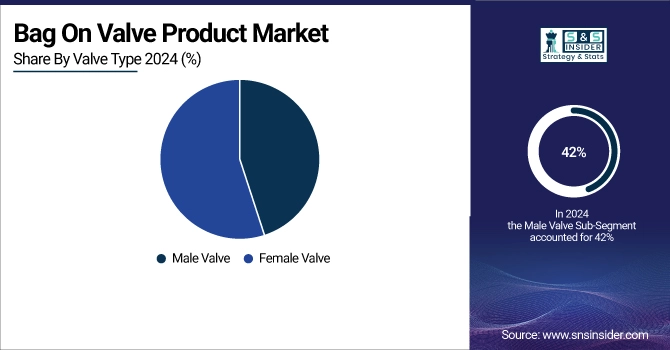
By Valve Type, Male Valve dominates with 42% in 2024; Female Valve is the fastest growing.
-
By Propellant Type, Compressed Air dominates with 52% in 2024; Nitrogen is the fastest growing.
Bag On Valve Product Market Segment Analysis
-
By Product, Pharmaceutical Segment Leads While Food & Beverage Emerges as Fastest-Growing in the 2024 Bag-On-Valve Product Market
In 2024, the pharmaceutical segment dominates the Bag On Valve product market. The increasing need for accurate and sterile dispensing solutions in medical applications is driving this segment higher. BoV technology has low contamination risk and delivers accurate dosage, ideal for sprays, inhalation, antiseptics, and wound care products. The pharmaceutical sector is adopting BoV systems increasingly as they are reliable, efficient, and will ensure the integrity of the product. Additionally, the increasing emphasis on clean-label products and patient safety turns pharmaceuticals into the strongest segment throughout the year, thereby driving its dominance as well.
The food and beverage segment is the fastest-growing in 2024. To maintain freshness, prevent spoilage and reduce waste in beverages, sauces and other consumables, manufacturers are adopting BoV technology. Its shelf life extension capability and quality preservation property coupled with convenience factor is witnessing rapid adoption of BoV packaging. This segment is gaining significant momentum due to sustainability initiatives and increased consumer preference towards eco-friendly products.
-
By Container Type, Aluminum Cans Lead the Bag on Valve Market In 2024 While Plastic Cans Emerge as The Fastest-Growing Segment
Aluminum cans dominate the Bag on Valve market in 2024. These properties allow the materials to be adapted to a wide range of applications, such as pharmaceuticals, cosmetics, and beverages, thanks to their flexibility, low weight, and good barriers. Recyclability of aluminum and its property of being pressure and weather resistant keep products safe and long-lasting. Aluminum is a favorite among the bigwigs as it keeps the product in the best condition and it is also easy to accommodate in the already existing dispensing systems. Given the coalescence of historic usage across two industries and well-established performance-to-criteria, aluminum cans dominate BoV with functional and environmental adequacy.
Plastic cans are the fastest-growing container type in 2024. They are used more and more by manufacturers because they provide flexibility of design, low weight and cost effectiveness. Research in sustainable plastics and recycling technologies are improving the sustainability of plastic cans. This segment is driven by demand for convenient and environmentally friendly packaging that meets consumers expectations and the needs of new product categories, especially in food, beverages, and personal care applications.
-
By Valve Type, Male Valves Lead The Bov Market In 2024 While Female Valves Emerge as the Fastest-Growing Segment
Male valves dominate the BoV market in 2024. High compatibility with various product types along with durable design coupled with ease of mounting have made them a common choice across pharmaceuticals, cosmetics and personal care. The ability of male valves to enable reliable dispensing, avoid leakage, and preserve the integrity of products has helped them maintain a dominant position in the global valves market. The wide-spreading adoption of the technology in established markets validates its ability to provide clean, precise solutions.
Female valves are the fastest-growing segment in 2024. The ergonomic design, innovative dispensing systems, and leak-prevention functionalities are appealing to niche market manufacturers engaged in specialty beverages, cleaning sprays, and emerging pharmaceutical formulations. The proliferation of female valves indicate a consumer-driven market that emphasizes convenient access of products and offers differentiation and technology from the Bag On Valve.
-
By Propellant Type, Compressed Air Dominates BoV Market in 2024 While Nitrogen Emerges as the Fastest-Growing Propellant
Compressed air dominates the BoV market in 2024. It is widely used in pharmaceuticals, cosmetics, and food products due to its safety, non-toxic, and environmentally friendly nature. For sensitive formulations, chemical risks are often the watchlist-compromising aspect of the process, but compressed air ensures they do not occur, safely dispensing every time. Its established nature and effectiveness throughout various industries continue to guarantee its dominance.
Nitrogen is the fastest-growing propellant type in 2024. In beverages, skin care, and medical sprays, its ability to prevent oxidation, prolong storage times, and maintain the integrity of the product is prized. The increase in consumer demand for clean-label and chemical-free products is providing a push towards the adoption of nitrogen. The expansion of the nitrogen-class BoV systems further enables sustainability objectives, substantiating its growing importance in the marketplace.
Bag On Valve Product Market Regional highlights
-
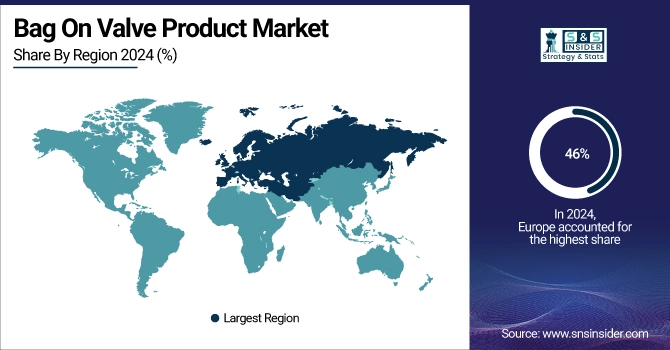
North America: Holds a 16% market share in 2024.
-
Europe: Dominates the market with a 46% share in 2024.
-
Asia-Pacific: Fastest-growing region with a 22% share in 2024.
-
Middle East & Africa: Accounts for 12% of the market in 2024.
-
Latin America: Contributes 4% to the market in 2024.
Europe Bag On Valve Product Market Insights
Europe dominated the global Bag-on-Valve (BOV) market in 2024. Europe's Strict environmental regulations and high customer preference for sustainable packaging have made this region to perform strongly. Germany, France, and the UK are likely to be significant BOV producers and players across the EU region. Major contributions are made mainly from the personal care and cosmetics sectors, taking advantage of the BOV systems for the sanitary, clean, and convenient dispensing of products. Research indicates that over 70% of European consumers are more inclined to buy products that use sustainable packaging solutions, also more than 60% of BOV manufacturing investment is situated in these top countries. Market penetration has been boosted by increasing concern over product integrity and waste reduction.
Get Customized Report as per Your Business Requirement - Enquiry Now
Asia-Pacific Bag-On-Valve Product Market Insights
Asia-Pacific is the fastest-growing region in the BOV market. The growing demand for packaged products with convenient dispensing as a result of rapid industrialization, urbanization, and increasing disposable incomes in countries such as China, India, and Japan is expected to drive the growth of the market. BOV adoption for personal care, cosmetics, and food industries is driven by changing lifestyles, increasing environmental consciousness, and the transition to sustainable packaging. To reap the benefits of this fast-growing market, businesses are establishing manufacturing plants and distribution channels locally. The growth potential is further complemented by technology focused on mass production and local consumer demand. The region will likely continue its strong growth, becoming an important driver of the global BOV market.
North America Bag On Valve Product Market Insights
North America holds a significant share of the global Bag-on-Valve (BOV) product market. Increasing demand for sustainable and convenient packaging solutions in the personal care and cosmetics and food & beverage sectors is fueling the growth of the region. Increasing consumer awareness about the need for environmentally friendly products is propelling manufacturers to utilize BOV technology to reduce their adverse environmental effects. The market is further driven by technological advancements in BOV systems such as the implementation of improved dispensing, precision, and minimal product waste. Furthermore, the additional government initiatives in sustainability and reduced usage of chemical propellants also support this trend, and therefore accelerate the BOv demand. With this mix of innovation, consumer preference, and regulation, North America will continue to experience steady growth overall.
Middle East & Africa Bag On Valve Product Market Insights
The Middle East & Africa market is experiencing growth driven by rising demand for packaged goods, especially in personal care, cosmetics, and food & beverage sectors. Countries like UAE and South Africa are rapidly adopting BOV technology as this type of dispensing meets consumer expectations for hygienic, sustainable, and convenient product dispensing. Local production, technology usage, and initiatives promoting green solutions all support market development. Despite a smaller market share within the region, consistent adoption trends could mean sustainability and growth in the long term. Also market growth is anticipated high due to the increasing inclination towards sustainability and government support towards eco-friendly packaging is expected to propel the market demand.
Latin America Bag-On-Valve Product Market Insights
Latin America is gradually adopting BOV solutions, with countries such as Brazil and Mexico showing growing interest in sustainable and cost-effective packaging. Growing consumer awareness and the need for convenience, along with interest towards eco-friendly products, is driving the market growth. Manufacturers are looking to leverage BOV technology in personal care, cosmetics, and food & beverage segments. Though representing a small portion of the market, the area is seeing plenty of potential as people become aware of the advantages of the products. The gradual investment towards infrastructure to support novel BOV systems is anticipated to drive steady market growth during the forecast period.
Competitive Landscape for Bag On Valve Product Market:
Founded in 1976, Summit Packaging Systems is a leading global manufacturer of aerosol valves and actuators. Headquartered in Manchester, New Hampshire, USA, the company operates five strategically located manufacturing facilities worldwide. Summit produces over 100 million parts daily, emphasizing quality, innovation, and customer satisfaction.
In June 2024, Summit Packaging Systems expanded its Bag-On-Valve (BOV) production capacity in Almere, Netherlands, by adding two high-speed assembly lines. This expansion increased the site's annual BOV production capacity to over 300 million units, catering to the growing demand in personal care, cosmetics, and food industries. The new lines feature in-house designed technology, including inline bag forming and layer packing, enhancing efficiency and product integrity.
Colep Packaging, established in 1965 in Vale de Cambra, Portugal, is a leading provider of metal and plastic packaging solutions. As part of the RAR Group, it specializes in aerosol and general line packaging. With over 50 years of experience, Colep operates facilities in Portugal, Poland, Spain, and Mexico.
In October 2023, Colep Packaging and the Envases Group entered into a joint venture to build an aerosol packaging facility in Mexico. The partnership, structured as a 50/50 shareholding, involves an initial investment exceeding USD 30 million over two years.
Salvalco, officially known as The Salford Valve Company Ltd, was founded in 2013 and is headquartered in York, United Kingdom. The company specializes in developing eco-friendly aerosol valve technologies, notably the Eco-Valve, which utilizes inert gases like nitrogen or fresh air as propellants, replacing traditional hydrocarbons. This innovation significantly reduces environmental impact and enhances safety in aerosol products.
In December 2024, Salvalco announced the expansion of its Eco-Valve range with the launch of the Eco-Inverted ball valve. Specifically designed for use with inert gas propellants like nitrogen, this new valve offers all the advantages of the Eco-Valve line, including enhanced performance while reducing environmental impact.
Bag On Valve Product Market Key Players:
-
Coster Group
-
LINDAL Group
-
Summit Packaging Systems
-
Precision Valve Corporation
-
Exal Corporation
-
CHT Group
-
DS Containers
-
KOH-I-NOOR Mlada Vožice a.s.
-
Shanghai Golden Aerosol Co. Ltd.
-
Chicago Aerosol LLC
-
BOV Solutions Inc.
-
Colep Packaging
-
Solmatic Group Sp. z o.o.
-
Crown Holdings Inc.
-
Ball Corporation
-
Signature Filling Company
-
Amcor PLC
-
MAJESTIC Packaging Solutions
| Report Attributes | Details |
|---|---|
| Market Size in 2024 | USD 8.20 Billion |
| Market Size by 2032 | USD 14.74 Billion |
| CAGR | CAGR of 7.61% From 2025 to 2032 |
| Base Year | 2024 |
| Forecast Period | 2025-2032 |
| Historical Data | 2021-2023 |
| Report Scope & Coverage | Market Size, Segments Analysis, Competitive Landscape, Regional Analysis, DROC & SWOT Analysis, Forecast Outlook |
| Key Segments | • By Product (Personal Care, Household Care, Pharmaceutical, Food & Beverage, Automotive & Industrial) • By Valve Type (Male Valve, Female Valve) • By Container Type (Aluminum Cans, Tinplate Cans, Plastic Cans) • By Propellant Type (Compressed Air, Nitrogen, Carbon Dioxide) |
| Regional Analysis/Coverage | North America (US, Canada, Mexico), Europe (Germany, France, UK, Italy, Spain, Poland, Turkey, Rest of Europe), Asia Pacific (China, India, Japan, South Korea, Singapore, Australia, Rest of Asia Pacific), Middle East & Africa (UAE, Saudi Arabia, Qatar, South Africa, Rest of Middle East & Africa), Latin America (Brazil, Argentina, Rest of Latin America) |
| Company Profiles | Coster Group, AptarGroup, LINDAL Group, Summit Packaging Systems, Precision Valve Corporation, Exal Corporation, Terco Inc., CHT Group, DS Containers, KOH-I-NOOR Mlada Vožice a.s., Shanghai Golden Aerosol Co. Ltd., Chicago Aerosol LLC, BOV Solutions Inc., Colep Packaging, Solmatic Group Sp. z o.o., Crown Holdings Inc., Ball Corporation, Signature Filling Company, Amcor PLC, MAJESTIC Packaging Solutions |
Get in Touch
