Battle Royale Games Market Report Scope & Overview:
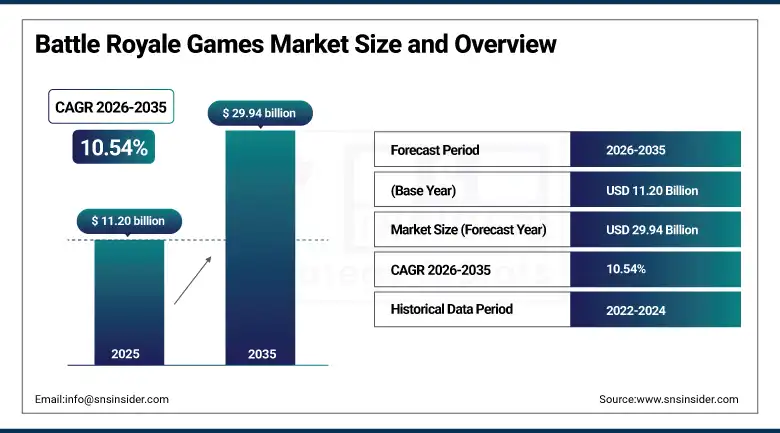
The Battle Royale Games Market was valued at USD 11.20 Billion in 2025 and is expected to reach USD 29.94 Billion by 2035, growing at a CAGR of 10.54% from 2026–2035.
Battle royale games have changed significantly from being a minor sub-genre of video games to one of the most commercially successful genres in the gaming industry around the world. This particular sub-genre is defined by having large numbers of competitors who fight against each other until one individual wins the game. This has led to increased competitiveness, uncertain results, and a built-in viewing factor that makes it ideal for all kinds of people.
It is important to acknowledge the commercial success of the battle royale genre in terms of its two most prominent games, namely, PUBG: Battlegrounds and Fortnite, since these two titles established the commercial foundation for the rest of the genre. The most popular game, Fortnite, has already achieved a total number of users in excess of 350 million. Garena Free Fire had more than 100 million daily active users in early 2024.
Epic Games introduced the Persona Device at the State of Unreal 2025. The Persona Device is an AI system incorporated into Unreal Editor that enables developers to make characters powered by artificial intelligence. It is clear that the future for the battle royale genre lies in AI-generated content since it takes gaming from the realm of human vs human to human vs artificial.
Market Size and Forecast
-
Market Size in 2026E: USD 12.38 Billion
-
Market Size by 2035: USD 29.94 Billion
-
CAGR: 10.54% from 2026 to 2035
-
Fastest Growing Region: Asia Pacific
-
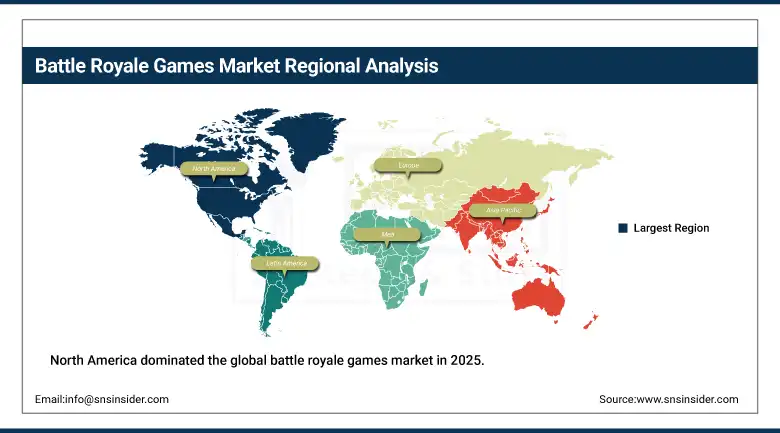
Largest Region: North America
To Get more information On Battle Royale Games Market - Request Free Sample Report
Battle Royale Games Market Trends
-
AI-driven gameplay and procedural content generation are improving player engagement and game dynamics.
-
Growing cross-platform play is expanding multiplayer accessibility across mobile, PC, and console platforms.
-
Rising investments in esports tournaments and gaming leagues are increasing competitive gaming popularity.
-
Entertainment IP collaborations and crossover events are attracting new players and boosting in-game purchases.
-
Mobile-first game development strategies are driving market expansion across emerging smartphone gaming regions.
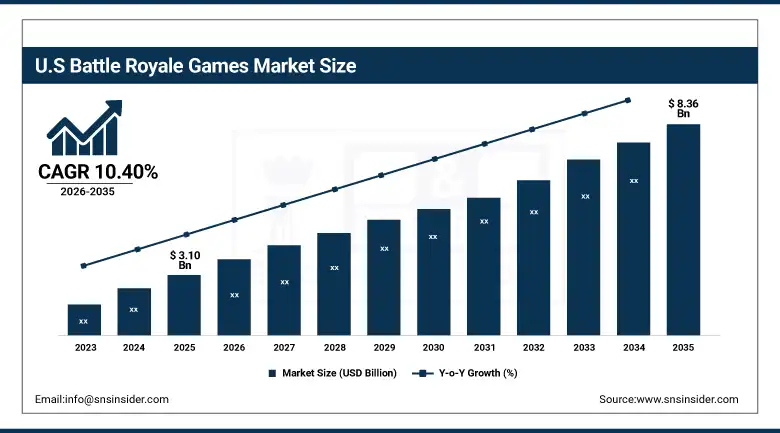
The U.S. Battle Royale Games Market Outlook
The U.S. Battle Royale Games Market was valued at approximately USD 3.10 Billion in 2025 and is expected to reach approximately USD 8.36 Billion by 2035, growing at a CAGR of approximately 10.40%.
The US stands out as the top battle royale country within the world, in terms of revenue value. This can be attributed to the combination of the top average revenue per user among all markets and the high engagement from its sizable number of gamers across PCs, consoles, and mobile devices. Both Fortnite and Apex Legends originated from U.S.-based developers and have notable audiences of gamers playing these games at home. The U.S. battle royale market benefits considerably from the involvement of eSports in generating revenue from the sector. Battle royale games hosted in U.S. esports tournaments garner millions of viewers on their streams. They receive substantial investment from brands through sponsorships and advertisements. Moreover, college programs offering esports help in making the act of playing competitively accepted among young people, resulting in a continuous flow of players participating and viewing battle royale competitions.
The new game mode called Blitz Royale introduced by Epic Games in June 2025 in response to US gamers’ demand for quick and cross-platform friendly matches that will take only five minutes with 32 players is set to affirm the potential of rapid-format battle royale gaming as a distinct commercial segment.
Battle Royale Games Market Segment Analysis
-
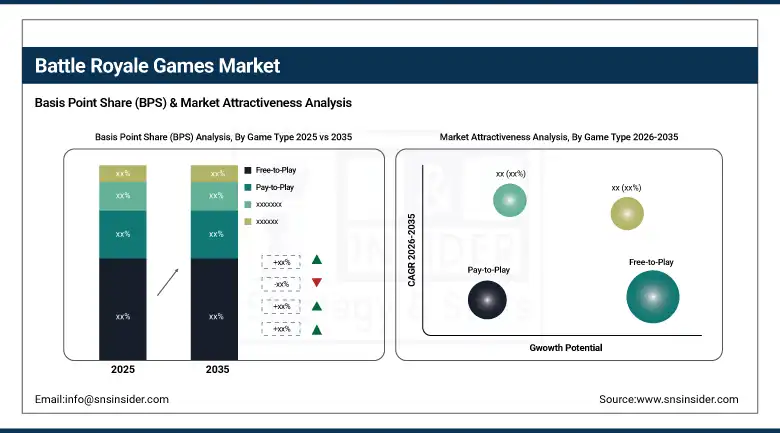
By Game Type, free-to-play dominated with approximately 78% share in 2025 through its removal of entry barriers, mass audience accessibility across all income demographics, and its proven monetization effectiveness through in-game cosmetic purchases and battle passes. Pay-to-Play is the fastest-growing segment at a CAGR of 12.52%.
-
By Platform, mobile dominated the battle royale games market in 2025, driven by the accessibility of smartphones across all income levels, the global availability of free-to-play mobile titles including PUBG Mobile, Garena Free Fire, and Call of Duty: Mobile, and the exceptional market penetration of mobile gaming in Asia Pacific which accounts for the majority of global battle royale player volume. PC is the fastest-growing platform driven by the rising adoption of gaming laptops and desktops in emerging markets.
-
By End User, adults led the battle royale games market in 2025 through their surging disposable income, strong interest in competitive online gaming, and active participation in streaming and esports. Teenagers are expected to grow at the fastest CAGR.
By Game Type, free-to-play dominates, pay-to-play grows fastest
Free-to-Play continued its lead as the leading game type with a market share of roughly 78% by 2025. The success of the business model is indisputable; the absence of payment upfront ensures maximum player acquisition, and with maximum players comes high match density, minimal wait time, and the social networks needed for long-term play. Free-to-play monetizes through voluntary cosmetics, battle passes, and limited-edition items purchased only by engaged players willing to invest while ensuring everyone can access the product for free.
Pay-to-Play is the fastest-growing segment with a Compound Annual Growth Rate of 12.52% until 2035. This growth can be attributed to an existing and valuable group of players looking for premium experiences. Such players require games that have no ads, no coercive free-to-play monetization mechanisms, and games which have all their content unlocked upon purchasing them. PUBG: Battlegrounds was once a paid title but changed over to the free-to-play model, proving that paid titles can last just as well depending on the player segment. With gaming growing up into a full-fledged hobby category, there is a certain portion of more mature players with disposable income who find themselves inclined towards a premium experience.
By Platform, mobile dominates, PC grows fastest
Mobile retained the dominant platform position in the battle royale games market in 2025. The reasons are demographic and economic. Smartphones are the most widely owned computing device on the planet. In Asia Pacific, Latin America, and Africa, a large proportion of the population accesses the internet exclusively through mobile devices. Battle royale titles built for mobile, including PUBG Mobile, Free Fire, and Call of Duty: Mobile, have each attracted hundreds of millions of players in markets where PC and console gaming are economically inaccessible. The mobile platform’s dominance is structural rather than cyclical. It reflects the underlying distribution of computing access globally.
PC is the fastest-growing platform in the battle royale games market. The growth is being driven by rising PC gaming hardware penetration in emerging economies, particularly in Southeast Asia, India, and Eastern Europe, where affordable gaming laptops and desktops are becoming accessible to middle-class consumers for the first time. PC offers the highest-quality gameplay experience, most precise control input, and largest competitive scene. It is the platform of choice for the most commercially valuable players who spend most on in-game purchases and engage most with esports content. PC’s faster-than-average growth within the segment reflects the ongoing premiumization of gaming as a category as income levels rise in key emerging markets.
By End User, adults dominate, teenagers grow fastest
The end user group of adults remained the leading one in the battle royale games market in 2025. High disposable incomes, high levels of competitiveness in online games, and active engagement with streaming and esports characterize the adult end user commercially. Most money is earned through adult gamers' in-game activity. Adults are much more inclined to buy battle passes, spend on cosmetics, and become subscribers of additional gaming products like Xbox Game Pass and PlayStation Plus. Adult gamers are more consistent and have higher day-to-day and month-to-month retention rates than younger players due to the lack of time related to schooling.
The rapidly growing end user group consisted of teenagers. There were several reasons for this rapid growth. First of all, smartphone penetration rate increased rapidly amongst teenage groups around the world. Free mobile games are easily accessible for teenagers and do not require parental permission or expensive equipment purchases. Battle royale games are the primary genre played among friends at schools in North America, Europe, and Asia Pacific. Motivation to play the same game as your friends cannot be achieved with commercial advertising. Teenagers in developing countries with smartphones have access to gaming industry only through battle royale mobile games.
Regional Analysis
|
Region |
Major Country |
Share within Region, 2025 (%) |
|---|---|---|
|
North America |
United States |
83.4% |
|
Europe |
Germany |
22.3% |
|
Asia Pacific |
China |
61.7% |
|
Middle East & Africa |
Saudi Arabia |
38.4% |
|
Latin America |
Brazil |
44.2% |
North America Battle Royale Games Market Insights
North America dominated the global battle royale games market in 2025. The United States accounted for approximately 83.4% of North American revenues. The U.S. hosts the most commercially sophisticated gaming market in the world, combining the highest per-player spending, the largest concentration of major game publishers and studios, and the most developed esports and content creator economy of any national market. Fortnite and Apex Legends, both U.S.-developed titles, maintain dominant positions in domestic player rankings. Canada contributes approximately 16.6% of North American revenues through a large gaming population, established game development studios including Behaviour Interactive and Relic Entertainment, and a streaming and esports community that mirrors U.S. trends in engagement and spending behaviour.
Get Customized Report as per Your Business Requirement - Enquiry Now
Europe Battle Royale Games Market Insights
Europe is a commercially significant battle royale games market characterised by strong PC gaming culture, established esports leagues, and a well-funded content creator community across platforms including Twitch, YouTube, and Kick. Germany accounts for approximately 22.3% of European revenues as the region’s largest national gaming market. German players demonstrate above-average engagement with competitive PC titles and strong participation in premium gaming experiences. The European market’s regulatory environment is shaping game monetisation. Several European jurisdictions have moved to regulate loot box mechanics as gambling, compelling publishers to redesign some in-game purchase systems for European markets. This is accelerating the transition toward transparent cosmetic-only purchase models that provide clear value without randomised outcome dependency.
Asia Pacific Battle Royale Games Market Insights
Asia Pacific is the fastest-growing regional battle royale games market at a CAGR of approximately 22.17%, driven by rapid smartphone penetration, affordable internet access, and the rising popularity of free-to-play mobile titles across China, India, Southeast Asia, Japan, and South Korea. China accounts for approximately 61.7% of Asia Pacific revenues through the massive scale of its mobile gaming market. Tencent’s ownership of PUBG Mobile through its investment in Krafton and its dominant position in Chinese mobile gaming distribution gives it unmatched market access. India is the most commercially significant emerging battle royale market globally. Free Fire and BGMI (Battlegrounds Mobile India, the Indian version of PUBG Mobile) have each accumulated hundreds of millions of registered players. Rising 5G coverage, affordable data plans, and a young demographic skew are sustaining rapid player acquisition. Esports leagues including Nodwin Gaming’s BGMI tournament series are professionalising competitive mobile battle royale for Indian audiences.
MEA & Latin America Battle Royale Games Market Insights
Middle East and Africa and Latin America are growing battle royale markets where expanding smartphone penetration, improving mobile internet infrastructure, and the global availability of free-to-play mobile titles are creating rapidly expanding player bases. Saudi Arabia leads MEA revenues at approximately 38.4% of the regional total. High smartphone penetration, a young population, and growing esports infrastructure under Vision 2030’s digital entertainment agenda are driving engagement with both competitive and casual battle royale formats. Brazil leads Latin American revenues at approximately 44.2% of the regional total. Brazil has one of the world’s largest mobile gaming communities. Free Fire is particularly dominant in Brazil, where Garena has invested heavily in local esports events and influencer partnerships that have embedded the title deeply in Brazilian gaming culture. The broader Latin American market benefits from the free-to-play model’s accessibility in markets where disposable incomes limit paid gaming expenditure.
Market Dynamics
Growth Drivers: Rising smartphone penetration expanding mobile battle royale access, free-to-play model enabling mass market reach, and esports and streaming economy driving audience growth and brand investment
Key growth factors driving the structure of the battle royale games market include the worldwide proliferation of smartphones with mobile internet access, which is allowing this genre to reach hundreds of millions of new users in APAC, South Asia, and Latin America who lack access to PC and console-based games. The pay-to-play model means they can be excluded on economic grounds; this cost obstacle is eliminated by free-to-play. Esports and gaming streaming are equally important factors behind demand. Battle royale games’ spectator-friendly format – where spectators can watch players in real-time competition with the map and number of players displayed, provides broadcast material. Twitch, YouTube Gaming, and TikTok create billions of hours’ worth of battle royale viewing each year. This is an important driver of organic player recruitment through conversion from spectators to actual gamers.
Restraints: Genre saturation creating difficulty for new market entrants, high ongoing development costs for content updates and server infrastructure, and player retention challenges as competing titles compete for limited daily gaming time
Genre saturation is a meaningful restraint on new title commercial success. The battle royale space is dominated by a small number of established titles with enormous player bases and content libraries. New entrants must differentiate on mechanics, technology, or IP to attract players who already have access to free, high-quality alternatives. Approximately 46% of new battle royale titles fail to sustain player bases beyond their initial launch windows, according to industry studies, reflecting the difficulty of the competitive landscape. High ongoing development costs impose margin pressure on all but the largest publishers. Major battle royale titles spend more than USD 100 million annually on content updates, live-service event management, server infrastructure, and esports operations. These costs require scale to justify. Smaller studios attempting to build and maintain a battle royale title at competitive quality standards face economics that favour the largest incumbents.
Opportunities: AI-driven content generation reducing update production costs, VR battle royale emerging as a new format frontier, and emerging markets’ first-time mobile gamer acquisition representing the largest new player growth pool
AI-driven content generation is emerging as the most commercially impactful technology opportunity in battle royale game development. Tools including Epic Games’ Persona Device and generative environment design platforms are enabling developers to create new content at a fraction of the time and cost that traditional manual development requires. This could reduce the update production cost burden that currently creates margin pressure for live-service battle royale titles. Virtual reality battle royale represents an emerging format that could expand the genre’s commercial addressable market as VR headset adoption grows. The immersive physical engagement of VR competition creates a qualitatively different experience from screen-based play. Early VR battle royale titles have demonstrated player interest. As headset prices decline and the install base grows, VR battle royale could develop into a commercially significant sub-segment with distinct monetization and development economics.
Recent Developments:
-
2025: Epic Games launched Fortnite Chapter 6 Season 4: Shock ’N Awesome on August 7, 2025, featuring Power Rangers and Halo crossovers, bug-themed points of interest, new weapons, and the Dino Megazord, maintaining the high-frequency content update cadence that sustains Fortnite’s player engagement and in-game purchase conversion.
-
2025: Epic Games introduced Blitz Royale in June 2025, a five-minute, 32-player battle royale mode with cross-platform support designed for mobile devices, directly addressing the demand for shorter-format competitive gameplay sessions that fit into mobile users’ available daily gaming windows.
-
2025: Epic Games unveiled the Persona Device at State of Unreal 2025, an AI tool within Unreal Editor for Fortnite enabling creators to build AI-driven characters with autonomous behavior and contextual dialogue, signaling the integration of generative AI into battle royale game design at the platform level.
Battle Royale Games Market Key Players are:
• Epic Games Inc.
• Krafton Inc.
• Garena
• Activision Blizzard Inc.
• Electronic Arts Inc.
• Tencent Games
• Respawn Entertainment
• NetEase Games
• Nintendo Co., Ltd.
• PUBG Corporation
• 2K Games
• Bluehole Inc.
• Supercell
• IndiGG
• Nodwin Gaming
• Riot Games Inc.
• miHoYo
• Ubisoft SE
• Bethesda Softworks
• Niantic Inc
Battle Royale Games Market Report Scope:
| Report Attributes | Details |
|---|---|
| Market Size in 2025 | USD 11.20 Billion |
| Market Size by 2035 | USD 29.94 Billion |
| CAGR | CAGR of 10.54% From 2026 to 2035 |
| Base Year | 2025 |
| Forecast Period | 2026-2035 |
| Historical Data | 2022-2024 |
| Report Scope & Coverage | Market Size, Segments Analysis, Competitive Landscape, Regional Analysis, DROC & SWOT Analysis, Forecast Outlook |
| Key Segments | •By Game Type (Free-to-Play, Pay-to-Play) •By Platform (Mobile, PC, Console) •By End User (Teenagers, Adults) |
| Regional Analysis/Coverage | North America (US, Canada), Europe (Germany, UK, France, Italy, Spain, Russia, Poland, Rest of Europe), Asia Pacific (China, India, Japan, South Korea, Australia, ASEAN Countries, Rest of Asia Pacific), Middle East & Africa (UAE, Saudi Arabia, Qatar, South Africa, Rest of Middle East & Africa), Latin America (Brazil, Argentina, Mexico, Colombia, Rest of Latin America). |
| Company Profiles | Epic Games Inc., Krafton Inc., Garena, Activision Blizzard Inc., Electronic Arts Inc., Tencent Games, Respawn Entertainment, NetEase Games, Nintendo Co., Ltd., PUBG Corporation, 2K Games, Bluehole Inc., Supercell, IndiGG, Nodwin Gaming, Riot Games Inc., miHoYo, Ubisoft SE, Bethesda Softworks, Niantic Inc. |
Frequently Asked Questions
North America dominated the battle royale games market in 2025, with the United States accounting for approximately 83.4% of North America revenues.
Free-to-Play dominated with approximately 78% of revenues in 2025.
Rising global smartphone penetration expanding mobile battle royale access in Asia Pacific, South Asia, and Latin America.
The battle royale games market is expected to grow at a CAGR of 10.54% from 2026 to 2035.
Get in Touch
