Photo Sharing Market Report Scope & Overview:
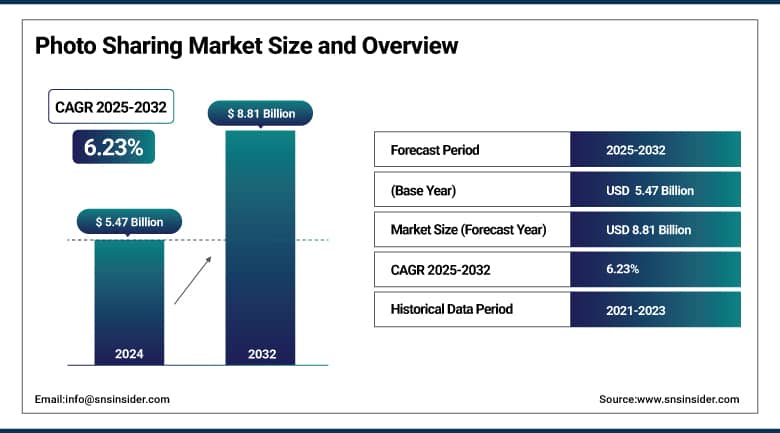
The Photo Sharing Market was valued at USD 5.47 billion in 2024 and is expected to reach USD 8.81 billion by 2032, growing at a CAGR of 6.23% from 2025-2032.
The Photo Sharing Market growth is driven by the rising penetration of smartphones and high-speed internet, enabling seamless media uploads and sharing. Nearly 80% of smartphone users consume digital entertainment weekly including videos, games, and music while over 90% access services like social networking, fintech, e-health, or education via mobile devices, making smartphones a core platform for visual engagement.
The increasing popularity of visual-based social media platforms, particularly Instagram which hosts 95 million photo and video uploads daily, or roughly 1,100 per second demonstrates the massive scale of content creation. Additionally, 2 million businesses actively use Instagram for marketing, reflecting a growing reliance on visual communication.
The integration of AI-based photo editing tools and rising demand for scalable cloud storage further fuel this expansion. Moreover, the growing trend of digital marketing and user-generated content, driven by both individuals and enterprises, continues to significantly contribute to the adoption of photo sharing applications.
To Get More Information On Photo Sharing Market - Request Free Sample Report
U.S. Photo Sharing Market Size Outlook:
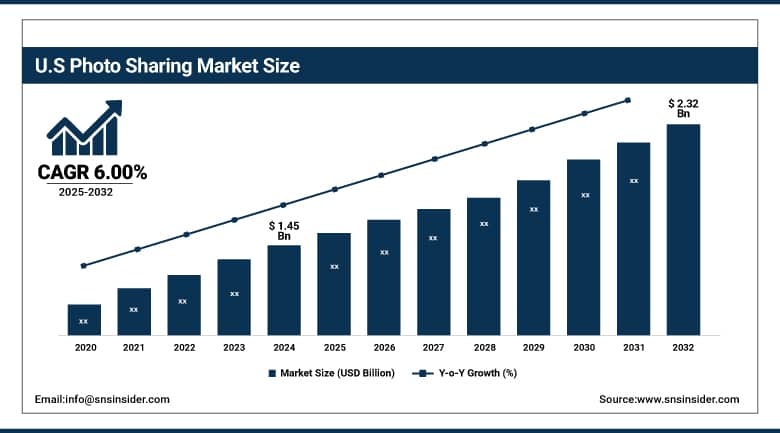
The U.S. Photo Sharing Market was valued at USD 1.45 billion in 2024 and is expected to reach USD 2.32 billion by 2032, growing at a CAGR of 6.00% from 2025-2032. The U.S. Photo Sharing Market is growing due to widespread smartphone usage, strong social media engagement, and demand for real-time visual communication. Additionally, increased use of photo sharing in digital marketing and content creation supports sustained market expansion across individual and enterprise users.
Market Dynamics
Drivers
-
Surge in social media influence and creator economy boosts demand for visual storytelling platforms
The rise of influencer marketing and the creator economy has boosted demand for platforms that enable high-quality visual content sharing. Photo sharing apps have been a staple for creators to gain an audience and land brand deals or make money off other content. This has encouraged investing to develop editing tools, filters, and analytics, that attract both users as well as brands. Their attention continues to rise driven by personalization and niche communities. With the power to affect what the consumers desire, influencers are turning photo sharing apps into centers for branding, outreach, as well as content-based marketing.
According to Vogue Business, the creator economy now includes over 50 million content creators globally, and 70% of them report brand deals as their main source of income. In the U.S., digital creator jobs have grown significantly from 200,000 in 2020 to 1.5 million in 2024 highlighting the mainstream shift toward content-driven careers.
Restraints
-
Growing concerns over data privacy and content misuse reduce user trust and platform growth potential
Data breach, unsanctioned use of content, and surveillance continue to turn users away from photo sharing social networking services. Due to hub profiles incidents and rising awareness about digital rights, users are now becoming wary of storing their images and the possibility of monetization. Tighter regulations such as GDPR and CCPA put compliance pressure on the platforms. Opaque algorithms and third-party access to data also reduce trust. The lack of privacy protections would put a serious dent on user acquisition and retention, as data security would become critical to maintaining platform credibility and user engagement over time
Recent data highlights the severity of these concerns. According to Pew Research, 81% of social media users express concern about their privacy, and 90% are worried about platforms monetizing their data.
In the U.S., 89–92% of internet users feel they’ve lost control over their personal data. The Identity Theft Resource Center reported 2,116 data breaches impacting over 66 million individuals in the U.S. during the first nine months of 2024.
Opportunities
-
Integration of AI and AR tools creates advanced user experiences and engagement touchpoints in photo sharing apps
Photo sharing applications are experiencing drastic changes in how users interact with the applications courtesy of AI and AR technologies. Facial recognition, auto-tagging, and smart editing features improve content quality and the experience of the users. AR filters and lenses are fun, immersive, and a great way to increase engagement in all age groups. These advances also help in personalization and content discovery. AI/AR opens up interactive marketing opportunities for brands This drives platforms away from simple sharing tools and towards a sophisticated tug-of-war between machine learning algorithms competing for user attention, session length and deeper integration into the digital engagement firmament.
Recent developments highlight this momentum. Instagram Edits, Meta’s AI-powered video/photo editing app, launched on April 21, 2025, and reached over 5 million downloads within just four days, crossing 7.1 million in its first week across platforms.
Additionally, Reels AR ads on Instagram and Facebook have delivered 87% higher ad recall among 18–24-year-olds compared to non-AR ads, showcasing the advertising impact of immersive formats.
On the developer side, Snapchat’s AR Lens Studio now supports a community of over 350,000 creators who have produced lenses viewed more than 3 trillion times, underlining the scale and creativity fueled by AR integration.
Challenges
-
Content moderation and fake visual content pose risks to platform integrity and user safety
As user-generated photo content soared, identification and moderation of harmful, false, or disgusting images proved to be insurmountable. Manipulated images, deep fakes, and offensive material that can quickly spread misinformation or hurt people are hard for platforms to detect. Automated tools are extremely helpful, but when heavily relied upon lead to mistakes, and a manual inspection takes time. Over moderation can lead to legal problems and loss of user trust. With the need for safety, especially among young users, a lot of tech, community rules and even in-the-moment checking has to be in place meaning content moderation is an ongoing, huge platform issue.
According to an arXiv analysis of the EU’s DSA Transparency Database, platforms submitted 156 million moderation decisions over just two months, with most rule-breaking content detected automatically; however, images receive significantly less moderation than text or video.
Additionally, the Identity Theft Resource Center reports that 60% of consumers globally have encountered a deepfake video in the past year, while humans were only able to identify high-quality deepfake videos correctly 24.5% of the time, highlighting the limitations of both users and moderation systems in combating visual misinformation.
Segment Analysis
By Platform
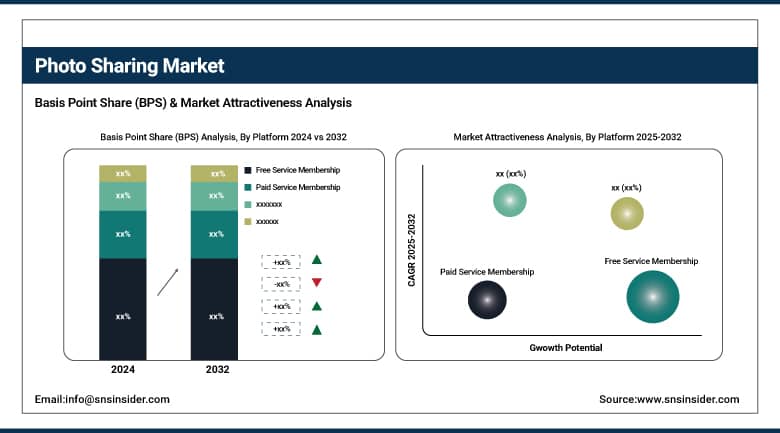
Free Service Membership segment dominated the Photo Sharing Market with the highest revenue share of about 80% in 2024 due to its wide accessibility, zero cost barrier, and ease of entry for casual users. The freemium model appeals to a broad user base, especially among younger demographics and non-professional users who prioritize basic sharing and editing features without incurring costs, thereby generating high traffic volumes and advertising-based monetization opportunities for platform providers.
Paid Service Membership segment is expected to grow at the fastest CAGR of about 8.45% from 2025–2032 attributing to increasing requirements for premium services like high-resolution storage, advanced editing tools, ad-free experience, and the ability to control privacy. As platforms continue to build out value-added services and tiered membership options, professional users, influencers, and content creators are opting to pay up for increased customization, security, and creative freedom, resulting in a growing subscription-based revenue stream.
By Application
Individual segment dominated the Photo Sharing Market with the highest revenue share of about 86% in 2024 as image sharing is a personal and social practice, where users record their daily lives, travel, events, and experiences. Millennials and Gen Z remain the dominant producers of content by volume and engagement on general and niche platforms alike, their social-networking habits, self-expression, and visual storytelling further stoking mass participation by individual users.
Enterprises segment is expected to grow at the fastest CAGR of about 7.80% from 2025–2032 due to its rapidly spent days in the business arena, photo sharing sites are currently utilized for customer engagement, influencer partnership campaigns particularly in sectors like selling, travel, and media. Historically, it gains powerful enterprise utility by integrating with analytics, content management, and eCommerce tools–all of which2021 entered by way of corporate deal flow and drove corporate sub increases.
By End User
Mobile Devices segment dominated the Photo Sharing Market with the highest revenue share of about 6.68% in 2024 and is expected to grow at the fastest CAGR of about 11.71% from 2025–2032 owing to widespread adoption of smartphones with high-quality camera, easy to use Photo apps, and immediate connectivity capabilities. For mobile users this has led to a change in behavior in how we capture, edit, and share content instantly on our devices. The increase in mobile-first social platforms to integrated cloud and AI-enabled editing tools boosts consumption with mobile devices being the key touch point in visual content creation and distribution.
Regional Analysis
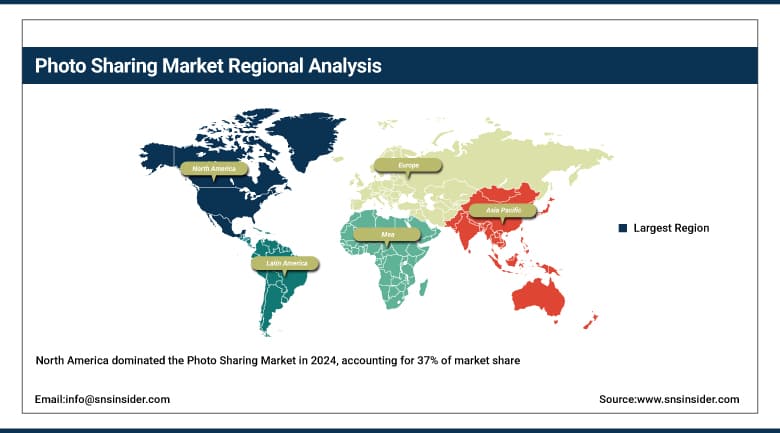
North America dominated the Photo Sharing Market with the highest revenue share of about 37% in 2024 mainly, because of the mature digital ecosystem, highly penetration of smartphone & the internet, and the major photo sharing platforms in the region. Combined with the strong creator economy, social media usage, infrastructure enabling quick transition to premium services, and persistent consumer-facing, monetization and enterprise innovation enabling new user activity in the region.
A Research survey shows that 86% of U.S. adults regularly consume news via digital devices, including smartphones, highlighting the dominance of mobile visual content in daily life. Additionally, 50% of U.S. adults use Instagram, a leading photo-sharing platform, underscoring the region's deep integration of visual social platforms into everyday communication and media habits.
The U.S. dominated the Photo Sharing Market due to high smartphone usage, advanced digital infrastructure, and strong presence of leading social media platforms.
Get Customized Report as Per Your Business Requirement - Enquiry Now
Asia Pacific is expected to grow at the fastest CAGR of about 7.83% from 2025–2032 due to rapid digitalization, increasing smartphone adoption, and expanding internet access across emerging economies. The large number of youth in the region, the increasing influence of social media, and the increasing popularity of mobile-first content creation platforms will be the main drivers of growth. Moreover, the demand for photo sharing services here is boosted by government initiatives for digital infrastructure and a vibrant influencer and e-commerce ecosystem.
China is dominating the Photo Sharing Market in Asia Pacific due to its massive user base, strong local platforms, and high mobile internet usage rates.
Europe holds a significant position in the Photo Sharing Market due to widespread smartphone adoption, high-speed internet access, and strong digital media consumption. The region also benefits from a growing influencer economy and increasing demand for privacy-focused and content-rich platforms.
Smartphone penetration in Europe reached 79% in 2023, with France at 81.8% and Spain accounting for 34 million users, highlighting the region’s high mobile accessibility that fuels visual content engagement and platform usage.
Germany is dominating the Photo Sharing Market in Europe due to its large digital user base, strong smartphone penetration, and high social media engagement rates.
Middle East & Africa and Latin America are emerging in the Photo Sharing Market due to rising smartphone penetration, expanding internet connectivity, and youthful demographics. Social media adoption and visual content trends are accelerating platform usage across urban and semi-urban populations.
Key Players
Amazon, Apple, Google LLC, Meta, Adobe Inc., Pinterest Inc., Dropbox Inc., Shutterfly LLC, Shutterstock Inc., Snapfish LLC, Flickr Inc., SmugMug Inc., Behance Inc., Imgur LLC, DeviantArt Inc.
Recent Developments:
-
In 2025, Dropbox Inc. launched AI-powered Dropbox Dash, allowing users to search across images and videos, and introduced QR-based photo link sharing for faster, streamlined content access and collaboration.
-
In 2025 – Amazon Photos added a shopping feature: users can tap the Lens icon on any photo to identify items and purchase similar products on Amazon a shift toward turning your library into a marketplace
-
In 2025, Apple previewed its new Liquid Glass UI design, introducing a translucent, fluid aesthetic to app icons, widgets, and navigation, including an updated, visually immersive Photos experience.
| Report Attributes | Details |
|---|---|
| Market Size in 2024 | USD 5.47 Billion |
| Market Size by 2032 | USD 8.81 Billion |
| CAGR | CAGR of 6.23% From 2025 to 2032 |
| Base Year | 2024 |
| Forecast Period | 2025-2032 |
| Historical Data | 2021-2023 |
| Report Scope & Coverage | Market Size, Segments Analysis, Competitive Landscape, Regional Analysis, DROC & SWOT Analysis, Forecast Outlook |
| Key Segments | • By Platform (Free Service Membership, Paid Service Membership) • By Application (Mobile Devices, Personal Computer) • By End User (Individual, Enterprises) |
| Regional Analysis/Coverage | North America (US, Canada, Mexico), Europe (Germany, France, UK, Italy, Spain, Poland, Turkey, Rest of Europe), Asia Pacific (China, India, Japan, South Korea, Singapore, Australia, Rest of Asia Pacific), Middle East & Africa (UAE, Saudi Arabia, Qatar, South Africa, Rest of Middle East & Africa), Latin America (Brazil, Argentina, Rest of Latin America) |
| Company Profiles | Amazon, Apple, Google LLC, Meta, Adobe Inc., Pinterest Inc., Dropbox Inc., Shutterfly LLC, Shutterstock Inc., Snapfish LLC, Flickr Inc., SmugMug Inc., Behance Inc., Imgur LLC, DeviantArt Inc. |
Frequently Asked Questions
Ans: North America led the market with a 37% share in 2024 due to digital maturity, social media adoption, and strong platform presence.
Ans: The Free Service Membership segment dominated in 2024 with 80% share due to accessibility, zero cost, and appeal to casual users.
Ans: The rising influence of social media, smartphone use, and AI-enhanced visual storytelling tools are key growth drivers in the global photo sharing market.
Ans: In 2024, the Photo Sharing Market was valued at USD 5.47 billion globally, with strong contributions from North America and Asia Pacific.
Ans: The Photo Sharing Market is projected to grow at a CAGR of 6.23% from 2025 to 2032, driven by mobile use and content demand.
Get in Touch
