Bioremediation Market Report Scope & Overview:
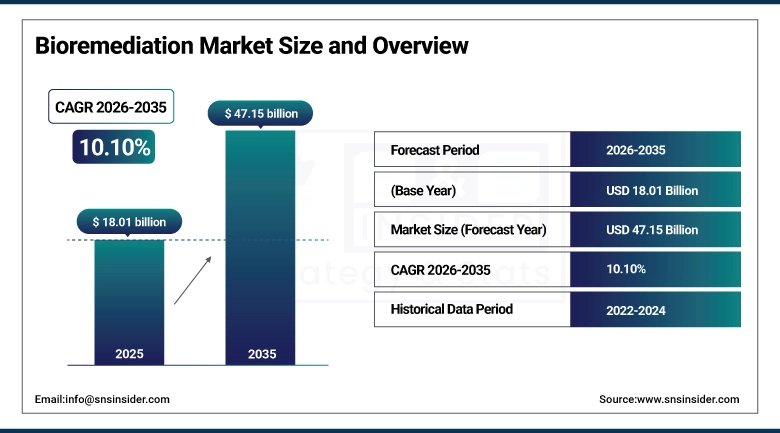
The Bioremediation Market Size was valued at USD 18.01 Billion in 2025 and is expected to reach USD 47.15 Billion by 2035, growing at a CAGR of 10.10% during 2026-2035.
The Global Bioremediation Market is witnessing significant growth driven by increasing environmental concerns, industrialization, and stricter regulatory standards. Bioremediation technologies offer sustainable and eco-friendly solutions for the treatment of contaminated soil, water, and wastewater, effectively reducing pollutants and restoring ecosystems. Rising awareness about environmental preservation, coupled with technological advancements in microbial, enzymatic, and phytoremediation approaches, is accelerating adoption across industries. Companies are increasingly investing in innovative and efficient bioremediation solutions to meet growing demand for cost-effective, safe, and environmentally responsible waste management practices.
Bioremediation Market Size and Forecast:
-
Market Size in 2025: USD 18.01 Billion
-
Market Size by 2035: USD 47.15 Billion
-
CAGR: 10.10% during 2026–2035
-
Base Year: 2025
-
Forecast Period: 2026–2035
-
Historical Data: 2022–2024
To Get more information on Bioremediation Market - Request Free Sample Report
Bioremediation Market Key Trends:
-
Rising environmental awareness is driving adoption of eco-friendly bioremediation solutions.
-
Advances in microbial, enzymatic, and phytoremediation technologies are improving efficiency and effectiveness.
-
Increasing industrial waste and contamination is boosting demand for remediation solutions.
-
Digital monitoring and data analytics optimize bioremediation processes and ensure compliance.
-
Stricter regulations and sustainability initiatives encourage industries to implement bioremediation practices.
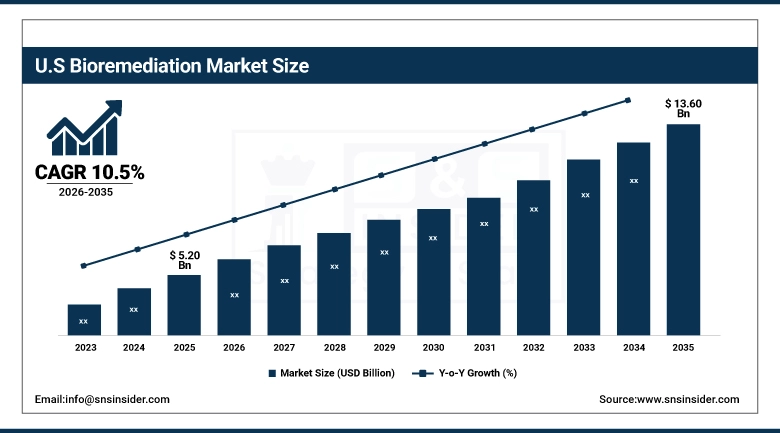
The U.S. Bioremediation Market Size was valued at approximately USD 5.20 Billion in 2025 and is expected to reach USD 13.60 Billion by 2035, growing at a CAGR of 10.5% during 2026–2035.
The U.S. bioremediation market is growing due to rising environmental awareness, stricter government regulations, increasing industrial and chemical waste, technological advancements in microbial and phytoremediation solutions, and strong demand for sustainable, cost-effective, and eco-friendly soil and water remediation practices.
Bioremediation Market Drivers:
-
Rising Environmental Awareness Driving Bioremediation Adoption
Increasing global awareness about environmental pollution, soil degradation, and water contamination is significantly driving the adoption of bioremediation technologies. Governments, industries, and communities are prioritizing eco-friendly and sustainable waste management solutions to reduce chemical residues and restore ecosystems. Bioremediation offers a natural and cost-effective method to treat contaminated soil and water, minimizing harmful environmental impact. Growing campaigns, educational initiatives, and corporate sustainability programs further reinforce the shift toward green remediation practices.
Bioremediation Market Restraints:
-
Limited Technical Expertise and Skilled Workforce in Emerging Markets
The adoption of bioremediation technologies in emerging markets is constrained by a shortage of trained professionals and technical expertise. Advanced microbial, enzymatic, and phytoremediation techniques require specialized knowledge for effective implementation, monitoring, and optimization. Many small- and medium-sized enterprises lack access to skilled personnel and training resources, leading to slower adoption rates. This gap restricts the scalability of bioremediation solutions and hinders the efficient treatment of contaminated soil and water in developing regions.
Bioremediation Market Opportunities:
-
Expansion of Bioremediation Applications Across Key Industries
Bioremediation is increasingly being adopted across agriculture, mining, and wastewater treatment due to its cost-effectiveness and eco-friendly approach. In agriculture, it helps manage pesticide and fertilizer contamination, restoring soil health. In mining, bioremediation addresses heavy metal contamination and acidic runoff, ensuring environmental compliance. Wastewater treatment facilities leverage microbial and enzymatic technologies to remove organic pollutants efficiently. Growing awareness of sustainable practices, coupled with regulatory support, is driving the broader application of bioremediation across these critical industrial sectors.
Bioremediation Market Segments:
-
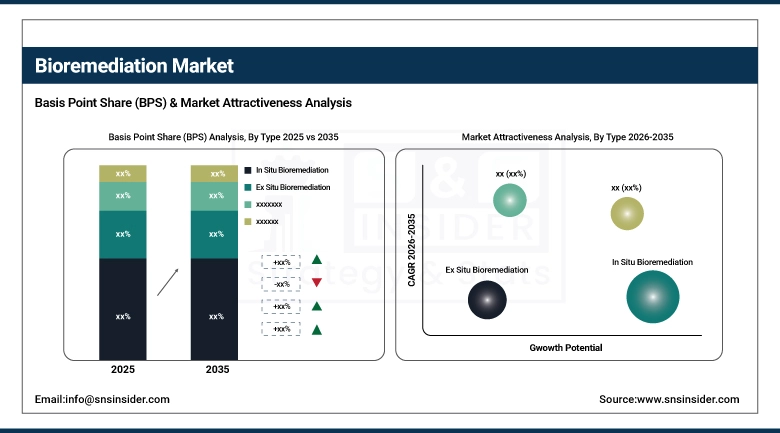
By Type: In 2025, In Situ Bioremediation dominated with 55% share; Ex Situ Bioremediation fastest growing segment during 2026–2035
-
By Pollutant Type: In 2025, Hydrocarbons dominated with 50% share; Heavy Metals fastest growing segment during 2026–2035
-
By Technology: In 2025, Microbial Remediation dominated with 50% share; Phytoremediation fastest growing segment during 2026–2035
-
By End-Use Industry: In 2025, Oil & Gas dominated with 45% share; Agriculture fastest growing segment during 2026–2035
Bioremediation Market Segment Analysis:
By Type: In Situ Bioremediation Dominates, Ex Situ Bioremediation Fastest-Growing
In Situ Bioremediation dominates the type segment due to its cost-effectiveness, minimal environmental disruption, and applicability for large-scale contaminated sites. Techniques such as bioventing, biosparging, and bioaugmentation allow treatment directly at the contamination site, reducing excavation and transportation costs, which makes it the preferred choice for oil & gas, chemical, and industrial applications.
Ex Situ Bioremediation is the fastest-growing type segment, driven by its higher efficiency in controlled environments and ability to treat complex contaminants. Biopiles, windrows, and landfarming solutions are increasingly adopted in industries with stringent environmental regulations. Growth is further supported by technological advancements, improved microbial formulations, and increasing focus on remediation of hazardous industrial and mining waste.
By Pollutant Type: Hydrocarbons Dominates, Heavy Metals Fastest-Growing
Hydrocarbons dominate the pollutant type segment due to the prevalence of oil spills, petroleum leaks, and industrial hydrocarbon waste. Bioremediation solutions for crude oil, gasoline, diesel, and polycyclic aromatic hydrocarbons (PAHs) are well-established, with widespread adoption in oil & gas and chemical industries.
Heavy Metals are the fastest-growing pollutant type segment, driven by industrialization, mining activities, and stricter environmental regulations. Technologies such as phytoremediation and microbial remediation are increasingly applied to remove lead, mercury, cadmium, and other toxic metals from soil and water, supporting sustainable and compliant industrial practices.
By Technology: Microbial Remediation Dominates, Phytoremediation Fastest-Growing
Microbial Remediation dominates the technology segment due to its high efficiency in degrading organic pollutants such as hydrocarbons, industrial solvents, and agricultural chemicals. Advanced bacterial, fungal, and algae-based formulations allow targeted contaminant breakdown with minimal environmental disruption.
Phytoremediation is the fastest-growing technology segment, driven by the increasing adoption of sustainable, eco-friendly solutions. Use of hyperaccumulator plants, rhizofiltration, and phytoextraction techniques allows treatment of heavy metals, pesticides, and industrial effluents, particularly in agricultural and mining applications.
By End-Use Industry: Oil & Gas Dominates, Agriculture Fastest-Growing
Oil & Gas industry dominates the end-use segment due to frequent hydrocarbon spills, refinery waste, and pipeline contamination. The industry heavily invests in in situ bioremediation technologies to ensure regulatory compliance and minimize environmental impact.
Agriculture is the fastest-growing end-use industry, driven by pesticide and fertilizer contamination of soil and water. Bioremediation solutions, including microbial treatments and phytoremediation, are increasingly applied to maintain soil health, reduce chemical residues, and support sustainable farming practices.
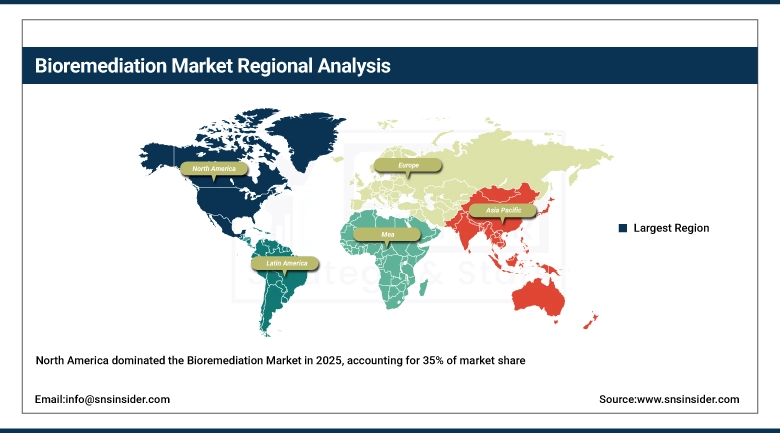
Bioremediation Market Regional Analysis:
North America Bioremediation Market Insights:
North America dominates the global bioremediation market with 35% of total market share in 2025. The region’s leadership is driven by stringent environmental regulations, extensive oil & gas and industrial operations, and high adoption of advanced remediation technologies. Well-established environmental agencies, increasing government initiatives, and the presence of major players such as Thermo Fisher Scientific and Veolia further reinforce North America’s dominant position in the global bioremediation market.
Get Customized Report as per Your Business Requirement - Enquiry Now
Europe Bioremediation Market Insights:
Europe represents a significant region in the global bioremediation market, supported by strict environmental policies, high industrialization, and growing focus on sustainable waste management. The region’s market growth is driven by increasing demand for heavy metal and hydrocarbon remediation solutions, widespread adoption of microbial and phytoremediation technologies, and expanding investments in contaminated site clean-ups across countries such as Germany, the United Kingdom, and France. The presence of established environmental service providers continues to strengthen Europe’s market position.
Asia-Pacific Bioremediation Market Insights:
Asia-Pacific is observed to be the fastest-growing segment in the Bioremediation Market during 2026-2035. The region’s rapid growth is driven by industrial expansion, urbanization, and rising environmental concerns in countries such as China, India, and Japan. Increasing incidents of soil and water contamination, government initiatives promoting sustainable waste management, and growing awareness of eco-friendly remediation techniques are further accelerating bioremediation adoption across the Asia-Pacific market.
Latin America Bioremediation Market Insights:
Latin America plays an emerging role in the global bioremediation market, supported by its expanding industrial and agricultural sectors. Growth is driven by increasing environmental awareness, government-led clean-up programs, and rising investments in soil and water remediation projects. Countries such as Brazil and Mexico are gradually adopting advanced bioremediation techniques, enhancing the region’s presence in the global market.
Middle East & Africa (MEA) Bioremediation Market Insights:
The Middle East and Africa bioremediation market is gradually gaining traction, driven by industrial growth, urbanization, and rising concerns over oil spills and contaminated water sources. Expanding government regulations, initiatives for sustainable waste management, and the entry of international environmental service providers are supporting market development. The adoption of microbial and phytoremediation techniques is increasing steadily across key industrial and urban areas in the region.
Bioremediation Market Competitive Landscape:
Thermo Fisher Scientific Inc., headquartered in Waltham, Massachusetts, USA, is a leading global provider of analytical instruments, laboratory equipment, and environmental solutions, including bioremediation technologies. The company specializes in microbial analysis, soil and water testing, and advanced bioremediation solutions for industrial and environmental applications. Thermo Fisher emphasizes research-driven innovation, regulatory compliance, and high-quality analytical solutions to support sustainable environmental management.
-
In March 2025: Thermo Fisher launched an enhanced microbial bioremediation toolkit for hydrocarbon-contaminated soils, providing faster degradation rates and improved environmental safety for oil & gas and industrial clients.
Veolia Environnement S.A., headquartered in Paris, France, is a global leader in environmental services, including water management, waste treatment, and bioremediation solutions. The company offers integrated soil and water remediation services using microbial, chemical, and phytoremediation technologies. Veolia focuses on sustainable solutions, regulatory compliance, and large-scale environmental projects across industries such as oil & gas, mining, and chemicals.
-
In March 2025: Veolia expanded its bioremediation operations in North America by deploying advanced in situ and ex situ technologies for heavy metal and hydrocarbon cleanup, targeting industrial and municipal contaminated sites.
Bioremediation Market Key Players:
-
Thermo Fisher Scientific Inc.
-
Veolia Environnement S.A.
-
SUEZ
-
BASF SE
-
Ecolab Inc.
-
Clean Harbors, Inc.
-
PeroxyChem LLC (An Occidental Chemical Company)
-
Bio-Recovery Systems, Inc.
-
Newterra Ltd.
-
Geosyntec Consultants, Inc.
-
Advanced Environmental Recycling Technologies (AERT)
-
CleanEarth, Inc.
-
KMG Chemicals, Inc.
-
Bion Environmental Technologies
-
EarthAlive Clean Technologies
-
EcoLogic Solutions
-
Terra Systems, Inc.
-
Enviromatrix International
-
BioPetroClean, Inc.
-
PeroxyChem LLC
| Report Attributes | Details |
|---|---|
| Market Size in 2025 | USD 18.01 Billion |
| Market Size by 2035 | USD 47.15 Billion |
| CAGR | CAGR of 10.10% From 2026 to 2035 |
| Base Year | 2025 |
| Forecast Period | 2026-2035 |
| Historical Data | 2022-2024 |
| Report Scope & Coverage | Market Size, Segments Analysis, Competitive Landscape, Regional Analysis, DROC & SWOT Analysis, Forecast Outlook |
| Key Segments | • By Type: (In Situ Bioremediation, Ex Situ Bioremediation, Landfarming) • By Pollutant Type: (Hydrocarbons, Heavy Metals, Pesticides) • By Technology: (Microbial Remediation, Phytoremediation, Enzymatic Treatment) • By End-Use Industry: (Oil & Gas, Agriculture, Wastewater Treatment) |
| Regional Analysis/Coverage | North America (US, Canada), Europe (Germany, UK, France, Italy, Spain, Russia, Poland, Rest of Europe), Asia Pacific (China, India, Japan, South Korea, Australia, ASEAN Countries, Rest of Asia Pacific), Middle East & Africa (UAE, Saudi Arabia, Qatar, South Africa, Rest of Middle East & Africa), Latin America (Brazil, Argentina, Mexico, Colombia, Rest of Latin America). |
| Company Profiles | Thermo Fisher Scientific Inc., Veolia Environnement S.A., SUEZ, BASF SE, Ecolab Inc., Clean Harbors, Inc., PeroxyChem LLC (An Occidental Chemical Company), Bio-Recovery Systems, Inc., Newterra Ltd., Geosyntec Consultants, Inc., Advanced Environmental Recycling Technologies (AERT), CleanEarth, Inc., KMG Chemicals, Inc., Bion Environmental Technologies, EarthAlive Clean Technologies, EcoLogic Solutions, Terra Systems, Inc., Enviromatrix International, BioPetroClean, Inc. |
Get in Touch
