Cloud Gaming Market Report Scope & Overview:
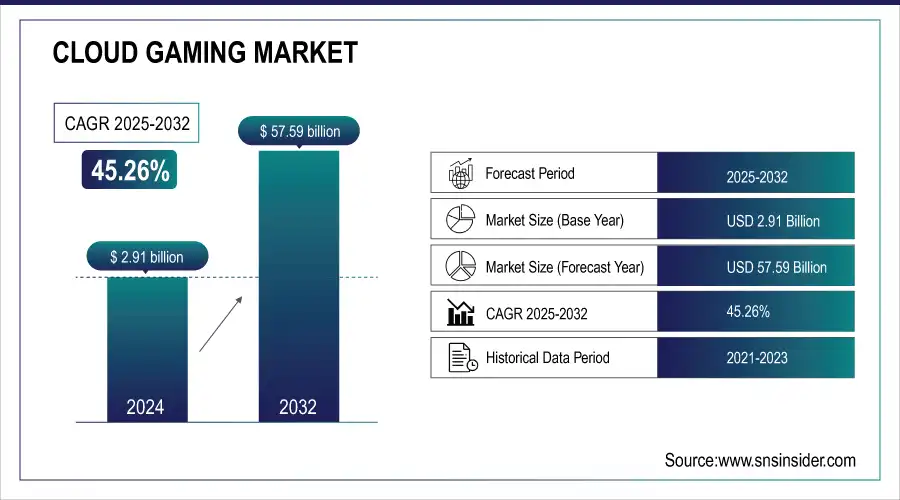
The Cloud Gaming Market was valued at USD 4.23 billion in 2025 and is expected to reach USD 176.81 billion by 2035, growing at a CAGR of 45.26% from 2026-2035.
Get more information on Cloud Gaming Market - Request Sample Report
The cloud gaming industry is growing at a fast pace, thanks to high-speed internet connectivity and 5G deployment as well as changing consumer preferences. Because of the lack of hardware requirements on the client side, it allows for play on small portable devices like phones and tablets, as well as low-end computers that could never handle a traditional game. Consumption has been buoyed by subscription models and the ease of cross device use which mirrors what has happened also in music and video streaming. Cloud gaming is becoming part of the ecosystem of major tech players, leading to more convenient access and outreach. Although there are still issues to be resolved in terms of latency, data privacy and internet connectivity rate in the cloud game market, continuous technology development combined with increasing demand for flexible gaming models will dramatically drive innovation within the games industry.
Market Size and Forecast
-
Cloud Gaming Market Size in 2025: USD 4.23 Billion
-
Cloud Gaming Market Size by 2035: USD 57.59 Billion
-
CAGR: 45.26% from 2026 to 2035
-
Base Year: 2025
-
Forecast Period: 2026–2035
-
Historical Data: 2022–2024
Cloud Gaming Market Trends
-
Rising demand for on-demand, device-agnostic gaming experiences is fueling cloud gaming adoption.
-
Expanding internet penetration and rollout of high-speed 5G networks are enhancing accessibility and performance.
-
Growing shift toward subscription-based gaming models is boosting market growth.
-
Integration with AI, AR, and VR technologies is creating immersive gaming experiences.
-
Reduction in hardware dependency is attracting casual and cost-sensitive gamers.
-
Increasing investments from tech giants, gaming studios, and telecom providers are accelerating innovation.
-
Cross-platform compatibility and social gaming trends are widening user engagement and market scope.
Cloud Gaming Market Growth Drivers:
-
Affordable subscription plans offering access to extensive game libraries attract a diverse range of consumers.
Low-cost monthly subscription plans are among the biggest factors, widening access to a broad segment of consumers. Unlike the legacy set-ups, which demand heavy investment to purchase consoles or high-performance PCs, cloud gaming is an inexpensive alternative. Subscription pricing is more than fair, and the service offers an impressive volume of titles at prices significantly lower than the cost of Erforderlich hardware or individual games. It has made gaming accessible to everyone, allowing casual players, budget-sensitive consumers, and consumers in developing countries to game with no financial barriers. These kinds of subscription models often have tiers – one that allows users to choose based on their needs and budget. Often, basic tiers will give you access to a standard library of games, while premium levels will provide higher res, extra features like exclusive items, and multiplayer. This flexibility increases the appeal of cloud gaming services to both casual gamers and hardcore fans alike.
Furthermore, the trend you see in other entertainment spaces where consumers are starting to prefer access over ownership — music, video, etc. — is also apparent when it comes to sports subscriptions. This model keeps users coming back for more and coming back to the same or related products to keep filling in their game libraries and backgrounds with the latest content, updates, or features. While cloud gaming providers are still improving their services and expanding their game libraries, it seems that low-cost monthly subscriptions will endure as a significant market growth engine. These plans are helping to reach out to a large number of preposterous groups and regions by reducing barriers to entry and offering maximum value.
-
The deployment of 5G networks enables low-latency, high-speed streaming, enhancing the performance and accessibility of cloud gaming services.
-
Cloud gaming's ability to run on various devices, including smartphones, tablets, and low-end PCs, broadens its user base.
Cloud Gaming Market Restraints:
-
Compared to traditional platforms, some cloud gaming services offer fewer game options, reducing their appeal to hardcore gamers.
One of fundamentally problems for this kind of cloud gaming service are that it’s game library is not as extensive as those usual gaming platforms and lacking the hard-core-players depended high end games. Classics like consoles and gaming PCs have enormous libraries filled with all kinds of genres, exclusive titles, and support for older games through backward compatibility. You can run a site like Newgrounds, but it's going to be pretty hard for you being that game publishers aren't likely to entrust some random website with their product. In contrast, cloud gaming solutions can lose out owing to licensing complications, technical challenges and cost restrictions. Game developers hoping to have their titles available on cloud platforms often must enter into complex arrangements, which are time-consuming and costly. Also, streaming games comes with technical requirements (like tweaking a game for cloud infrastructure) which can further limit the list of titles added, especially when select older or niche games are not made to be played on the cloud-friendly service.
Game library limitation can be a real turn-off for hardcore gamers after all they want to gain access to a wide choice of games/slots, including exclusive and high performance product. These consumers are also more likely to find deficiencies in cloud gaming libraries and when they do, continue their preference for traditional platforms or subscribe to multiple services. Cloud gamingIGP.27 - Cloud-based execution model To address this, cloud game companies are seeking to increasing their game portfolio via partnerships and unique content offers. Yet, for some time to come, so long as these efforts remain formative rather than fully realised, the lack of variety in the games department may continue to hamper broad uptake of cloud gaming for hardcore gamers at least.
-
Cloud gaming demands consistent high-speed internet, which is not universally available, especially in rural and developing areas.
-
The reliance on cloud infrastructure raises risks of data breaches and security vulnerabilities, deterring some users.
Cloud Gaming Market Segment Analysis
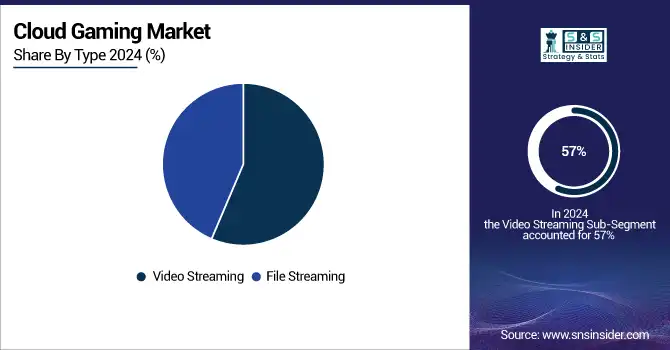
By Type, Video streaming dominates the cloud gaming market. File streaming is expected to grow fastest.
In 2025, the video streaming segment dominated the market and held the highest market share of around 57%. High-performance computing will likely continue to dominate the segment because it allows gamers to play any game without concern about hardware requirements. Since gaming graphics are processed in the cloud and not on local devices, gamers need a high-speed, stable internet connection to run the games. This, in turn, is anticipated to contribute to the segment's dominance in the forecast period.
The file streaming segment is expected to witness the fastest CAGR during the forecast period from 2025 to 2035. This particular segment growth is due to the economic benefits it offers game developers. Streaming files allow gamers to commence the game once a set percentage of the files are downloaded. Hence, increased adoption of file streaming by game developers and gamers is expected to positively contribute to the growth of the segment.
By Device, Gaming consoles dominate the cloud gaming market. Smartphones are expected to grow fastest.
In 2025, the gaming consoles segment dominated the market and held the largest share of the market with over 49%. The segment accounted for a large market share due to factors such as increased disposable income, and some game titles are available for only specific consoles. The racing title Forza Horizon is only on Microsoft Xbox consoles, drawing in potential new users to buy Xbox consoles just to play the game. So, along with the fact that modern consoles can output at 4K resolutions let alone 120-hertz, it is predicted that lifestyle gamers will turn to get the most out of the gaming experience.
The smartphone segment is expected to grow at the fastest growing CAGR during the forecast period from 2025 to 2035. The reason for this growth is the increasing number of freemium games that incorporate optional in-app purchases and subscriptions. Likewise, players engaged that belong to the cloud gaming market also focused on mobile gaming as a result of extensive demand penetration of smartphones in the world. Moreover, features such as enabled 5G and Wi-Fi 6 on contemporary handhelds are expected to meet the technical threshold for cloud gaming and positively aid the vertical.
Regional Analysis
Asia Pacific Cloud Gaming Market Insights
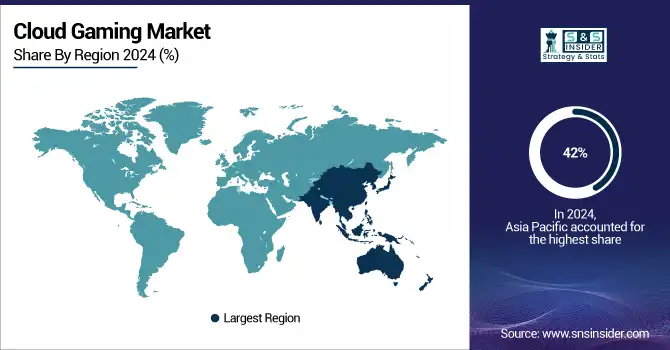
The Asia Pacific region accounted for more than 42% of the market share in the year 2023, owing to distinct demographics and a huge gaming population. China and India, two of the largest nations on Earth, not only have billion-strong populations, but they also have massive gamer communities. Complementing it is the high penetration of low-cost high-speed internet and also the high percentage of smartphone users that make it hard for this region to be overtaken.
Need any customization research/data on Cloud Gaming Market - Enquiry Now
North America Cloud Gaming Market Insights
The North American segment is expected to grow at the fastest CAGR over the forecast period. The growth is driven by the leaders of cloud gaming such as NVIDIA Corporation, Microsoft Corporation, and Intel Corporation. Strong tech innovations and widespread availability of 5G and high-speed internet in the region are also key factors driving the region's speedy market growth.
Europe Cloud Gaming Market Insights
Europe is emerging as a significant region in the cloud gaming market, driven by strong broadband infrastructure, widespread 5G deployment, and a growing gaming community. Increasing demand for cross-platform access and subscription-based gaming models is accelerating adoption. European telecom operators and tech companies are collaborating with cloud gaming providers, enhancing accessibility. Supportive digitalization initiatives further strengthen Europe’s role as a key growth hub for the global cloud gaming industry.
Middle East & Africa and Latin America Cloud Gaming Market Insights
ME&A as well as Latin America is perceived to have an increasing opportunity in the cloud gaming market owing to escalating internet infrastructure, burgeoning 5G penetration and the rise of smartphone users. Growing demand for low cost,bundled gaming models appeal to a younger audiences. These latest partnerships of telecom providers with cloud gaming players are improving the accessibility, and continued digitalization efforts driving these regions as untapped territories that hold significant growth opportunities in the worldwide gaming landscape.
Cloud Gaming Market Competitive Landscape:
NVIDIA Corporation
According to NVIDIA Corporation offers the GeForce NOW platform, which provides high performance cloud gaming across a multitude of devices. For gamers, nVIDIA is harnessing the power of its incredible GPU’s to allow gamers to play AAA games in their highest settings without the need for high-end hardware. Its ongoing developments in graphics, AI and cloud infrastructure bolster market acceptance. Strategic alliances and worldwide expansion continue to reinforce NVIDIA’s leadership in the expanding cloud gaming industry.
- 2025 – NVIDIA is introducing the Blackwell architecture to GeForce NOW, delivering RTX 5080-class cloud performance 5K at 120 fps streaming and expanding the game library with Install-to-Play support for over 4,500 titles.
- 2025 – NVIDIA Corporation announced expansion of GeForce NOW to Apple Vision Pro, Meta Quest 3, and other VR/MR devices, plus a new RTX-powered data center in India.
Sony Interactive Entertainment
Sony Interactive Entertainment is a prominent name in cloud gaming, with the PlayStation Now and PlayStation Plus Premium services. Sony, which has brought cloud streaming to its ecosystem of PlayStation consoles, allows wireless access to all those PS4 and PS5 games without any downloading. PlayStation Portal continues to improve and expand its streaming services, further solidifying Sony's strategy to deliver high-quality gaming experiences that can be enjoyed on a multitude of devices, while enhancing its competitiveness in cloud gaming.
-
2025 – Sony Interactive Entertainment Released a system software update for PlayStation Portal in April, enhancing the Cloud Game Streaming Beta with user-experience improvements for PlayStation Plus Premium members streaming via the remote device.
-
2025 – Sony Interactive Entertainment Began rolling out PS5 Cloud Streaming for PlayStation Plus Premium members, enabling access to supported PS5 games directly from their consoles without downloading.
-
2025 – Sony Interactive Entertainment Released a June system update for PlayStation Portal that adds support for 5GHz public Wi-Fi, improving remote connectivity for cloud game streaming.
-
2023 – Sony Interactive Entertainment Launched PS5 Cloud Streaming this October—Premium members could stream supported PS5 titles in select regions without local download, unlocking access to top games.
Microsoft Corporation
Microsoft is a major player in the cloud gaming world with its Xbox Cloud Gaming service, which comes with Xbox Game Pass Ultimate. Microsoft is expanding access and engagement on the front of smooth streaming of console-like games across smartphones, PCs and smart TVs. Strategic alliances, ongoing improvements to its infrastructure and being integrated into its massive Xbox ecosystem only cement Microsoft’s standing as a cloud gaming powerhouse.
-
2025 – Microsoft Corporation announced that Xbox Cloud Gaming (Beta) has broadened device support to include web browsers, TVs, Meta Quest, Fire TV, Samsung TVs, and more expanding streaming reach.
-
2023 – Microsoft Corporation Research teams developed a novel synchronization technology for cloud gaming that keeps audio and video streams precisely aligned even across multiple devices and network conditions.
Amazon Web Services
Amazon Web Services (AWS) is a hugely influential part of the cloud gaming space, supporting both Amazon Luna itself and Luna’s infrastructure. By taking advantage of AWS’s massive, global infrastructure and scale, Luna can offer a robust gaming experience without the need for larger downloads or updates. AWS also features cloud-native game development tools such as GameLift, to encourage innovation and more accessible development for developers. Its duality as platform provider and enabler strengthens its position within the global cloud gaming ecosystem.
-
2025 – AWS unveiled Amazon GameLift Streams, enabling browser-based cloud game streaming at 1080p/60fps across devices—providing developers a seamless way to stream without requiring downloads or installs.
-
2025 – Jackbox Games announced a spring beta launch for a smart TV cloud streaming service, using AWS GameLift Streams to deliver ad-supported free games and eventual subscription-based catalogs.
Key Players
The major key players along with their products are
-
NVIDIA Corporation - GeForce NOW
-
Microsoft Corporation - Xbox Cloud Gaming
-
Sony Interactive Entertainment - PlayStation Now
-
Google LLC - Google Stadia
-
Amazon Web Services - Amazon Luna
-
Tencent Holdings - START
-
Ubisoft Entertainment - Ubisoft+ Cloud Gaming
-
Electronic Arts - EA Play
-
Intel Corporation - Intel Server GPU for Cloud Gaming
-
Parsec Cloud - Parsec for Teams
-
Shadow (Blade Group) - Shadow PC
-
Blacknut - Blacknut Cloud Gaming
-
Vortex - Vortex Cloud Gaming
-
Rainway Inc. – Rainway
-
Ubitus Inc. – Ubitus Cloud Gaming
-
Paperspace (DigitalOcean) – Paperspace Gaming Cloud
-
LiquidSky Software Inc. – LiquidSky
-
Boosteroid – Boosteroid Cloud Gaming
-
Antstream Arcade – Antstream
-
Gamestream – Gamestream Cloud Gaming
-
NetEase – NetEase Cloud Gaming
| Report Attributes | Details |
|---|---|
|
Market Size in 2025 |
USD 4.23 Billion |
|
Market Size by 2035 |
USD 176.81 Billion |
|
CAGR |
CAGR of 45.26% From 2026 to 2035 |
|
Base Year |
2025 |
|
Forecast Period |
2026-2035 |
|
Historical Data |
2022-2024 |
|
Report Scope & Coverage |
Market Size, Segments Analysis, Competitive Landscape, Regional Analysis, DROC & SWOT Analysis, Forecast Outlook |
|
Key Segments |
• By Type (File Streaming, Video Streaming) |
|
Regional Analysis/Coverage |
North America (US, Canada, Mexico), Europe (Eastern Europe [Poland, Romania, Hungary, Turkey, Rest of Eastern Europe] Western Europe] Germany, France, UK, Italy, Spain, Netherlands, Switzerland, Austria, Rest of Western Europe]), Asia Pacific (China, India, Japan, South Korea, Vietnam, Singapore, Australia, Rest of Asia Pacific), Middle East & Africa (Middle East [UAE, Egypt, Saudi Arabia, Qatar, Rest of Middle East], Africa [Nigeria, South Africa, Rest of Africa], Latin America (Brazil, Argentina, Colombia, Rest of Latin America) |
|
Company Profiles |
NVIDIA Corporation, Microsoft Corporation, Sony Interactive Entertainment, Google LLC, Amazon Web Services, Tencent Holdings, Ubisoft Entertainment, Electronic Arts, Intel Corporation, Parsec Cloud, Shadow (Blade Group), Blacknut, Vortex, Rainway Inc., Ubitus Inc., Paperspace (DigitalOcean), LiquidSky Software Inc., Boosteroid, Antstream Arcade, Gamestream, NetEase |
Frequently Asked Questions
Ans: The Asia Pacific region dominated in 2025, accounting for over 42% market share, fueled by strong gaming culture, 5G rollout, and mobile penetration.
Ans: Video streaming dominated the Cloud Gaming Market by type, while gaming consoles led by device, highlighting strong consumer adoption and engagement across categories.
Ans: Expanding 5G networks, high-speed internet availability, and increasing adoption of subscription-based gaming services are the major factors driving market growth globally.
Ans: In 2024, the Cloud Gaming Market was valued at USD 4.23 billion, driven by rising demand for flexible, device-agnostic gaming solutions.
Ans: The Cloud Gaming Market is projected to grow at a CAGR of 45.26% from 2026 to 2035, reflecting robust adoption trends.
Get in Touch
