image

Colloidal Silver Market Report Scope & Overview:

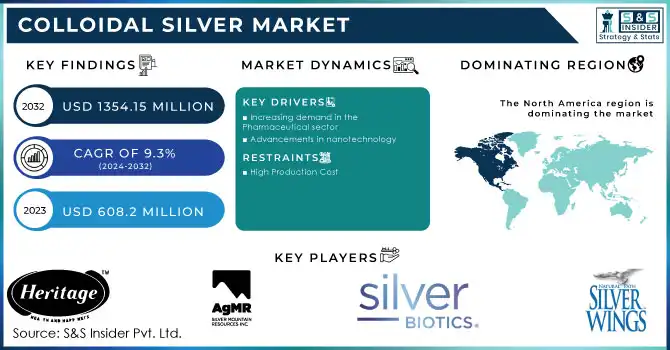
The Colloidal Silver Market size was USD 556.5 million in 2022 and is expected to Reach USD 1133.5 million by 2030 and grow at a CAGR of 9.3% over the forecast period of 2023-2030. 

Colloidal silver is a water-based solution of microscopic silver particles. The silver particles are so minute that they are invisible to the naked eye. Based on form, the powder segment of the colloidal silver market is expected to grow at a CAGR of 9.1% during the forecast period. Colloidal silver powder is a type of colloidal silver created by dissolving microscopic silver particles in water. The silver particles are so minute that they are invisible to the naked eye. Colloidal silver powder comes in several forms, including liquid, pills, and sprays.

Colloidal Silver Market Revenue Analysis

Consumers and businesses would benefit from a favorable regulatory climate for colloidal silver. Organizations would benefit from greater flexibility in how they market and sell their products. More research is being conducted by the FDA on the safety and efficacy of colloidal silver. This would contribute to a more solid scientific foundation for the use of colloidal silver.

MARKET DYNAMICS

KEY DRIVERS

  • Increasing demand in the Pharmaceutical sector

The increasing use of colloidal silver in medicines and medical devices is a prominent driver driving the worldwide colloidal silver market's expansion. Colloidal silver has antimicrobial and antibacterial capabilities that are effective against a variety of diseases. Several studies have shown that colloidal silver can help in wound healing. It is increasingly being utilized to prevent infections in wound dressings, lotions, medical device coatings, and surgical instruments. The increasing issue of antibiotic resistance has increased the demand for colloidal silver as a viable option.

  • Advancements in nanotechnology

RESTRAIN

  • High Production Cost

The cost of production is greatly raised by the complexity of nanoscale colloidal silver synthesis, the requirement for specialized equipment, and the requirement for technical know-how. When colloidal silver nanoparticles are produced using conventional procedures, significant amounts of them are lost. Wider adoption from businesses is hindered by the high expenses associated with producing pharma-grade, extremely pure colloidal silver that complies with regulatory standards. This problem will be solved with improvements in scalable, affordable production.

OPPORTUNITY

  • Rising applications in other end-user sectors

Since colloidal silver has anti-inflammatory and antibacterial characteristics, it is frequently used in healthcare and cosmetic goods including lotions, soaps, and shampoos. Acne, eczema, and psoriasis can all be treated, and it can also speed up the healing process and lessen scarring. Water filtration systems and the treatment of potable water may both benefit from the use of colloidal silver. It can purify water, get rid of germs and microbes, and extend its shelf life. Other applications for colloidal silver include dietary supplements and agriculture.

  • Favorable regulatory scenario from the FDA

CHALLENGES

  • Safety concerns about use of colloidal silver

Excessive colloidal silver consumption can induce argyria, a disorder that causes permanent bluish-grey staining of the skin. According to certain research, ingesting colloidal silver may impair liver function and produce neurotoxicity. These possible adverse effects continue to be a source of concern, and they may stifle market growth until full safety profiles are created through rigorous research.

IMPACT OF RUSSIA UKRAINE WAR

Russia's invasion of Ukraine has impacted negatively on metals exported from these countries Around 10% of the world's silver production is produced by Russia and Ukraine which are two significant silver producers. Due to disruptions in the supply chain caused by Russia and Ukraine, silver prices have surged by more than 30% since February 2022. The cost of colloidal silver products will probably rise as a result of the increase in silver prices. Since the start of the conflict, sales of colloidal silver products have decreased by about 10% in the US. This fall is probably brought on by a number of things, such as rising silver prices, uncertain economic conditions, and unfavorable market mood.

IMPACT OF ONGOING RECESSION

The recession had impacted significantly the colloidal silver market. Due to inflation silver mining and extraction activities are slowed down as mining costs, operational costs, labor costs, transportation costs, and other costs are high which indirectly affects the prices of silver globally. The price of silver has climbed about 20% in the last month to around $25.31 per ounce, outperforming the S&P 500's 5% gain in 2022. During the recession, silver mining stocks surpassed the overall market. Silver prices could reach a nine-year high of $30 per ounce in 2023. The greatest segment of silver consumption is industrial, accounting for over half of total demand. Silver's high price and supply chain disruption have reduced demand and use in industrial and other end-user sectors.

MARKET SEGMENTATION

By Form

  • Powder

  • Liquid

  • Gel

By Particle Size

  • 5 to 10nm

  • 11 to 20nm

  • 21 to 50nm

  • 101 to 200nm

By End Use

  • Dietary Supplements

  • Pharmaceutical

  • Cosmetics & Personal care

  • Food and Beverages

  • Water Treatment

  • Other

Colloidal Silver Market Segmentation Analysis

REGIONAL ANALYSIS

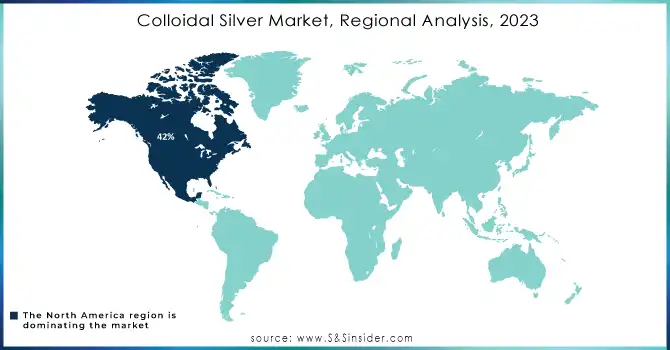
North American colloidal silver market is anticipated to grow at a CAGR of 8.9%. Also, it is predicted to have more than 42% of the market share in 2023, making it the dominant region for colloidal silver globally. The increased demand from the dietary supplement, food & beverages, water treatment, and cosmetics industries is responsible for the market's expansion in North America.

Europe's regional market for colloidal silver is expected to grow at a 7.8% CAGR in 2022. Europe is predicted to be the second-largest market for colloidal Silver Market in 2023, accounting for more than 31% of the market share. The rising usage of colloidal silver in the pharmaceutical sector to the market's rise in Europe. colloidal silver markets in Germany are predicted to grow at a CAGR of 7.2% in the forecast period.

The Asia Pacific market is expected to be the fastest-growing market for Global Colloidal Silver Market with a CAGR of 8.6% over the projected period. Growing consumer awareness and the increase of e-commerce platforms are driving market growth in Asia Pacific. The rising awareness of the health benefits of colloidal silver, growing disposable income, and expanding distribution channels. The colloidal silver market in India is expected to grow at a 12% CAGR over the next ten years.

REGIONAL COVERAGE

North America

  • US

  • Canada

  • Mexico

Europe

  • Eastern Europe

    • Poland

    • Romania

    • Hungary

    • Turkey

    • Rest of Eastern Europe

  • Western Europe

    • Germany

    • France

    • UK

    • Italy

    • Spain

    • Netherlands

    • Switzerland

    • Austria

    • Rest of Western Europe

Asia Pacific

  • China

  • India

  • Japan

  • South Korea

  • Vietnam

  • Singapore

  • Australia

  • Rest of Asia Pacific

Middle East & Africa

  • Middle East

    • UAE

    • Egypt

    • Saudi Arabia

    • Qatar

    • Rest of Middle East

  • Africa

    • Nigeria

    • South Africa

    • Rest of Africa

Latin America

  • Brazil

  • Argentina

  • Colombia

  • Rest of Latin America

KEY PLAYERS

Some major key players in the Colloidal Silver Market are Sovereign Silver, ASAP Silver, Silver Support, Meso Silver, Silver Armor, Heritage Skin Care, Silver Biotics, White Egret, Heritage Products, Silver Solutions, Silver Mountain Minerals, Natural Path Silver Wings, American Biotech Labs, and other key players.

Sovereign Silver-Company Financial Analysis

RECENT DEVELOPMENTS

In June 2022, Silver Mountain Minerals launched new colloidal silver hydrosol solutions with concentrations of 10 ppm and 20 ppm. They have a high bioavailability and can be applied topically as well as orally.

In January 2022, Silver Mountain Minerals partnered with the e-commerce site Vitacost.com to increase the availability of its colloidal silver products in the United States. The partnership will give Silver Mountain Minerals access to a new and growing market for its colloidal silver products.

In October 2021, Real Supplements, a maker of specialized vitamins, was purchased by Sovereign Silver. The acquisition increased the range of nutraceutical products offered by Sovereign Silver.

Colloidal Silver Market Report Scope:
Report Attributes Details
Market Size in 2022  US$ 556.5 Million
Market Size by 2030  US$ 1133.5 Million
CAGR   CAGR of 9.3 % From 2023 to 2030
Base Year 2022
Forecast Period  2023-2030
Historical Data  2019-2021
Report Scope & Coverage Market Size, Segments Analysis, Competitive  Landscape, Regional Analysis, DROC & SWOT Analysis, Forecast Outlook
Key Segments • By Form (Powder, Liquid, Gel)
• By Particle Size (5 to 10nm, 11 to 20nm, 21 to 50nm, 101 to 200nm)
• By End Use (Dietary Supplements, Pharmaceutical, Cosmetics & Personal care, Food and Beverages, Water Treatment, Other)
Regional Analysis/Coverage North America (US, Canada, Mexico), Europe (Eastern Europe [Poland, Romania, Hungary, Turkey, Rest of Eastern Europe] Western Europe] Germany, France, UK, Italy, Spain, Netherlands, Switzerland, Austria, Rest of Western Europe]), Asia Pacific (China, India, Japan, South Korea, Vietnam, Singapore, Australia, Rest of Asia Pacific), Middle East & Africa (Middle East [UAE, Egypt, Saudi Arabia, Qatar, Rest of Middle East], Africa [Nigeria, South Africa, Rest of Africa], Latin America (Brazil, Argentina, Colombia Rest of Latin America)
Company Profiles Sovereign Silver, ASAP Silver, Silver Support, Meso Silver, Silver Armor, Heritage Skin Care, Silver Biotics, White Egret, Heritage Products, Silver Solutions, Silver Mountain Minerals, Natural Path Silver Wings, American Biotech Labs
Key Drivers • Increasing demand in the Pharmaceutical sector
• Advancements in nanotechnology
Market Restrain • High Production Cost


Frequently Asked Questions

Ans: Colloidal Silver Market is anticipated to expand by 9.3% from 2023 to 2030.

Ans: Colloidal Silver Market size was valued at USD 556.5 million in 2022

Ans: The rising applications in other end-user sectors and favorable regulatory scenarios from the FDA are opportunities for the Colloidal Silver Market.

Ans: The Europe region is the second-fastest growing for the Colloidal Silver Market in 2022.

Ans: Safety concerns about the use of colloidal silver are the challenges of the Colloidal Silver Market.

Table of Contents

1. Introduction
1.1 Market Definition
1.2 Scope
1.3 Research Assumptions

2. Research Methodology

3. Market Dynamics
3.1 Drivers
3.2 Restraints
3.3 Opportunities
3.4 Challenges

4. Impact Analysis
4.1 Impact of the Russia-Ukraine War
4.2 Impact of Ongoing Recession
4.2.1 Introduction
4.2.2 Impact on Major Economies
4.2.2.1 US
4.2.2.2 Canada
4.2.2.3 Germany
4.2.2.4 France
4.2.2.5 United Kingdom
4.2.2.6 China
4.2.2.7 Japan
4.2.2.8 South Korea
4.2.2.9 Rest of the World

5. Value Chain Analysis

6. Porter’s 5 forces model

7. PEST Analysis

8. Colloidal Silver Market Segmentation, By Form
8.1 Powder
8.2 Liquid
8.3 Gel

9. Colloidal Silver Market Segmentation, By Particle Size
9.1 5 to 10nm
9.2 11 to 20nm
9.3 21 to 50nm
9.4 101 to 200nm

10. Colloidal Silver Market Segmentation, By End-User
10.1 Dietary Supplements
10.2 Pharmaceutical
10.3 Cosmetics & Personal care
10.4 Food and Beverages
10.5 Water Treatment
10.6 Other

11. Regional Analysis
11.1 Introduction
11.2 North America
11.2.1 North America Colloidal Silver Market by Country
11.2.2 North America Colloidal Silver Market by Form
11.2.3 North America Colloidal Silver Market by Particle Size
11.2.4 North America Colloidal Silver Market by End-User
11.2.5 USA
11.2.5.1 USA Colloidal Silver Market by Form
11.2.5.2 USA Colloidal Silver Market by Particle Size
11.2.5.3 USA Colloidal Silver Market by End-User
11.2.6 Canada
11.2.6.1 Canada Colloidal Silver Market by Form
11.2.6.2 Canada Colloidal Silver Market by Particle Size
11.2.6.3 Canada Colloidal Silver Market by End-User
11.2.7 Mexico
11.2.7.1 Mexico Colloidal Silver Market by Form
11.2.7.2 Mexico Colloidal Silver Market by Particle Size
11.2.7.3 Mexico Colloidal Silver Market by End-User
11.3 Europe
11.3.1 Eastern Europe
11.3.1.1 Eastern Europe Colloidal Silver Market by Country
11.3.1.2 Eastern Europe Colloidal Silver Market by Form
11.3.1.3 Eastern Europe Colloidal Silver Market by Particle Size
11.3.1.4 Eastern Europe Colloidal Silver Market by End-User
11.3.1.5 Poland
11.3.1.5.1 Poland Colloidal Silver Market by Form
11.3.1.5.2 Poland Colloidal Silver Market by Particle Size
11.3.1.5.3 Poland Colloidal Silver Market by End-User
11.3.1.6 Romania
11.3.1.6.1 Romania Colloidal Silver Market by Form
11.3.1.6.2 Romania Colloidal Silver Market by Particle Size
11.3.1.6.4 Romania Colloidal Silver Market by End-User
11.3.1.7 Turkey
11.3.1.7.1 Turkey Colloidal Silver Market by Form
11.3.1.7.2 Turkey Colloidal Silver Market by Particle Size
11.3.1.7.3 Turkey Colloidal Silver Market by End-User
11.3.1.8 Rest of Eastern Europe
11.3.1.8.1 Rest of Eastern Europe Colloidal Silver Market by Form
11.3.1.8.2 Rest of Eastern Europe Colloidal Silver Market by Particle Size
11.3.1.8.3 Rest of Eastern Europe Colloidal Silver Market by End-User
11.3.2 Western Europe
11.3.2.1 Western Europe Colloidal Silver Market by Form
11.3.2.2 Western Europe Colloidal Silver Market by Particle Size
11.3.2.3 Western Europe Colloidal Silver Market by End-User
11.3.2.4 Germany
11.3.2.4.1 Germany Colloidal Silver Market by Form
11.3.2.4.2 Germany Colloidal Silver Market by Particle Size
11.3.2.4.3 Germany Colloidal Silver Market by End-User
11.3.2.5 France
11.3.2.5.1 France Colloidal Silver Market by Form
11.3.2.5.2 France Colloidal Silver Market by Particle Size
11.3.2.5.3 France Colloidal Silver Market by End-User
11.3.2.6 UK
11.3.2.6.1 UK Colloidal Silver Market by Form
11.3.2.6.2 UK Colloidal Silver Market by Particle Size
11.3.2.6.3 UK Colloidal Silver Market by End-User
11.3.2.7 Italy
11.3.2.7.1 Italy Colloidal Silver Market by Form
11.3.2.7.2 Italy Colloidal Silver Market by Particle Size
11.3.2.7.3 Italy Colloidal Silver Market by End-User
11.3.2.8 Spain
11.3.2.8.1 Spain Colloidal Silver Market by Form
11.3.2.8.2 Spain Colloidal Silver Market by Particle Size
11.3.2.8.3 Spain Colloidal Silver Market by End-User
11.3.2.9 Netherlands
11.3.2.9.1 Netherlands Colloidal Silver Market by Form
11.3.2.9.2 Netherlands Colloidal Silver Market by Particle Size
11.3.2.9.3 Netherlands Colloidal Silver Market by End-User
11.3.2.10 Switzerland
11.3.2.10.1 Switzerland Colloidal Silver Market by Form
11.3.2.10.2 Switzerland Colloidal Silver Market by Particle Size
11.3.2.10.3 Switzerland Colloidal Silver Market by End-User
11.3.2.11.1 Austria
11.3.2.11.2 Austria Colloidal Silver Market by Form
11.3.2.11.3 Austria Colloidal Silver Market by Particle Size
11.3.2.11.4 Austria Colloidal Silver Market by End-User
11.3.2.12 Rest of Western Europe
11.3.2.12.1 Rest of Western Europe Colloidal Silver Market by Form
11.3.2.12.2 Rest of Western Europe Colloidal Silver Market by Particle Size
11.3.2.12.3 Rest of Western Europe Colloidal Silver Market by End-User
11.4 Asia-Pacific
11.4.1 Asia-Pacific Colloidal Silver Market by Country
11.4.2 Asia-Pacific Colloidal Silver Market by Form
11.4.3 Asia-Pacific Colloidal Silver Market by Particle Size
11.4.4 Asia-Pacific Colloidal Silver Market by End-User
11.4.5 China
11.4.5.1 China Colloidal Silver Market by Form
11.4.5.2 China Colloidal Silver Market by End-User
11.4.5.3 China Colloidal Silver Market by Particle Size
11.4.6 India
11.4.6.1 India Colloidal Silver Market by Form
11.4.6.2 India Colloidal Silver Market by Particle Size
11.4.6.3 India Colloidal Silver Market by End-User
11.4.7 Japan
11.4.7.1 Japan Colloidal Silver Market by Form
11.4.7.2 Japan Colloidal Silver Market by Particle Size
11.4.7.3 Japan Colloidal Silver Market by End-User
11.4.8 South Korea
11.4.8.1 South Korea Colloidal Silver Market by Form
11.4.8.2 South Korea Colloidal Silver Market by Particle Size
11.4.8.3 South Korea Colloidal Silver Market by End-User
11.4.9 Vietnam
11.4.9.1 Vietnam Colloidal Silver Market by Form
11.4.9.2 Vietnam Colloidal Silver Market by Particle Size
11.4.9.3 Vietnam Colloidal Silver Market by End-User
11.4.10 Singapore
11.4.10.1 Singapore Colloidal Silver Market by Form
11.4.10.2 Singapore Colloidal Silver Market by Particle Size
11.4.10.3 Singapore Colloidal Silver Market by End-User
11.4.11 Australia
11.4.11.1 Australia Colloidal Silver Market by Form
11.4.11.2 Australia Colloidal Silver Market by Particle Size
11.4.11.3 Australia Colloidal Silver Market by End-User
11.4.12 Rest of Asia-Pacific
11.4.12.1 Rest of Asia-Pacific Colloidal Silver Market by Form
11.4.12.2 Rest of Asia-Pacific Colloidal Silver Market by Particle Size
11.4.12.3 Rest of Asia-Pacific Colloidal Silver Market by End-User
11.5 Middle East & Africa
11.5.1 Middle East
11.5.1.1 Middle East Colloidal Silver Market by Country
11.5.1.2 Middle East Colloidal Silver Market by Form
11.5.1.3 Middle East Colloidal Silver Market by Particle Size
11.5.1.4 Middle East Colloidal Silver Market by End-User
11.5.1.5 UAE
11.5.1.5.1 UAE Colloidal Silver Market by Form
11.5.1.5.2 UAE Colloidal Silver Market by Particle Size
11.5.1.5.3 UAE Colloidal Silver Market by End-User
11.5.1.6 Egypt
11.5.1.6.1 Egypt Colloidal Silver Market by Form
11.5.1.6.2 Egypt Colloidal Silver Market by Particle Size
11.5.1.6.3 Egypt Colloidal Silver Market by End-User
11.5.1.7 Saudi Arabia
11.5.1.7.1 Saudi Arabia Colloidal Silver Market by Form
11.5.1.7.2 Saudi Arabia Colloidal Silver Market by Particle Size
11.5.1.7.3 Saudi Arabia Colloidal Silver Market by End-User
11.5.1.8 Qatar
11.5.1.8.1 Qatar Colloidal Silver Market by Form
11.5.1.8.2 Qatar Colloidal Silver Market by Particle Size
11.5.1.8.3 Qatar Colloidal Silver Market by End-User
11.5.1.9 Rest of Middle East
11.5.1.9.1 Rest of Middle East Colloidal Silver Market by Form
11.5.1.9.2 Rest of Middle East Colloidal Silver Market by Particle Size
11.5.1.9.3 Rest of Middle East Colloidal Silver Market by End-User
11.5.2 Africa
11.5.2.1 Africa Transfusion Diagnostics Market by Country
11.5.2.2 Africa Colloidal Silver Market by Form
11.5.2.3 Africa Colloidal Silver Market by Particle Size
11.5.2.4 Africa Colloidal Silver Market by End-User
11.5.2.5 Nigeria
11.5.2.5.1 Nigeria Colloidal Silver Market by Form
11.5.2.5.2 Nigeria Colloidal Silver Market by Particle Size
11.5.2.5.3 Nigeria Colloidal Silver Market by End-User
11.5.2.6 South Africa
11.5.2.6.1 South Africa Colloidal Silver Market by Form
11.5.2.6.2 South Africa Colloidal Silver Market by Particle Size
11.5.2.6.3 South Africa Colloidal Silver Market by End-User
11.5.2.7 Rest of Africa
11.5.2.7.1 Rest of Africa Colloidal Silver Market by Form
11.5.2.7.2 Rest of Africa Colloidal Silver Market by Particle Size
11.5.2.7.3 Rest of Africa Colloidal Silver Market by End-User
11.6 Latin America
11.6.1 Latin America Colloidal Silver Market by Country
11.6.2 Latin America Colloidal Silver Market by Form
11.6.3 Latin America Colloidal Silver Market by Particle Size
11.6.4 Latin America Colloidal Silver Market by End-User
11.6.5 Brazil
11.6.5.1 Brazil Colloidal Silver Market by Form
11.6.5.2 Brazil Colloidal Silver Market by Particle Size
11.6.5.3 Brazil Colloidal Silver Market by End-User
11.6.6 Argentina
11.6.6.1 Argentina Colloidal Silver Market by Form
11.6.6.2 Argentina Colloidal Silver Market by Particle Size
11.6.6.3 Argentina Colloidal Silver Market by End-User
11.6.7 Colombia
11.6.7.1 Colombia Colloidal Silver Market by Form
11.6.7.2 Colombia Colloidal Silver Market by Particle Size
11.6.7.3 Colombia Colloidal Silver Market by End-User
11.6.8 Rest of Latin America
11.6.8.1 Rest of Latin America Colloidal Silver Market by Form
11.6.8.2 Rest of Latin America Colloidal Silver Market by Particle Size
11.6.8.3 Rest of Latin America Colloidal Silver Market by End-User

12.Company profile
12.1 Sovereign Silver
12.1.1 Company Overview
12.1.2 Financial
12.1.3 Products/ Services Offered
12.1.4 SWOT Analysis
12.1.5 The SNS View
12.2 Silver Support
12.2.1 Company Overview
12.2.2 Financials
12.2.3 Product/Services Offered
12.2.4 SWOT Analysis
12.2.5 The SNS View
12.3 ASAP Silver
12.3.1 Company Overview
12.3.2 Financials
12.3.3 Product/Services Offered
12.3.4 SWOT Analysis
12.3.5 The SNS View
12.4 Silver Armor
12.4.1 Company Overview
12.4.2 Financials
12.4.3 Product/Services Offered
12.4.4 SWOT Analysis
12.4.5 The SNS View
12.5 Meso Silver
12.5.1 Company Overview
12.5.2 Financials
12.5.3 Product/Services Offered
12.5.4 SWOT Analysis
12.5.5 The SNS View
12.6 Heritage Skin Care
12.6.1 Company Overview
12.6.2 Financials
12.6.3 Product/Services Offered
12.6.4 SWOT Analysis
12.6.5 The SNS View
12.7 Silver Biotics
12.7.1 Company Overview
12.7.2 Financials
12.7.3 Product/Services Offered
12.7.4 SWOT Analysis
12.7.5 The SNS View
12.8 White Egret
12.8.1 Company Overview
12.8.2 Financials
12.8.3 Product/Services Offered
12.8.4 SWOT Analysis
12.8.5 The SNS View
12.9 Heritage Products
12.9.1 Company Overview
12.9.2 Financials
12.9.3 Product/Services Offered
12.9.4 SWOT Analysis
12.9.5 The SNS View
12.10 Silver Solutions
12.10.1 Company Overview
12.10.2 Financials
12.10.3 Product/Services Offered
12.10.4 SWOT Analysis
12.10.5 The SNS View
12.11 Silver Mountain Minerals
12.11.1 Company Overview
12.11.2 Financials
12.11.3 Product/Services Offered
12.11.4 SWOT Analysis
12.11.5 The SNS View
12.12 Natural Path Silver Wings
12.12.1 Company Overview
12.12.2 Financials
12.12.3 Product/Services Offered
12.12.4 SWOT Analysis
12.12.5 The SNS View
12.13 American Biotech Labs
12.13.1 Company Overview
12.13.2 Financials
12.13.3 Product/Services Offered
12.13.4 SWOT Analysis
12.13.5 The SNS View

13. Competitive Landscape
13.1 Competitive Benchmarking
13.2 Market Share Analysis
13.3 Recent Developments
13.3.1 Industry News
13.3.2 Company News
13.3.3 Mergers & Acquisitions

14. Use Case and Best Practices

15. Conclusion

An accurate research report requires proper strategizing as well as implementation. There are multiple factors involved in the completion of good and accurate research report and selecting the best methodology to compete the research is the toughest part. Since the research reports we provide play a crucial role in any company’s decision-making process, therefore we at SNS Insider always believe that we should choose the best method which gives us results closer to reality. This allows us to reach at a stage wherein we can provide our clients best and accurate investment to output ratio.

Each report that we prepare takes a timeframe of 350-400 business hours for production. Starting from the selection of titles through a couple of in-depth brain storming session to the final QC process before uploading our titles on our website we dedicate around 350 working hours. The titles are selected based on their current market cap and the foreseen CAGR and growth.


The 5 steps process:

Step 1: Secondary Research:

Secondary Research or Desk Research is as the name suggests is a research process wherein, we collect data through the readily available information. In this process we use various paid and unpaid databases which our team has access to and gather data through the same. This includes examining of listed companies’ annual reports, Journals, SEC filling etc. Apart from this our team has access to various associations across the globe across different industries. Lastly, we have exchange relationships with various university as well as individual libraries.

Secondary Research

Step 2: Primary Research

When we talk about primary research, it is a type of study in which the researchers collect relevant data samples directly, rather than relying on previously collected data.  This type of research is focused on gaining content specific facts that can be sued to solve specific problems. Since the collected data is fresh and first hand therefore it makes the study more accurate and genuine.

We at SNS Insider have divided Primary Research into 2 parts.

Part 1 wherein we interview the KOLs of major players as well as the upcoming ones across various geographic regions. This allows us to have their view over the market scenario and acts as an important tool to come closer to the accurate market numbers. As many as 45 paid and unpaid primary interviews are taken from both the demand and supply side of the industry to make sure we land at an accurate judgement and analysis of the market.

This step involves the triangulation of data wherein our team analyses the interview transcripts, online survey responses and observation of on filed participants. The below mentioned chart should give a better understanding of the part 1 of the primary interview.

Primary Research

Part 2: In this part of primary research the data collected via secondary research and the part 1 of the primary research is validated with the interviews from individual consultants and subject matter experts.

Consultants are those set of people who have at least 12 years of experience and expertise within the industry whereas Subject Matter Experts are those with at least 15 years of experience behind their back within the same space. The data with the help of two main processes i.e., FGDs (Focused Group Discussions) and IDs (Individual Discussions). This gives us a 3rd party nonbiased primary view of the market scenario making it a more dependable one while collation of the data pointers.

Step 3: Data Bank Validation

Once all the information is collected via primary and secondary sources, we run that information for data validation. At our intelligence centre our research heads track a lot of information related to the market which includes the quarterly reports, the daily stock prices, and other relevant information. Our data bank server gets updated every fortnight and that is how the information which we collected using our primary and secondary information is revalidated in real time.

Data Bank Validation

Step 4: QA/QC Process

After all the data collection and validation our team does a final level of quality check and quality assurance to get rid of any unwanted or undesired mistakes. This might include but not limited to getting rid of the any typos, duplication of numbers or missing of any important information. The people involved in this process include technical content writers, research heads and graphics people. Once this process is completed the title gets uploader on our platform for our clients to read it.

Step 5: Final QC/QA Process:

This is the last process and comes when the client has ordered the study. In this process a final QA/QC is done before the study is emailed to the client. Since we believe in giving our clients a good experience of our research studies, therefore, to make sure that we do not lack at our end in any way humanly possible we do a final round of quality check and then dispatch the study to the client.

Start a Conversation

Hi! Click one of our member below to chat on Phone