Computer Aided Detection Market Report Scope & Overview:
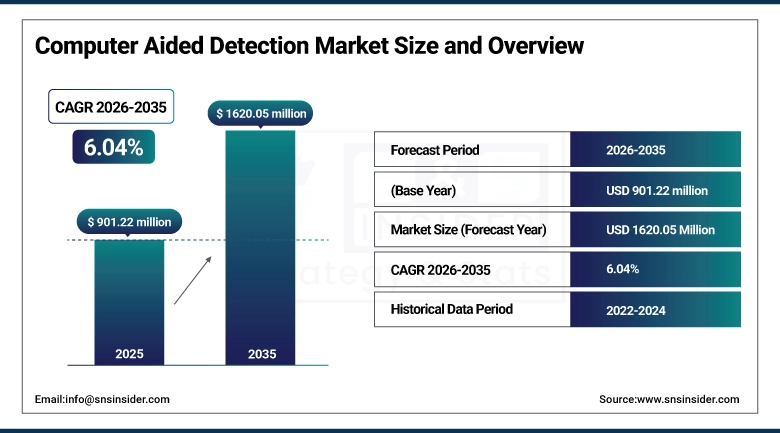
The Computer Aided Detection Market size was valued at USD 901.22 Million in 2025 and is projected to reach USD 1620.05 Million by 2035, growing at a CAGR of 6.04% during 2026-2035.
The global computer-aided detection (CAD) market growth is strongly driven by the rising prevalence of chronic diseases, including breast, lung, colorectal, and prostate cancers. The increasing number of patients requiring early and accurate diagnosis has amplified demand for CAD systems in hospitals and Diagnostic Centers. Additionally, the market trend is fueled by expanding government and private screening programs, along with growing awareness among patients about the importance of early disease detection, further boosting CAD adoption globally.
For instance, in March 2024, the WHO reported 2.6 million global breast cancer cases, up from 2.4 million in 2023, driving higher adoption of Computer-Aided Detection systems.
Computer Aided Detection Market Size and Forecast:
-
Market Size in 2025: USD 901.22 Million
-
Market Size by 2035: USD 1620.05 Million
-
CAGR: 6.04% from 2026 to 2035
-
Base Year: 2025
-
Forecast Period: 2026–2035
-
Historical Data: 2022–2024
To Get more information on Computer Aided Detection Market - Request Free Sample Report
Computer Aided Detection Market Trends:
-
Rising prevalence of cancers and chronic diseases, including breast, lung, colorectal, and prostate cancers, is driving demand for CAD solutions for early and accurate diagnosis.
-
Advancements in AI and deep learning algorithms are enabling more precise and faster detection, reducing false positives and improving diagnostic accuracy across imaging modalities.
-
Integration with 3D imaging and tomosynthesis is enhancing lesion detection, particularly in breast and lung cancer screening, supporting early-stage diagnosis.
-
Cloud-based and remote CAD solutions are increasing accessibility in hospitals, Diagnostic Centers, and emerging markets, allowing centralized image analysis and collaboration.
-
Government screening programs and awareness campaigns are expanding the adoption of CAD for population-level disease detection and preventive healthcare.
-
Collaborations between AI companies, radiology firms, and research institutions are accelerating the development of next-generation CAD software and AI-enabled imaging tools.
-
Trends toward tele-radiology and AI-driven predictive analytics are improving workflow efficiency, patient management, and treatment planning while supporting radiologists in high-volume imaging centers.
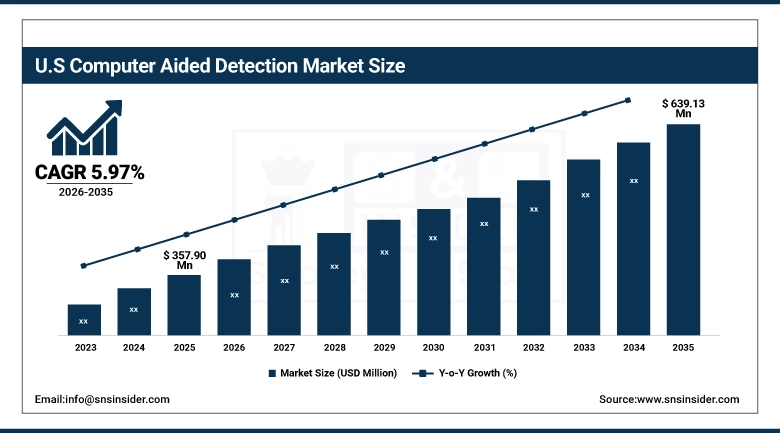
U.S. Computer Aided Detection Market Insights:
The U.S. Computer Aided Detection Market size was valued at USD 357.90 Million in 2025 and is projected to reach USD 639.13 Million by 2035, growing at a CAGR of 5.97% during 2026-2035. The US Computer-Aided Detection (CAD) market analysis shows that the country leads due to its advanced healthcare infrastructure, including well-equipped hospitals, imaging centers, and diagnostic networks, enabling seamless CAD integration. Additionally, the high prevalence of cancers, including breast, lung, colorectal, and prostate, along with chronic diseases like cardiovascular and kidney disorders, is driving strong demand for early and accurate detection solutions, further boosting CAD adoption globally.
Computer Aided Detection Market Growth Drivers:
-
Increasing Screening Programs and Awareness Driving Computer Aided Detection Consumption Growth
The computerm aided detection (CAD) market is significantly driven by increasing screening programs and growing awareness about early disease detection. Government and private initiatives for breast, lung, colorectal, and other cancer screenings are encouraging hospitals and Diagnostic Centers to adopt CAD systems. Rising patient awareness about the importance of timely diagnosis is prompting healthcare providers to integrate AI-powered CAD solutions, improving accuracy, workflow efficiency, and overall preventive healthcare outcomes.
For instance, in September 2024, the CDC reported 75% of eligible U.S. women underwent mammography, up from 72% in 2023, boosting the adoption of CAD for early breast cancer detection.
Computer Aided Detection Market Restraints:
-
Limited Skilled Workforce for AI Integration Limits Market Expansion Globally
Limited availability of skilled professionals trained to operate and interpret AI-based CAD systems. Many radiologists and technicians lack experience with advanced deep learning algorithms, which can hinder effective integration into clinical workflows. Additionally, hospitals and Diagnostic Centers must invest time and resources in staff training, making adoption slower, especially in smaller facilities or emerging markets with fewer specialized personnel.
Computer Aided Detection Market Opportunities:
-
Rising Demand for Early Disease Detection Creates Growth Opportunities for the Computer Aided Detection Market
A major opportunity for the computer aided detection (CAD) market lies in the rising demand for early disease detection. Increasing awareness among patients and healthcare providers about the benefits of preventive healthcare is driving hospitals and Diagnostic Centers to adopt CAD systems. By enabling timely and accurate diagnosis of cancers and chronic diseases, CAD improves patient outcomes, reduces treatment costs, and positions healthcare providers to meet the growing need for proactive, data-driven medical care.
For instance, in March 2024, the WHO reported that over 220 million people globally participated in cancer screening programs, up from 200 million in 2023, boosting CAD adoption.
Computer Aided Detection Market Segmentation Analysis:
-
By technology, machine learning-based CAD led the market with a 40.87% share in 2025, while deep learning-based CAD is registering the fastest growth with a CAGR of 6.53%.
-
By imaging modalities, mammography led the computer aided detection market with a 33.88% share in 2025, while the tomosynthesis nuclear imaging is the fastest-growing segment with a CAGR of 6.83%.
-
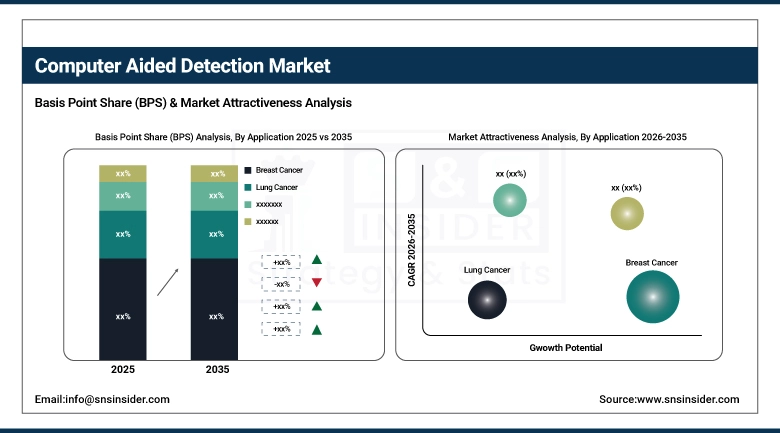
By application, the breast cancer segment dominated the market with a 34.89% share in 2025, whereas the lung cancer segment is expected to grow fastest with a CAGR of 6.81%.
-
By end user, hospitals held a 57.85%share in 2025, while diagnostic centers are growing the fastest with a CAGR of 6.53%.
By Application, Breast Cancer Dominates While Lung Cancers Show Rapid Growth
The Breast Cancer segment was estimated to be the largest revenue generator with an approximate 34.89% of the total market share in 2025, due to rising breast cancer incidence, widespread mammography and tomosynthesis screening programs, increasing patient awareness, and adoption of AI-driven CAD systems for early, accurate, and efficient detection. For instance, the Lung Cancer segment is anticipated to be the fastest growing with a CAGR of around 6.81%, by 2026-2035, due to increasing lung cancer prevalence, rising low-dose CT screening adoption, and AI-enabled CAD systems improving early detection and diagnostic accuracy in high-risk populations.
By Technology, Machine Learning-Based CAD Leads, While Deep Learning-Based CAD Registers Fastest Growth
The Machine Learning-Based CAD segment accounted for the highest share of revenues in the computer aided detection market at 40.87% in the year 2025, due to its ability to analyze large imaging datasets, improve diagnostic accuracy, reduce false positives, and support radiologists with efficient, AI-driven detection across multiple imaging modalities. While the serology tests platforms segment is expected to achieve the fastest CAGR of approximately 6.53% during the predicted period from 2026-2035, due to superior accuracy, AI-driven predictive analysis, enhanced image interpretation, and widespread adoption in radiology and oncology for early and reliable disease detection.
By Imaging Modalities, Mammography Leads the Market, While Tomosynthesis and Nuclear Imaging Register the Fastest Growth
The mammography segment dominated the computer aided detection market with a revenue share of about 33.88% in 2025, due to increasing breast cancer prevalence, government screening programs, rising patient awareness, and adoption of advanced 3D imaging and tomosynthesis, which enhance early detection accuracy and drive widespread CAD integration in clinical practice.. The tomosynthesis nuclear imaging segment will grow at the highest CAGR of nearly 6.83% CAGR between 2026 and 2035, due to advanced 3D imaging, improved lesion detection, rising cancer screening initiatives, and increased adoption of AI-assisted diagnostics for more accurate early-stage disease detection.
By End User, Hospital Lead, While Diagnostic Centers Grow Fastest
The hospital segment accounted for the largest share of the computer aided detection market at around 57.85%in 2025, due to high patient volumes, multi-specialty imaging departments, increasing demand for early disease detection, and adoption of AI-based CAD systems to improve diagnostic accuracy, workflow efficiency, and overall patient outcomes. The Diagnostic Centers segment will have the highest CAGR of nearly 6.53% during 2026–2035, due to rising standalone imaging facilities, increasing adoption of AI-driven detection tools, and growing demand for faster, accurate, and cost-effective diagnostic services.
Computer Aided Detection Market Regional Analysis:
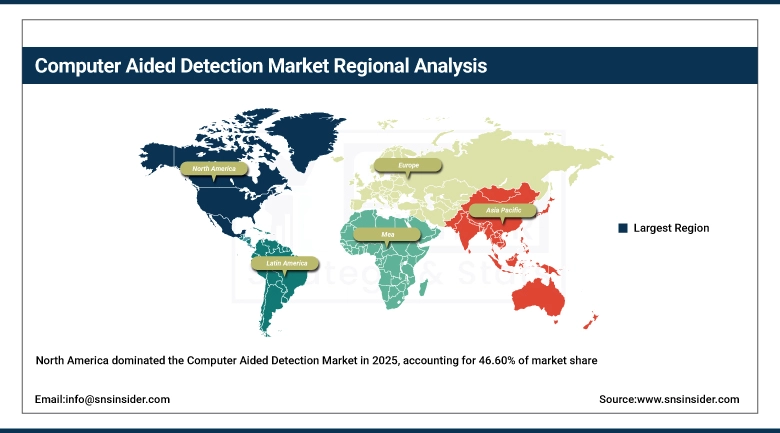
North America Computer Aided Detection Market Insights
North America dominates the computer aided detection market with a market share of 46.60% 2025, due to its advanced healthcare infrastructure, high prevalence of cancers and chronic diseases, and early adoption of AI and deep learning technologies. Strong government support for screening programs, favorable reimbursement policies, and significant investments in healthcare IT and imaging innovations further drive CAD adoption. Additionally, the presence of leading CAD companies and high patient awareness contribute to the region’s market leadership and sustained growth.
Get Customized Report as per Your Business Requirement - Enquiry Now
U.S. Computer Aided Detection Market Insights
The U.S. leads the North American CAD market due to advanced healthcare infrastructure, high cancer prevalence, early AI adoption, government screening programs, favorable reimbursement policies, and the presence of major CAD technology developers driving widespread adoption.
Asia-Pacific Computer Aided Detection Market Insights
Asia-Pacific is the fastest-growing region in the computer aided detection market, registering a CAGR of 6.94 % over the forecast period, due to rapidly expanding healthcare infrastructure, increasing government initiatives for cancer and chronic disease screening, and rising patient awareness about early diagnosis. Growing investments in AI-powered medical imaging, adoption of cloud-based CAD solutions, and the establishment of advanced diagnostic centers in countries like China, India, and Japan are driving market penetration. Additionally, a large patient population and rising healthcare expenditure further fuel CAD adoption in the region.
China leads the Asia-Pacific CAD market due to rapidly expanding healthcare infrastructure, rising cancer and chronic disease prevalence, growing adoption of AI- and deep learning-based CAD systems, government-led screening programs, and increasing patient awareness about early disease detection.
Europe Computer Aided Detection Market Insights
Europe holds the second-largest position in the Computer-Aided Detection (CAD) market due to advanced healthcare infrastructure, high prevalence of cancers and chronic diseases, and early adoption of AI-driven imaging technologies. Supportive government policies, widespread screening programs, and favorable reimbursement frameworks encourage hospitals and diagnostic centers to implement CAD systems. Additionally, strong R&D activities, collaborations between medical device companies and research institutions, and growing patient awareness contribute to Europe’s significant market share.
Germany Computer Aided Detection Market Insights
Germany leads the European CAD market due to its advanced healthcare infrastructure, high adoption of AI- and machine learning-based diagnostic tools, extensive cancer screening programs, supportive government policies, and growing patient awareness, driving demand for early and accurate disease detection.
Latin America (LATAM) and Middle East & Africa (MEA) Computer Aided Detection Market Insights
The Latin America and Middle East & Africa regions are emerging markets in the Computer-Aided Detection (CAD) industry, experiencing steady growth due to improving healthcare infrastructure, increasing prevalence of cancers and chronic diseases, and rising awareness of early diagnosis. Government initiatives and screening programs are driving CAD adoption in hospitals and diagnostic centers. Additionally, investments in AI-based imaging solutions and collaborations with global CAD providers are supporting market expansion in these regions.
Computer Aided Detection Market Competitive Landscape:
Siemens Healthineers, headquartered in Erlangen, Germany, was founded in 1847. The company specializes in advanced medical imaging, laboratory diagnostics, and AI-driven healthcare solutions. Its CAD offerings enhance diagnostic accuracy across oncology, cardiology, and radiology, integrating deep learning algorithms with imaging modalities to support early disease detection and streamline clinical workflows.
-
In April 2025, Siemens Healthineers launched AI-Rad Companion Chest CT, an advanced AI-powered CAD tool for automated lung and cardiovascular analysis, improving diagnostic accuracy and workflow efficiency in clinical settings.
GE Healthcare, headquartered in Chicago, Illinois, USA, was founded in 1892. It provides innovative imaging systems, CAD solutions, and AI-powered diagnostics to improve patient outcomes. Its CAD technologies focus on cancer detection, cardiovascular imaging, and predictive analytics, helping healthcare providers enhance diagnostic precision and operational efficiency globally.
-
In January 2025, GE Healthcare introduced Revolution Apex AI, a CAD-enhanced imaging platform integrating deep learning algorithms for early cancer detection and predictive analytics across oncology and cardiology imaging
Philips Healthcare, headquartered in Amsterdam, Netherlands, was founded in 1891. It delivers integrated imaging systems, AI-based CAD solutions, and digital health tools. Philips’ CAD offerings support early cancer detection, cardiovascular diagnostics, and multi-modality imaging, combining advanced AI algorithms with clinical expertise to improve patient care and operational workflow efficiency.
-
In March 2024, Philips Healthcare rolled out IntelliSpace AI Workflow Suite, a CAD solution leveraging AI to assist radiologists in early breast and lung cancer detection, improving efficiency and reducing diagnostic errors.
Computer Aided Detection Market Key Players:
-
Siemens Healthineers
-
GE Healthcare
-
Philips Healthcare
-
Hologic, Inc.
-
iCAD, Inc.
-
Fujifilm Holdings Corporation
-
Canon Medical Systems Corporation
-
Agfa-Gevaert Group
-
Medtronic plc
-
ContextVision AB
-
Carestream Health
-
Riverain Technologies
-
Qure.ai
-
Infervision
-
Zebra Medical Vision
-
Lunit Inc.
-
Koios Medical
-
RadNet, Inc.
-
RadNet, Inc.
-
Samsung Medison Co., Ltd.
| Report Attributes | Details |
|---|---|
| Market Size in 2025 | USD 901.22 Million |
| Market Size by 2035 | USD 1620.05 Million |
| CAGR | CAGR of 6.04% From 2026 to 2035 |
| Base Year | 2025 |
| Forecast Period | 2026-2035 |
| Historical Data | 2022-2024 |
| Report Scope & Coverage | Market Size, Segments Analysis, Competitive Landscape, Regional Analysis, DROC & SWOT Analysis, Forecast Outlook |
| Key Segments | • By Imaging Modalities (Mammography, Magnetic Resonance Imaging, Ultrasound Imaging, Tomosynthesis Nuclear Imaging) • By Application (Breast Cancer, Lung Cancer, Colorectal Cancer, Prostate Cancer, Liver Cancer, Bone Cancer) • By Technology (Machine Learning-Based CAD, Deep Learning-Based CAD, Traditional CAD) • By End User (Hospitals, Diagnostic Centers, Research Centers) |
| Regional Analysis/Coverage | North America (US, Canada), Europe (Germany, UK, France, Italy, Spain, Russia, Poland, Rest of Europe), Asia Pacific (China, India, Japan, South Korea, Australia, ASEAN Countries, Rest of Asia Pacific), Middle East & Africa (UAE, Saudi Arabia, Qatar, South Africa, Rest of Middle East & Africa), Latin America (Brazil, Argentina, Mexico, Colombia, Rest of Latin America). |
| Company Profiles | Siemens Healthineers, GE Healthcare, Philips Healthcare, Hologic, Inc., iCAD, Inc., Fujifilm Holdings Corporation, Canon Medical Systems Corporation, Agfa-Gevaert Group, Medtronic plc, ContextVision AB, Carestream Health, Riverain Technologies, Qure.ai, Infervision, Zebra Medical Vision, Lunit Inc., Koios Medical, RadNet, Inc., RadNet, Inc., Samsung Medison Co., Ltd.and other players. |
Frequently Asked Questions
The Computer Aided Detection Market was valued at USD 901.22 million in 2025.
The market is expected to reach USD 1,620.05 million by 2035.
The market is projected to grow at a CAGR of 6.04% during the forecast period from 2026 to 2035.
CAD systems are used in medical imaging to assist radiologists in detecting abnormalities such as tumors, lesions, and other diseases.
Key growth drivers include increasing prevalence of chronic diseases, rising demand for early diagnosis, and advancements in AI-based imaging technologies.
Get in Touch
