Global Digital Biomarkers Market Overview:
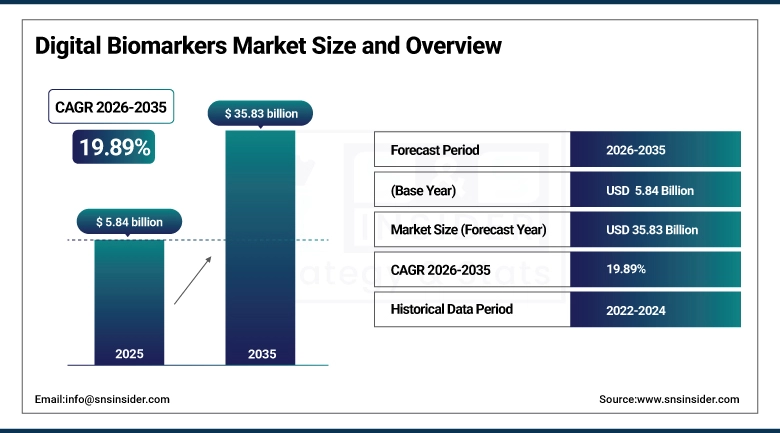
The Digital Biomarkers Market size is estimated at USD 5.84 billion in 2025 and is projected to reach USD 35.83 billion by 2035, growing at a CAGR of 19.89%.
A rapidly growing global digital biomarkers market, driven by a projected estimate of over 350 million wearable and sensor devices in use by 2025. The highest proportion of applications is represented by physiological and behavioral biomarkers, (supported by increasing penetration in chronic disease management), followed by cognitive biomarkers and vocal Biomarlcets (both getting interest in neurology/mental health field). Rising cloud-based infrastructures, mobile apps and AI-backed analytics are promoting worldwide acceptance in pharma, research institutions and healthcare providers.
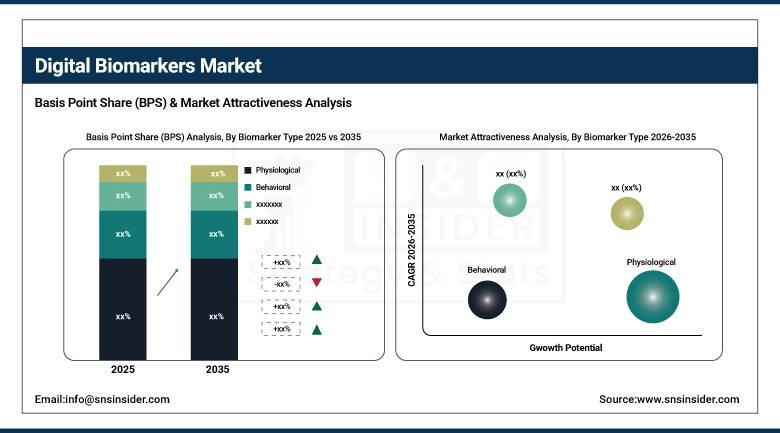
Physiological and behavioral biomarkers together accounted for over 60% of the digital biomarkers market demand in 2025.
Digital Biomarkers Market Size and Forecast:
-
Market Size in 2025: USD 5.84 Billion
-
Market Size by 2035: USD 35.83 Billion
-
CAGR: 19.89% from 2026 to 2035
-
Base Year: 2025
-
Forecast Period: 2026–2035
-
Historical Data: 2022–2024
To Get More Information On Digital Biomarkers Market - Request Free Sample Report
Digital Biomarkers Market Trends:
-
By 2028 and motivated by the need for chronic disease monitoring, physiological biomarkers are anticipated to comprise more than 40% of all digital biomarker deployment.
-
Global wearable-based digital biomarkers adoption will grow more than 55% over 2025-29 as connected health devices are added.
-
North America is expected to represent 37 per cent of global digital biomarker market revenue in 2027, benefiting from robust pharma–tech partnerships.
-
Demand will be driven by applications in neurology and mental health, with cognitive and vocal biomarker uptake increasing 28% by 2030.
-
Cloud-delivered solutions will represent over one-third of deployments by 2029 as scalability and integration with AI drive adoption.
U.S. Digital Biomarkers Market Insights:
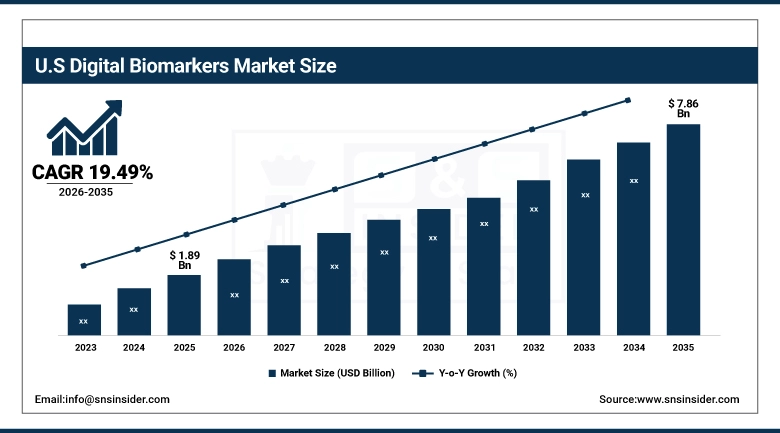
The U.S. Digital Biomarkers Market size is estimated at USD 1.89 billion in 2025 and is projected to reach USD 7.86 billion by 2035, growing at a CAGR of 19.49% during 2026–2035. The nation dominates adoption with more than 25,000 active clinical trials including digital endpoints plus over 120 million wearable device users. Rigorous FDA guidance, pharma–tech partnerships and early adoption into decentralized trials allow it to maintain growth and innovation leadership.
Digital Biomarkers Market Growth Drivers:
-
Wearable Devices and Mobile Platforms Accelerate Real-Time Digital Biomarker Adoption in Chronic Disease Monitoring Worldwide.
Wearable devices and mobile platforms are accelerating the adoption of digital biomarkers in chronic disease monitoring. Over the next decade, there will be a global installed base of roughly over 380 million connected health devices which can dynamically track patient data in real time. These solutions are able to increase patient adherence up to 25% and give clinicians actionable insights. This leads to increased treatment personalization, early intervention and more robust digital biomarker integration in worldwide health systems.
In 2026, wearable-integrated digital biomarker solutions are projected to grow by nearly 22% year-on-year, making them the fastest-growing adoption channel in the sector.
Digital Biomarkers Market Restraints:
-
Data Privacy and Security Concerns Restrict Wider Adoption of Digital Biomarkers Across Healthcare and Clinical Research Settings.
Data privacy and security remain critical barriers in the digital biomarkers market. The average data breach in 2024 involving healthcare compromised more than 116 million patient records and demonstrated how weak spots remain with connected health platforms. Related regulatory compliance with HIPAA, AND GDPR add additional cost and time to adoption. This translates to more than 45% of healthcare organizations admitting they have cyber security concerns, putting a dampener on the full implementation digital biomarker solutions across the entire clinical trial continuum, chronic disease management and real-world patient programs.
Digital Biomarkers Market Opportunities:
-
Integration of Digital Biomarkers into Decentralized Clinical Trials Creates New Opportunities for Accelerating Drug Development and Approvals.
The integration of digital biomarkers into decentralized clinical trials is creating major opportunities in drug development. Over 65% of Phase II and III clinical studies will share the presence of digital endpoints by 2027, allowing for ongoing data collection and decreasing patient trips to site. This move can reduce trial timelines by up to 20% and enhance patient recruitment and retention, accelerating time-to-approval while also further elevating the importance of digital biomarkers in precision medicine.
By 2027, digital biomarkers in decentralized trials will represent nearly 42% of late-stage studies, boosting drug development.
Digital Biomarkers Market Segmentation Analysis:
-
By Deployment Mode, Cloud-Based solutions held the largest market share with 46.11% in application of IoT in Retail by 2025 and Hybrid is expected to grow at the highest CAGR, registering growth of 20.75%.
-
By Biomarker Type, Physiological biomarkers held the largest market share of 38.45% in 2025 and Cognitive Biomarkers is expected to grow with the highest CAGR of 21.67%.
-
By Application, Neurology held a share of 32.28% in year 2025, while Oncology is anticipated to record the growth rate of 20.34%.
-
By Platform, Wearables contributed to the highest market share of 41.52% in 2025 and Mobile Apps are expected to grow at the fastest rate with a CAGR of 22.89%.
-
By End User, Pharmaceutical & Biopharma Companies held the largest market size with 36.94% in 2025 and it is considered to grow at a CAGR of 19.82%.
-
By Distribution Channel, Direct Sales comprised 44.27% in 2025, and Online Platforms is anticipated to expand at a CAGR of 23.56%.
By Biomarker Type, Physiological Biomarkers Dominate While Cognitive Biomarkers Grow Rapidly:
Physiological bio-markers are the leaders for adoption and have been aided by 200+ million wearable devices measuring metrics such as heart rate, blood pressure or glucose. Their practical robustness and support for long-term disease management mean their dominance. Cognitive biomarkers are proliferating fastest, fueled by increasing neurological and mental health demands. By 2030, we believe there will be over 120 million digital cognitive assessments performed each year promoting early detection of Alzheimer’s and similar neurodegenerative diseases.
By Deployment Mode, Cloud-Based Solutions Dominate While Hybrid Models Grow Fastest:
Cloud solutions drive deployment; processing more than 10 billion health-related data points each day globally. Their scalable systems enable pharma, research institutions and health care providers to address large patient populations. Hybrid deployment options are progressing most rapidly as organisations weigh the benefits of cloud freedom against on-premise security. Already by 2030, one out of three hospitals will leverage hybrid digital biomarker platforms that support AI-powered analytics, but still maintain high levels of compliance and security.
By Application, Neurology Leads While Oncology Expands Fastest:
The neurology space is the biggest driver of digital biomarker application, with more than 90 million patients globally now using digital solutions to monitor Parkinson’s disease, epilepsy and mental health. Continuous tracking provides deeper insights into disease progression. Oncology is expanding quickly, with digital biomarkers expected in over 65% of oncology clinical trials by 2029. These innovations will accelerate cancer drug approvals, improve patient stratification, and enable precision therapies tailored to individual biological and behavioral data.
By Platform, Wearables Dominate While Mobile Apps Surge Ahead:
Wearables will be the most used platform, counting more than 350 million active devices collecting physiological and behavioural-biomarkers worldwide by 2026. Their simplicity to use and solid insurer support encourage prospective patient uptake. Mobile applications are still coming fast, capitalizing on smartphone penetration to capture data globally. More than 150 million people will be using biomarker tracking health apps by 2033: Chronic disease management, remote monitoring and mental health engagement for digital ecosystems.
By End User, Pharma & Biopharma Dominate While Healthcare Providers Accelerate:
The biggest end users are pharma and biopharma, with digital biomarkers employed in more than 60% of Phase II and III trials to enable real time endpoints for patients monitoring. This requires trial timelines are shorten and data quality is improved. Healthcare providers are increasingly adopting digital biomarkers, with more than 400 million patients projected to have their health data monitored through digital biomarkers by 2030, enabling better global chronic disease management and preventive care.
By Distribution Channel, Direct Sales Dominate While Online Platforms Grow Fastest:
Distribution is dominated by direct sales as biopharma and device companies prefer to partner directly with CROs, hospitals, or payers. This keeps the customization of deploying and integrating compliance. Online is growing fastest but that’s helped by the move to cloud delivery and digital telemetry. Biomarker Software Market 45% of digital biomarkers will be deployed via cloud by 2029 Digital biomarkers are becoming more widely available to patients and healthcare professionals around the globe.
Digital Biomarkers Market Regional Analysis:
North America Market Insights:
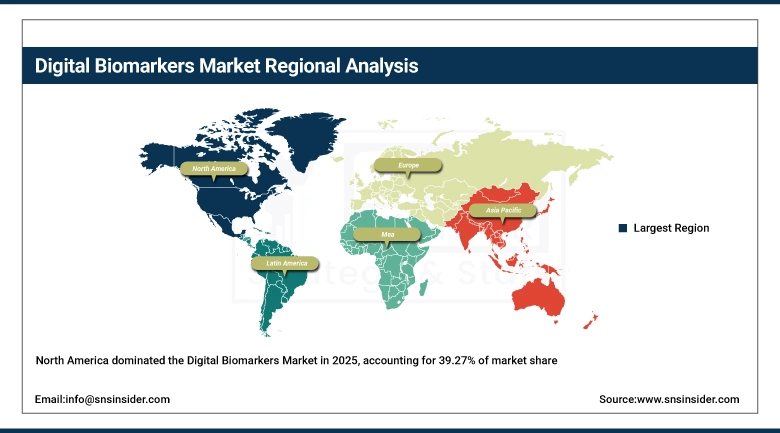
North America dominates the global digital biomarkers market with a 39.27% share in 2025, supported by strong pharma–tech collaborations and advanced healthcare infrastructure. In the US only, there were 32,000 clinical trials as of 2024 with more than 40% including digital endpoints. widespread adoption of wearables, inclusion in decentralized trials and government-led health digitization programmes! driving leadership with sustainable growth by making North America the digital biomarker technology hub.
Get Customized Report as Per Your Business Requirement - Enquiry Now
The United States drives digital biomarker clinical adoption, with 25,000+ active clinical trials in 2024, of which nearly 10,000 trials included digital endpoints. U.S. providers are quickly adapting connective biomarker platforms, with more 500 leading hospitals already integrated wearable monitoring solutions driven by AI. This pharma, medtech and research collaboration ecosystem makes the U.S. a world leader in expediting digital biomarker validation and large-scale healthcare transformation.
Asia-Pacific Market Insights:
The Asia-Pacific digital biomarkers market is expected to grow at a CAGR of 21.07%, thus making it the fastest-growing region globally. The active usage of wearables and smartphone health monitoring is expected to surpass 150 million in China, India, Japan, and South Korea by 2027. The high demand from the increasing digitalization of healthcare, government-backed preventive healthcare initiatives, and rapid adoption of AI platforms are factors that are propelling growth, and the availability of low-cost solutions is further aiding adoption in developing nations.
China Market Insights:
China leads the Asia-Pacific digital biomarkers market, with over 65 million users expected by 2027. Supported by campaign “Healthy China 2030”, over 40,000 hospitals will be running AI-based platforms. Amassing over 500 active clinical trials, China is quickly adopting digital biomarkers in their chronic disease treatment landscape, leading regional dominance.
Europe Market Insights:
Europe is a leading hub for digital biomarkers, with more than 70 million individuals expected to use wearable or app-based biomarker solutions by 2027. Market Growth Leadership paving the way to adoption Germany, France and UK are leading the pack with 7.5k+ accredited digital health centers and strong EU-funded R&D projects. Widespread adoption of AI-powered biomarkers in any chronic disease monitoring and preventive care across the continent would affect over 85% of Europeans served by publicly funded care.
Germany Market Insights:
Germany dominates Europe’s digital biomarkers market, with over 20 million users projected by 2027. Germany hosts over 2,000 certified digital health centres and is a front-runner in EU-funded AI healthcare initiatives. DiGA-approved digital therapeutics and robust reimbursement provide the government’s strong support to rank it as Europe’s leading biomarker hotspot.
Latin America Market Insights:
The Latin American digital biomarkers market is expanding steadily, with over 25 million wearable and mobile health users projected by 2027 across Brazil, Mexico, and Argentina. Brazil is taking the lead with nearly 60% of regional revenue, and over 3,500 digital health centers. The onset of government-supported telehealth programs and increased private investment in AI-based platforms are propelling the adoption of biomarker for chronic disease monitoring as well as prevention.
Middle East and Africa Market Insights:
The Middle East & Africa digital biomarkers market is growing, with over 15 million users projected by 2027. Saudi Arabia is in front with adoption, backed by 1,200+ smart hospitals implementing AI biomarker platforms; but growth will be convened to yet other public health care expansion in South Africa.
Competitive Landscape:
Apple Inc. is a significant participant in the Digital Biomarkers Market with its Apple Watch and Health platform, which offers continuous physiological and behavioral information such as heart rate, mobility, sleep, and ECG. Digital biomarkers are used for early disease detection, chronic disease management, and large-scale clinical research studies
-
In Sept 2025, Apple Watch got FDA approval for a hypertension detection feature, which was launched globally for Series 9, 10, 11, and Ultra models.
Alphabet leads with Verily, Fitbit, and Google Fit, with a basis of 100 million+ Fitbit users worldwide. Project Baseline and Study Watch have already accumulated over 500 million biomarker hours, advancing the future of precision medicine. Partnerships with Novartis, Pfizer, and Dexcom involve glucose, cardiovascular, and behavioral monitoring. Supported by Google Cloud AI, Alphabet facilitates safe scaling demonstrated as the world’s best platform for digital biomarker R&D, endpoints, and scale.
-
In Aug 2025, Verily introduced its Numetric Watch, allowing real-time multi-language biomarker data entry for clinical trials among various patient groups.
Microsoft is a dominant force with Azure Health Cloud supporting 3,000+ healthcare organizations worldwide. Its FDA-cleared AI software allows validated biomarkers in neurology and cardiology clinical studies. Biomarker-driven therapies have moved forward with strategic joint ventures with Novartis and Adaptive Biotechnologies; Azure Analytics is used by 95% of Fortune 500 healthcare companies. With unrivaled worldwide infrastructure, Microsoft provides compliance, security and scale to establish its leading position in digital biomarkers throughout pharma, payers and academic research ecosystems.
-
In July 2025, Microsoft expanded Azure Health AI to support digital biomarkers in over 500 clinical trials, enhancing neurology and cardiology endpoints.
Digital Biomarkers Market Companies
-
Alphabet Inc. (Google Fit, Verily)
-
Fitbit (Google)
-
Medtronic plc
-
Abbott Laboratories
-
Koninklijke Philips N.V.
-
ResMed Inc.
-
AliveCor, Inc.
-
Oura Health Ltd.
-
Withings SA
-
Biofourmis Inc.
-
Evidation Health, Inc.
-
Neurotrack Technologies, Inc.
-
Empatica Inc.
-
Owlet Baby Care Inc.
-
Koneksa Health, Inc.
-
Elekta AB
| Report Attributes | Details |
|---|---|
| Market Size in 2025 | USD 5.84 Billion |
| Market Size by 2035 | USD 35.83 Billion |
| CAGR | CAGR of 19.89% From 2026 to 2035 |
| Base Year | 2025 |
| Forecast Period | 2026-2035 |
| Historical Data | 2022-2024 |
| Report Scope & Coverage | Market Size, Segments Analysis, Competitive Landscape, Regional Analysis, DROC & SWOT Analysis, Forecast Outlook |
| Key Segments | • By Biomarker Type (Physiological, Behavioral, Cognitive, Vocal, Others) • By Application (Neurology, Cardiology, Oncology, Respiratory, Endocrinology, Others) • By Platform (Wearables, Mobile Apps, Biosensors, Digital Platforms, Others) • By Deployment Mode (Cloud-Based, On-Premise, Hybrid) • By End User (Pharmaceutical & Biopharma Companies, Contract Research Organizations (CROs), Healthcare Providers, Payers, Academic & Research Institutes, Patients) • By Distribution Channel (Direct Sales, Distributors, Online Retail, Others) |
| Regional Analysis/Coverage | North America (US, Canada), Europe (Germany, UK, France, Italy, Spain, Russia, Poland, Rest of Europe), Asia Pacific (China, India, Japan, South Korea, Australia, ASEAN Countries, Rest of Asia Pacific), Middle East & Africa (UAE, Saudi Arabia, Qatar, South Africa, Rest of Middle East & Africa), Latin America (Brazil, Argentina, Mexico, Colombia, Rest of Latin America). |
| Company Profiles | Apple Inc., Alphabet Inc. (Google Fit, Verily), Microsoft Corporation, Samsung Electronics Co., Ltd., Fitbit (Google), Garmin Ltd., Medtronic plc, Abbott Laboratories, Koninklijke Philips N.V., ResMed Inc., AliveCor, Inc., Oura Health Ltd., Withings SA, Biofourmis Inc., Evidation Health, Inc., Neurotrack Technologies, Inc., Empatica Inc., Owlet Baby Care Inc., Koneksa Health, Inc., Elekta AB. |
Get in Touch
