On-Shelf Availability Solution Market Report Scope & Overview:
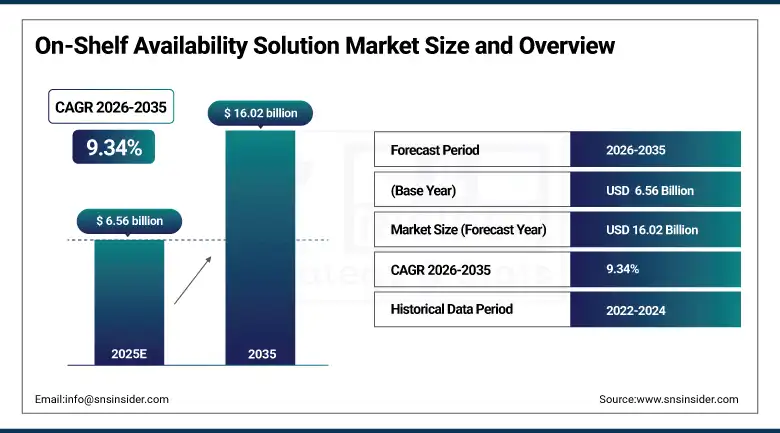
The On-Shelf Availability Solution Market size is estimated at USD 6.56 billion in 2025 and is expected to reach USD 16.02 billion by 2035, growing at a CAGR of 9.34% over the forecast period of 2026–2035.
The global on-shelf availability solution market trend is a growing demand for retail intelligence platforms such as out-of-stock detection systems, inventory management solutions, and real-time shelf monitoring technologies. The growth of the market is driven by increasing retailer pressure to eliminate stockout-related revenue losses, rising adoption of AI-powered demand forecasting tools, and consumer expectations for consistent product availability across physical and digital store formats. This trend is also driven by a growing integration of IoT shelf sensors and computer vision platforms and the growing focus on retail execution accountability as CPG manufacturers become more invested in sell-through performance and are more willing to deploy digital tools that provide granular, store-level shelf intelligence, resulting in growth in the domestic and international market for SaaS-based and on-premises on-shelf availability solutions.
For instance, in February 2024, accelerating investments in retail automation and shelf intelligence infrastructure drove a 24% increase in on-shelf availability platform deployments among top grocery and hypermarket chains in North America, improving stock replenishment cycle times and reducing out-of-stock incidents across store networks.
On-Shelf Availability Solution Market Size and Forecast:
-
Market Size in 2025: USD 6.56 billion
-
Market Size by 2035: USD 16.02 billion
-
CAGR: 9.34% from 2026 to 2035
-
Base Year: 2025
-
Forecast Period: 2026–2035
-
Historical Data: 2022–2024
To Get more information On On-Shelf Availability Solution Market - Request Free Sample Report
On-Shelf Availability Solution Market Trends
-
On-shelf availability platforms are being adopted because retailers and CPG manufacturers demand real-time visibility into product gaps, replenishment lag, and planogram compliance at the individual store and SKU level.
-
Customized shelf replenishment workflows built on historical demand signals, seasonal velocity data, and product category patterns to reduce stockout frequency and improve fill rates across high-turnover retail formats.
-
The development of AI-powered image recognition tools, autonomous shelf-scanning robots, and RFID-integrated inventory systems to improve the speed and accuracy of out-of-stock detection and reduce reliance on manual store audits.
-
Integrated supplier portals, real-time vendor scorecards, and automated replenishment alerts are being deployed to improve upstream accountability and ensure faster response to shelf availability gaps at store level.
-
Increased demand for cloud-native SaaS platforms, mobile retail execution applications, and self-service analytics dashboards to expand accessibility of shelf intelligence tools across mid-market and independent retail operators.
-
Collaboration between retail technology vendors, ERP solution providers, and third-party logistics firms to develop end-to-end on-shelf availability ecosystems that connect store floor, distribution center, and supplier operations under a single data layer.
-
GS1 standards compliance, GDPR and CCPA data governance requirements, and ESG-linked product traceability mandates are pushing retailers and CPG companies to adopt shelf availability platforms that support auditability and sustainability reporting.
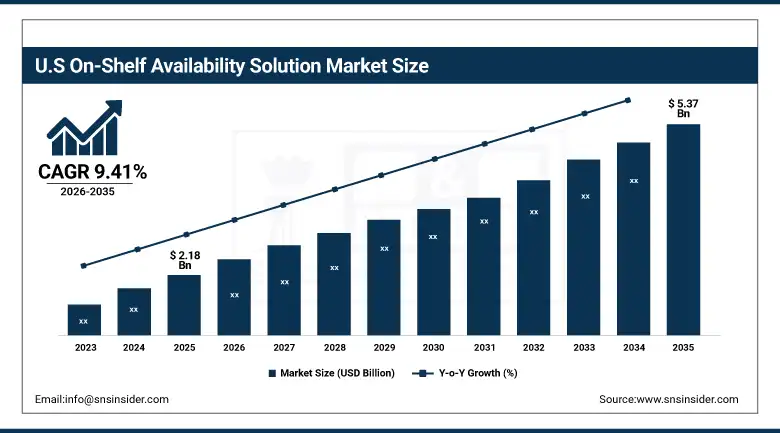
The U.S. On-Shelf Availability Solution Market is estimated at USD 2.18 billion in 2025 and is expected to reach USD 5.37 billion by 2035, growing at a CAGR of 9.41% from 2026–2035. The United States represents the largest market for on-shelf availability solutions, primarily driven by the mandatory integration of inventory tracking standards across major retail chains, widespread ERP and WMS adoption, and a mature retail IT infrastructure that supports real-time shelf data exchange between manufacturers and store operators. High concentration of Fortune 500 CPG companies and national grocery chains, combined with growing investment in omnichannel fulfillment and store-level digitization, continue to fuel market expansion. Also, the U.S. is the largest regional market in the world, due to the regulatory push for supply chain transparency and the rapid uptake of retail analytics solutions.
On-Shelf Availability Solution Market Growth Drivers:
-
Rising Stockout-Driven Revenue Losses and Retailer Accountability Demands are Driving the On-Shelf Availability Solution Market Growth
Rising stockout-driven revenue losses and retailer accountability demands take the center stage as a growth driver for the on-shelf availability solution market share, and are driven by the growing implementation of real-time replenishment triggers, AI-powered demand sensing models, and vendor-managed inventory agreements that treat shelf availability as a measurable commercial KPI across grocery, FMCG, and specialty retail categories. These retail digitization initiatives are expanding the addressable base of the market, accelerating penetration of cloud-based and SaaS deployment models, and contributing to measurable increases in overall on-shelf availability solution market share globally.
For instance, in July 2024, AI-integrated on-shelf availability and inventory intelligence platforms accounted for ~61% of total retail technology spending among leading grocery and hypermarket chains in North America, reflecting the industry-wide shift toward proactive shelf management and automated replenishment workflows.
On-Shelf Availability Solution Market Restraints:
-
High Implementation Complexity and Legacy System Integration Barriers are Hampering the On-Shelf Availability Solution Market Growth
High implementation complexity and legacy system integration barriers of on-shelf availability platforms also restrict the on-shelf availability solution market growth, as a significant portion of mid-sized retailers and regional CPG suppliers operate on aging ERP, POS, and warehouse management systems that lack the API flexibility needed for seamless data exchange with modern shelf intelligence tools. This results in extended deployment timelines, elevated total cost of ownership, and inconsistent inventory data quality that reduces forecast accuracy and replenishment efficiency. As a result, adoption rates remain suppressed in markets where IT modernization budgets are constrained and in-store digital transformation programs are still in early stages.
On-Shelf Availability Solution Market Opportunities:
-
Computer Vision Integration and Autonomous Shelf-Scanning Technologies Drive Future Growth Opportunities for the On-Shelf Availability Solution Market
The opportunity in the computer vision integration and autonomous shelf-scanning technologies in on-shelf availability solution market is in the form of real-time planogram compliance monitoring, shelf gap detection without manual store audits, and SKU-level vendor accountability reporting. These solutions provide for early identification of out-of-stock conditions, automated replenishment alerts to store associates and upstream suppliers, and granular shelf performance benchmarking by category, store format, and geography. Through enhanced store operations efficiency, supply chain response time, and data-driven retail execution—particularly in high-velocity categories such as fresh produce, FMCG, and over-the-counter pharmaceuticals—these technologies may improve on-shelf fill rates, reduce shrinkage, and expand the overall addressable market for supply chain management solutions.
For instance, in May 2024, the Food Marketing Institute reported that 68% of U.S. grocery retailers had initiated or expanded deployments of AI-driven shelf analytics and on-shelf availability platforms, citing measurable reductions in out-of-stock rates and meaningful gains in store-level replenishment efficiency.
On-Shelf Availability Solution Market Segmentation Analysis
-
By component, software held the largest share of around 62.47% in 2025, and the service segment is expected to register consistent growth with a CAGR of 9.11% during the forecast period.
-
By deployment, the SaaS segment dominated the market with approximately 57.38% share in 2025, while the on-premises segment is expected to maintain a steady base among enterprise-scale retailers and CPG manufacturers with proprietary IT governance requirements.
-
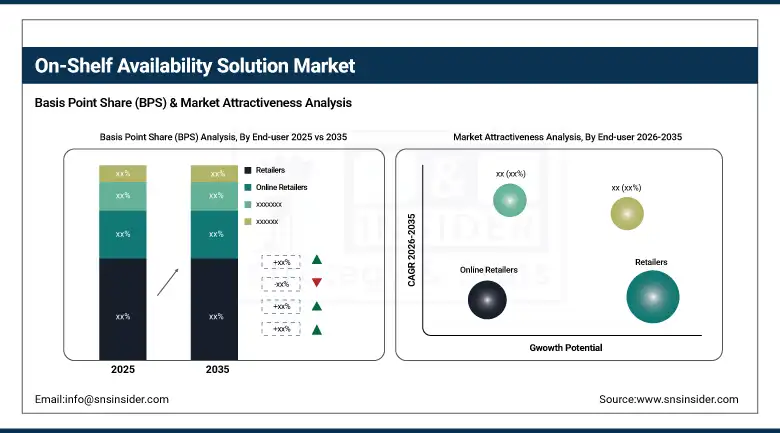
By end user, retailers accounted for the leading share of nearly 38.62% in 2025, and CPG manufacturers are expected to register the highest growth with a CAGR of 10.23% as brand owners take greater ownership of retail execution analytics and sell-through performance monitoring.
By Component, Software Leads the Market, While Service Registers Steady Growth
The software segment accounted for the highest revenue share of approximately 62.47% in 2025, owing to widespread adoption of SaaS-based shelf intelligence dashboards, AI-powered out-of-stock detection modules, and integrated demand forecasting tools that deliver real-time product visibility at the SKU and store level. Emerging trends, including the embedding of computer vision APIs within planogram compliance workflows and the proliferation of mobile retail execution applications for field sales teams. In comparison, the service segment is anticipated to maintain consistent growth throughout the 2026–2035 period, driven by the growing demand for implementation consulting, data integration services, and managed analytics engagements that help retailers and CPG companies extract operational value from deployed shelf availability platforms. Drivers include rising need for ongoing platform customization, cross-system data harmonization, and training support as organizations scale deployments across multi-store and multi-region networks.
By Deployment, SaaS Segment Dominates, while the On-Premises Segment Serves Enterprise Demand
By 2025, the SaaS segment contributed the largest revenue share of 57.38% due to its rapid deployment capability, subscription-based cost model, and the ability to push continuous platform updates without burdening internal retail IT teams. Growing adoption of cloud-native architectures among large-format grocery chains and mid-market retailers, coupled with the scalability required to support real-time shelf data ingestion across hundreds of store locations, is further entrenching SaaS as the preferred delivery model. The on-premises segment retains relevance among enterprise CPG manufacturers and major retail operators with strict data residency policies, proprietary ERP ecosystems, and supply chain compliance requirements that demand localized data infrastructure and tighter integration with internal warehouse and merchandising systems.
By End User, Retailers Lead, and CPG Manufacturers Register Fastest Growth
The retailers accounted for the largest share of the on-shelf availability solution market with about 38.62%, owing to their direct responsibility for maintaining shelf standards, their exposure to out-of-stock-driven revenue loss, and their ongoing investment in store intelligence infrastructure to remain competitive across both physical and online retail formats. Reasons driving the retailer segment include rising consumer intolerance for stockouts, growing pressure from CPG brand owners on shelf compliance, and the need for SKU-level replenishment automation at scale. In addition, CPG manufacturers are slated to grow at the fastest rate with a CAGR of around 10.23% throughout the forecast period of 2026–2035, as brand owners increasingly deploy sell-through analytics, retail execution platforms, and vendor scorecard tools to monitor product availability without relying solely on retailer-reported data. Increased focus on category management and promotional compliance contributes to their accelerating adoption, while demonstrated ROI from reduced stockout rates and improved distribution efficiency drives continued investment.
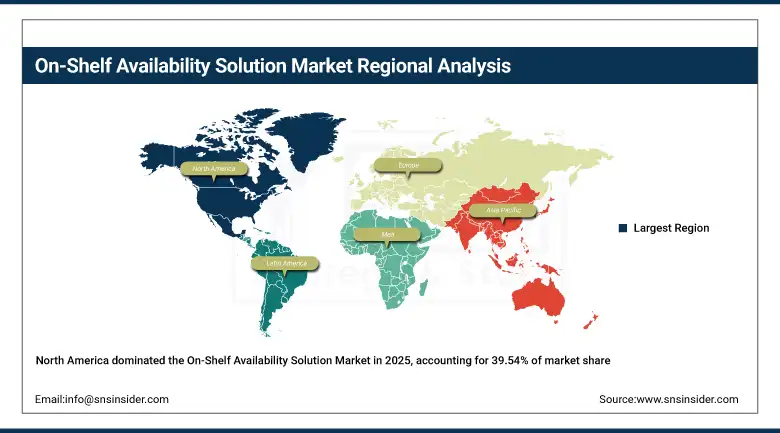
On-Shelf Availability Solution Market Regional Highlights:
North America On-Shelf Availability Solution Market Insights:
North America held the largest revenue share of over 39.54% in 2025 of the on-shelf availability solution market due to an advanced retail IT ecosystem, industry-wide adoption of ERP and WMS platforms with inventory data integration, and a highly competitive CPG and grocery landscape where shelf availability is measured as a core commercial performance metric. Drivers include near-universal barcode and RFID tracking across major retail chains, an improved broadband and edge computing infrastructure enabling real-time shelf analytics, growing consumer brand-switching behavior that makes stockout tolerance extremely low, and greater acceptance of automated replenishment tools stemming from lessons learned during pandemic-era supply chain disruptions. At the same time, continued government emphasis on supply chain resilience, meaningful use of predictive analytics across retail operations, and sustained investment in shelf intelligence technology from both retailers and CPG manufacturers are anchoring on-shelf availability platform revenues and ensuring sustained growth across software and service segments.
Get Customized Report as per Your Business Requirement - Enquiry Now
Asia Pacific On-Shelf Availability Solution Market Insights:
Asia Pacific is the fastest-growing segment in the on-shelf availability solution market with a CAGR of 11.27%, as rapid expansion of organized retail and modern trade networks, government investment in supply chain digitization, and growing smartphone-led commerce adoption across developing economies are accelerating platform uptake. Factors including the large-scale construction of e-commerce fulfillment centers, a rising middle-class consumer base with increasing packaged goods spending, and growing adoption of mobile retail execution applications are stimulating the market growth. AI-powered shelf monitoring tools and SaaS-based inventory analytics platforms have been instrumental in improving out-of-stock detection and replenishment response times, especially across geographically dispersed store networks in China, India, and Southeast Asia. Public-private partnerships and national digitization programs also help in advancing supply chain transparency and last-mile shelf management. Increase in demand in the Asia Pacific region owing to rising retail IT expenditure against historically low per-capita investment levels and growing affordability and accessibility of cloud-based on-shelf availability tools.
Europe On-Shelf Availability Solution Market Insights:
The on-shelf availability solution market in Europe is the second-dominating region after North America on account of an increase in the adoption of retail execution software, robust GDPR-driven data governance frameworks, and growing retailer and CPG manufacturer emphasis on reducing out-of-stock rates as a key in-store performance benchmark. Rising implementation of pan-European product traceability networks, national retail digitization strategies, favorable EU funding for supply chain innovation, and cross-border trade compliance directives are also contributing to sustained growth of the market in leading European markets including Germany, the UK, France, and the Netherlands.
Latin America (LATAM) and Middle East & Africa (MEA) On-Shelf Availability Solution Market Insights:
In Latin America, and Middle East & Africa, the growing expansion of modern trade retail formats, increasing internet and mobile device penetration, and rising retailer awareness of the direct revenue impact from chronic stockout conditions are supporting on-shelf availability solution market growth. The rising adoption of affordable cloud-based shelf analytics tools and multilingual retail execution platforms, along with government-backed programs to digitize FMCG distribution and track product traceability, will aid supply chain efficiency and store-level product availability. The increasing urban consumer population and improving logistics and cold chain infrastructure in these regions are continuing to create new market growth opportunities.
On-Shelf Availability Solution Market Competitive Landscape:
IBM Corporation (est. 1911) is a global technology and AI solutions leader whose Sterling Supply Chain Suite and Watson-powered analytics platforms are widely deployed by retail enterprises and CPG manufacturers to monitor inventory levels, detect shelf gaps, and automate replenishment workflows at scale. It uses its deep enterprise integration expertise and AI development capabilities to produce advanced on-shelf availability intelligence tools with seamless ERP and WMS connectivity.
-
In January 2025, it expanded its Sterling Inventory Visibility platform with AI-powered shelf gap detection and real-time replenishment alert capabilities, aiming to reduce out-of-stock incidents and improve store-level availability across multi-format retail networks.
SAP SE (est. 1972) is a global enterprise software provider focused on integrated business planning, retail merchandising, and supply chain execution solutions. It invests in cloud-native on-shelf availability modules and demand-sensing capabilities within its S/4HANA Retail suite with the aim of enabling CPG manufacturers and large-format retailers to reduce stockout frequency, improve vendor accountability, and maintain planogram compliance through real-time shelf data exchange.
-
In March 2024, launched an enhanced on-shelf availability module within SAP S/4HANA Retail featuring ML-driven out-of-stock prediction and automated supplier replenishment workflows across North American and European retail networks, enhancing shelf fill rates and reducing manual replenishment intervention.
Oracle Corporation (est. 1977) is a leading provider of cloud ERP and retail management systems whose Oracle Retail platform integrates on-shelf availability monitoring, inventory optimization, and supplier collaboration tools used by grocery chains, mass merchandisers, and specialty retailers across more than 90 countries. The company’s on-shelf availability product portfolio focuses on real-time inventory data accuracy and scalable cloud deployment, and features a strong commitment to GS1 standards compliance and continuous platform innovation to support both ambulatory and large-store retail formats.
-
In August 2024, introduced AI-powered shelf availability analytics and dynamic safety stock optimization features within Oracle Retail Merchandising Cloud Service, improving replenishment accuracy and reducing phantom inventory incidents for large-scale grocery and hypermarket operators.
On-Shelf Availability Solution Market Key Players:
-
IBM Corporation
-
SAP SE
-
Oracle Corporation
-
Honeywell International Inc.
-
Focal Systems Inc.
-
Trax Retail
-
SymphonyAI Retail CPG
-
Shelf Engine
-
Blue Yonder Group, Inc.
-
Relex Solutions
-
Leafio AI
-
Impinj, Inc.
-
Sensormatic Solutions (Johnson Controls)
-
Retail Solutions Inc. (RSi)
-
Crisp (Crisp Vendor Analytics)
-
Scoutbee GmbH
-
StockTrim Limited
-
Toolio Inc.
| Report Attributes | Details |
|---|---|
| Market Size in 2025 | USD 6.56 Billion |
| Market Size by 2035 | USD 16.2 Billion |
| CAGR | CAGR of 9.34% From 2026 to 2035 |
| Base Year | 2025 |
| Forecast Period | 2026-2035 |
| Historical Data | 2022-2024 |
| Report Scope & Coverage | Market Size, Segments Analysis, Competitive Landscape, Regional Analysis, DROC & SWOT Analysis, Forecast Outlook |
| Key Segments | • By Component (Software, Service) • By Application (Historical Data Analysis, Response Time Analysis, Vendor Pattern Analysis, Potential Risk Analysis) • By Deployment (On-premises, SaaS) • By End-user (CPG Manufacturers, Retailers, Online Retailers, Suppliers, Warehouses) |
| Regional Analysis/Coverage | North America (US, Canada, Mexico), Europe (Germany, France, UK, Italy, Spain, Poland, Turkey, Rest of Europe), Asia Pacific (China, India, Japan, South Korea, Singapore, Australia, Rest of Asia Pacific), Middle East & Africa (UAE, Saudi Arabia, Qatar, South Africa, Rest of Middle East & Africa), Latin America (Brazil, Argentina, Rest of Latin America) |
| Company Profiles | IBM, SAP SE, Oracle Corporation, Zebra Technologies Corporation, Honeywell International Inc., Focal Systems Inc., Trax Retail, SymphonyAI Retail CPG, Shelf Engine, Blue Yonder Group, Inc., Relex Solutions, Leafio AI, Impinj, Inc., Sensormatic Solutions (Johnson Controls), Retail Solutions Inc. (RSi), Wiser Solutions, Inc., Crisp (Crisp Vendor Analytics), Scoutbee GmbH, StockTrim Limited, Toolio Inc, and Others |
Frequently Asked Questions
North America region dominated the On-shelf Availability Solution Market with 39.54% of revenue share in 2025.
The Software segment dominated the on-shelf availability solution market in 2025 and accounted for 62.47% of revenue share.
Increased Need to Reduce Stockouts and Improve Customer Satisfaction Drives Adoption of Real-Time Shelf Monitoring Technologies.
The on-shelf availability solution market size was valued at USD 6.56 billion in 2025 and is expected to reach USD 16.02 billion by 2035.
The expected CAGR of the On-shelf Availability Solution Market over 2026-2035 is 9.34%.
Get in Touch
