Copper Scrap Market Report Scope & Overview:
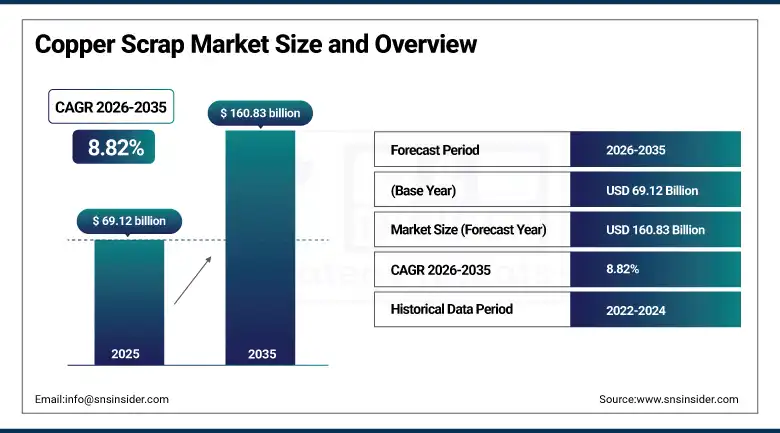
The Copper Scrap market was valued at USD 69.12 billion in 2025 and is expected to reach USD 160.83 billion by 2035, growing at a CAGR of 8.82% from 2026–2035.
The market's structural growth is being reinforced by two simultaneous demand pressures whose combined force exceeds anything in the copper industry's recent history: the electrification megatrend encompassing electric vehicle powertrains, charging infrastructure, grid modernisation, and renewable energy generation and storage systems that requires copper at volumes and growth rates that primary mining alone cannot sustainably supply, and the regulatory intensification of extended producer responsibility, circular economy legislation, and carbon border adjustment mechanisms across the European Union, United States, and major Asian economies that are progressively forcing industrial copper consumers to incorporate recycled content targets into their supply chain strategies. Approximately 30% of the world's copper demand is currently met by recycled copper, a share that policy frameworks and sustainability commitments are driving steadily higher across the forecast period.
The International Copper Study Group's October 2025 assessment that slower primary production growth has shifted the refined copper market toward a supply deficit beginning in 2026 directly enhances the strategic and commercial value of copper scrap as a critical secondary supply source for manufacturers whose production requirements cannot be fully met from primary copper sources at current price levels.
Copper Scrap Market Size and Forecast
-
Market Size in 2026E: USD 75.22 Billion
-
Market Size by 2035: USD 160.83 Billion
-
CAGR: 8.82% from 2026 to 2035
-
Fastest Growing Region: Asia Pacific
-
Largest Region: Asia Pacific
To Get more information On Copper Scrap Market - Request Free Sample Report
Copper Scrap Market Trends
-
Accelerating electric vehicle production driving unprecedented demand for high-quality copper scrap as automotive manufacturers seek to incorporate recycled content into EV motors, wiring harnesses, and charging components to meet supply chain sustainability targets and reduce exposure to primary copper price volatility.
-
Growing investment in advanced sorting and processing technology including automated spectroscopic analysis, sensor-based sorting, and AI-powered material classification that enable copper scrap processors to extract higher-purity copper streams from increasingly complex mixed scrap feedstocks containing challenging contaminants from electronic waste and end-of-life vehicles.
-
Rising policy pressure across the European Union, United Kingdom, and United States for minimum recycled content requirements in copper-intensive manufactured goods including electrical cables, building products, and automotive components, creating compliance-driven procurement demand for certified recycled copper that commands premium pricing above commodity scrap grades.
-
Expanding electronic waste recycling capacity as the global e-waste stream grows with consumer electronics replacement cycles, creating an increasingly significant source of high-grade copper recovery from printed circuit boards, power supplies, and cables that complement traditional construction and industrial scrap sources.
-
Growing strategic concern among copper-importing nations about primary copper supply concentration in geopolitically sensitive mining jurisdictions motivating domestic recycling infrastructure investment as a supply security measure, with the United States, European Union, and Japan all articulating secondary metals recycling as a component of critical mineral supply chain resilience strategies.
U.S. Copper Scrap Market Outlook
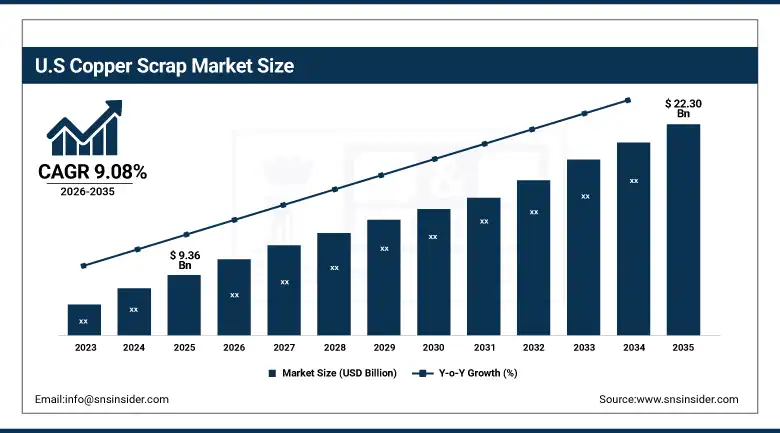
The U.S. Copper Scrap Market was valued at approximately USD 9.36 billion in 2025 and is expected to reach approximately USD 22.30 billion by 2035, growing at a CAGR of 9.08%, driven by the world's largest industrial copper scrap generation volumes, advanced recycling infrastructure operating at 84 to 89% capacity utilisation, strong demand from domestic wire rod mills, brass mills, and foundries, and increasing policy support for circular metals economy development.
The United States is the world's largest generator of recoverable copper scrap and maintains one of the most developed secondary copper processing industries globally, anchored by major recyclers including OmniSource, SA Recycling, Schnitzer Steel (now Radius Recycling), and the newly commissioned Aurubis Richmond facility that adds 180,000 metric tons of annual complex scrap processing capacity to North America's secondary copper infrastructure. The U.S. copper scrap market benefits from extensive industrial infrastructure that generates consistent new scrap supply from manufacturing operations, construction activity, and end-of-life electrical infrastructure decommissioning, as well as from a well-developed collection network reaching residential, commercial, and industrial scrap generators across the country's geographic span. In July 2025, the U.S. government announced quotas requiring 25% of high-quality copper scrap to be sold domestically rather than exported, reflecting the strategic prioritisation of copper as a critical material for domestic manufacturing competitiveness in electric vehicles, grid modernisation, and defence electronics production.
The U.S. Inflation Reduction Act's domestic content requirements for electric vehicle tax credits and clean energy investment incentives are creating powerful supply chain incentives for American EV and energy equipment manufacturers to source recycled copper from domestic secondary processors rather than importing refined copper from overseas, directly benefiting domestic copper scrap recyclers who can supply verified domestically-sourced recycled content.
Copper Scrap Market Segment Analysis
-
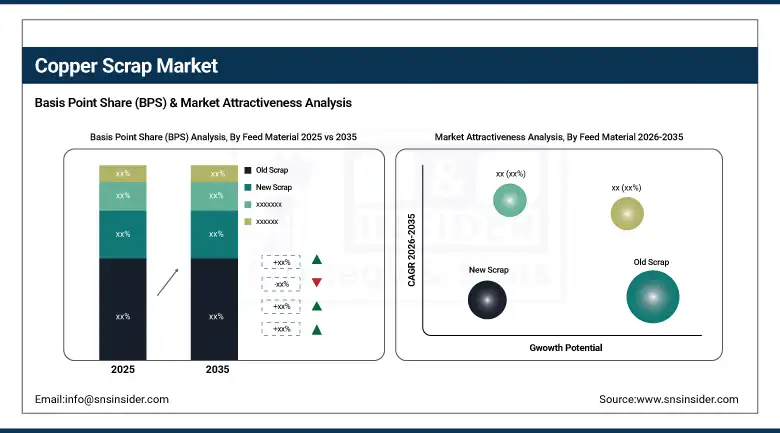
By Feed Material, Old Scrap accounted for a large portion of the market in 2025 based on the constant availability of the material sourced from dismantled decommissioned infrastructures, scrapped automobiles, electrical wiring, and consumer electronics; whereas New Scrap is expected to witness the highest growth rate based on the rise in demand for process scrap from manufacturing processes using sustainable practices.
-
By Copper Grade, Copper Grade #2 dominated the market in terms of market share in 2025 due to its widespread availability from demolition waste, plumbing fixtures, and electrical fittings, even though more processing was needed; meanwhile, Bare Bright Copper emerged as the fast growing grade due to demand for high purity metal from wire rod mills.
-
By End User Application, Wire Rod Mills accounted for the largest end user due to the massive and rising demand for the use of wires and cables for various electric applications; Ingot Makers represent the fast growing application segment due to the rising demand for copper alloys from foundries for various industrial uses.
-
By End User, Electrical & Electronics held the largest share in 2025 through copper's irreplaceable role in power cables, transformers, circuit boards, and consumer devices that collectively represent the largest industrial copper consumption category; Building & Construction is a major and sustained consumer through copper's widespread use in wiring, plumbing, roofing, and architectural applications across the construction sector.
By Feed Material, Old Scrap dominates, New Scrap is expected to grow fastest
Old Scrap retained the dominant feed material position in the Copper Scrap Market in 2025, reflecting the cumulative historical copper inventory embodied in the global stock of electrical infrastructure, building components, transportation equipment, and consumer products reaching end of life after decades of service, which collectively constitute the world's largest and most geographically distributed copper reservoir available for secondary recovery. Old scrap encompasses the full range of post-consumer and post-industrial materials including demolition cable from infrastructure upgrades, automotive wiring harnesses from end-of-life vehicle processing, plumbing pipe from building renovations, radiators from HVAC equipment decommissioning, and circuit boards from electronic waste streams. The predictable and sustained generation of old scrap from the retirement of copper-containing infrastructure built over the past several decades creates a structurally reliable feedstock supply that underpins the operational planning of secondary copper smelters and processors across all major markets.
New Scrap is the fastest-growing feed material segment as the transition of manufacturing supply chains toward circular economy principles drives investment in closed-loop scrap collection systems that capture process scrap generated within manufacturing operations, including cutting offcuts from copper tube fabrication, wire drawing waste, and punchings from electrical connector manufacturing, and return these high-purity materials directly to copper processing facilities without entering the open market collection system. The purity advantage of new scrap over old scrap, where new scrap typically contains minimal contamination from surface coatings, alloy mixing, or foreign materials, commands processing cost advantages and price premiums that incentivise manufacturers to formalise new scrap recovery programmes rather than treating manufacturing process waste as a commodity sold at prevailing spot prices.
By Application, Wire Rod Mills dominate, Ingot Makers are expected to grow fastest
Wire Rod Mills retained the dominant application position in the Copper Scrap Market in 2025, reflecting the copper wire and cable industry's position as the single largest consumer of refined and secondary copper globally, where the relentless growth of power grid infrastructure, telecommunications networks, electric vehicle charging systems, and building electrical systems creates sustained and expanding demand for the copper wire rod that forms the primary input of cable manufacturing operations. Wire rod mills process copper scrap alongside primary cathode to produce eight-millimetre copper rod that cable and wire manufacturers draw down to the precise gauges required for each application, and the large-scale, continuous process nature of wire rod mill operations creates strong incentives to source reliable, consistent scrap feedstocks that meet the compositional specifications required for high-conductivity electrical applications. The electrification megatrend driving grid expansion and EV infrastructure deployment is creating the most concentrated demand growth in the wire rod mill segment's recent history.
Ingot Makers are the fastest-growing application as the expanding market for copper alloy products including brass and bronze fittings, bearings, bushings, electrical connectors, and plumbing components creates increasing foundry demand for secondary copper feedstock that can be alloyed with zinc, tin, and other metals to produce specification-grade ingots for downstream foundry and die-casting operations. The automotive sector's transition toward electric drivetrains and sophisticated electronics architectures is simultaneously reducing copper scrap supply from conventional powertrain components while increasing demand for copper alloy components in EV charging connectors, power electronics cooling systems, and structural components where copper's thermal and electrical properties provide application-specific performance advantages.
Regional Analysis
|
Region |
Major Country |
Share within Region, 2025 (%) |
|---|---|---|
|
North America |
United States |
84.2% |
|
Europe |
Germany |
23.8% |
|
Asia Pacific |
China |
68.4% |
|
Middle East & Africa |
UAE |
27.3% |
|
Latin America |
Chile |
38.6% |
North America Copper Scrap Market Insights
North America demonstrated a strong position in the Copper Scrap Market in 2025 with the United States accounting for approximately 84.2% of North American revenues. The region's market strength reflects its advanced recycling infrastructure including major processing facilities from Aurubis, OmniSource, Radius Recycling, and SA Recycling operating at high capacity utilisation rates of 84 to 89%, a well-developed industrial scrap generation base from manufacturing, construction, and infrastructure decommissioning activities, and the strategic policy environment that is creating new incentives for domestic secondary copper processing through IRA domestic content requirements and proposed high-quality scrap export quotas. Canada and Mexico contribute additional North American scrap supply and processing capacity, with Glencore's Horne Smelter in Quebec representing a significant complex scrap processing capability that processes secondary materials including cable scrap, electronic waste, and other copper-bearing secondary feedstocks.
Europe Copper Scrap Market Insights
Europe is a major and strategically sophisticated copper scrap market anchored by Aurubis AG's integrated recycling and refining operations across Germany, Belgium, and the new U.S. facility, along with Umicore's complex materials recycling operations, and major national copper scrap processors across Germany, the UK, France, Italy, and the Nordic countries. Germany accounts for approximately 23.8% of European copper scrap revenues as the region's largest manufacturing economy with substantial copper usage in automotive, electrical equipment, and industrial machinery production that generates significant new scrap flows. The European Commission's Circular Economy Action Plan and its proposed Critical Raw Materials Act create regulatory drivers for copper scrap recycling investment and domestic processing capacity expansion that are reshaping the European secondary copper industry toward higher self-sufficiency relative to the historical pattern of significant copper scrap export to Asian processors.
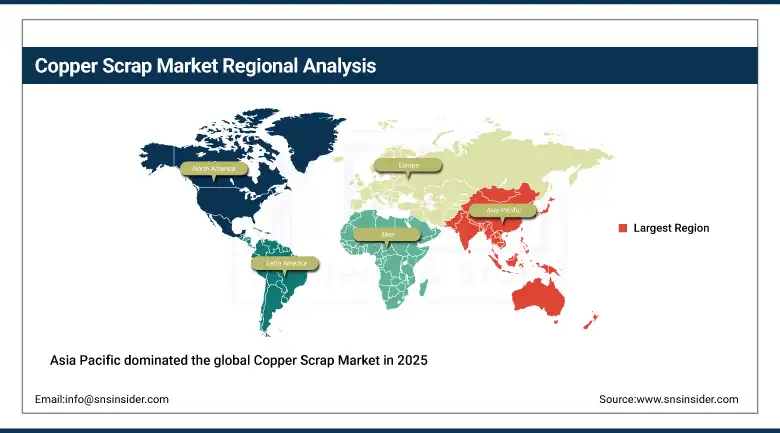
Asia Pacific Copper Scrap Market Insights
Asia Pacific dominated the global Copper Scrap Market in 2025 with approximately 59% of revenues, anchored by China's position as the world's largest copper consumer and the leading importer of copper scrap from North America, Europe, and the rest of the world to supplement its domestic scrap collection. China accounts for approximately 68.4% of Asia Pacific copper scrap revenues, reflecting the extraordinary scale of the country's copper processing industry where secondary smelters and refiners process imported and domestically collected scrap alongside primary concentrates to serve the cable, construction, electronics, and transportation industries that collectively represent the world's most concentrated copper demand base. Japan and South Korea are the region's other major copper scrap markets, where sophisticated industrial recycling systems and strong precious metal recovery economics from electronic waste processing create high-value secondary copper streams alongside conventional ferrous and non-ferrous scrap collection.
Get Customized Report as per Your Business Requirement - Enquiry Now
MEA & Latin America Copper Scrap Market Insights
The Middle East and Africa and Latin America represent growing copper scrap markets with distinct structural characteristics. Latin America is both a significant copper producing and increasingly a copper scrap generating region, with Chile accounting for approximately 38.6% of Latin American copper scrap revenues through its combination of a major mining sector generating copper processing by-products, a growing manufacturing base that generates new scrap, and an expanding collection infrastructure for post-consumer copper scrap from the construction and electrical sectors. Brazil and Mexico represent the other significant Latin American copper scrap markets where manufacturing sector development and urbanisation-driven construction activity generate growing copper scrap volumes. MEA copper scrap activity is concentrated in the UAE at approximately 27.3% of regional revenues as a significant trading hub for copper scrap transit between Asian and European markets, with Saudi Arabia's industrial development programme creating a growing domestic copper scrap consumption market.
Market Dynamics
Growth Drivers: Electric vehicle and renewable energy infrastructure investment creating unprecedented copper demand that secondary supply is uniquely positioned to supplement, combined with circular economy regulation mandating recycled content integration
The primary structural growth drivers for the Copper Scrap Market are the extraordinary and sustained expansion of copper demand driven by the global energy transition, where the electrification of transportation through EV adoption, the deployment of renewable energy generation and storage infrastructure, and the modernisation of electricity transmission and distribution grids collectively create copper demand growth at rates that primary mining investment cannot satisfy within the timeframes required by national climate commitments and industrial decarbonisation strategies. Each electric vehicle requires approximately 60 to 83 kilograms of copper compared with 23 kilograms in an equivalent internal combustion engine vehicle, while offshore wind turbines require 7 to 8 tonnes of copper per megawatt of installed capacity, creating demand intensity that makes secondary copper from scrap recycling not merely an economic input but a strategic supply necessity. The progressive tightening of circular economy regulation across the European Union's Critical Raw Materials Act, extended producer responsibility legislation in major Asian economies, and the IRA's domestic content incentives in the United States are simultaneously creating compliance-driven demand for certified recycled copper and incentivising new investment in recycling capacity.
Restraints: Copper price volatility creating feedstock cost uncertainty for processors and distorting scrap collection economics, export restriction policies fragmenting global scrap trade flows, and contamination complexity in mixed scrap streams increasing processing cost and technical challenge
A significant restraint on the Copper Scrap Market is the sensitivity of the entire copper scrap value chain to London Metal Exchange copper price movements, where the price spread between scrap grades and refined copper that determines the economics of scrap collection, processing, and refining compresses during periods of rapid primary copper price decline and expands during price escalation, creating cyclical volatility in scrap supply volumes and processor profitability that complicates long-term capacity investment decisions. Export restriction policies, where several major copper scrap generating nations have imposed or are considering export quotas or bans to retain secondary copper feedstock for domestic processing, are fragmenting the previously more globally integrated copper scrap trade flows in ways that create regional supply imbalances and complicate long-term procurement planning for processors dependent on internationally sourced feedstock. The increasing complexity of copper scrap feedstocks as electronic waste becomes a growing share of the secondary copper stream, with circuit boards and other complex electronic components containing copper alongside tin, lead, precious metals, and organic materials that require sophisticated and expensive processing to separate safely and efficiently.
Opportunities: EV battery and motor recycling creating new high-grade copper scrap streams, digitalisation of scrap collection enabling quality assurance and transparency, and strategic partnership between automotive OEMs and scrap processors for closed-loop copper recycling
The developing electric vehicle end-of-life recycling industry is among the foremost new sources of copper scrap development within the forecast period of 2026 to 2035, owing to the fact that first-generation electric cars will be reaching end-of-life in enough numbers to create substantial copper recycling opportunities from the motors, wiring, and power electronics associated with such vehicles. The recycling of copper from EV motors holds special interest, owing to the availability of such copper windings for mechanical removal from the motors in addition to being high-grade copper scrap material of known composition and limited contamination, making it premium-quality scrap material for which automotive OEM-recycling partnerships are emerging. The development of digital traceability systems for tracking copper scrap origin, processing history, and carbon footprint using blockchain technology has facilitated the emergence of premium copper scrap materials whose provenance allows recycled copper to satisfy environmental claims for products using recycled materials.
Recent Developments:
-
April 2025: The copper recycling plant in Richmond, Virginia, of Aurubis AG with capital investment valued at USD 800 million was launched, making it the first major plant in North America to recycle copper scrap, capable of processing 180,000 metric tons of complicated scrap copper, which includes cables, circuit boards, and other e-waste into 70,000 tons of pure copper along with precious metals.
-
December 2024: A Canadian recycler named Cyclic Materials agreed to supply more than 10,000 metric tons of recycled copper to be processed by the smelter owned by Glencore at Horne, Quebec, whereby the refined copper cathodes were supplied for the manufacturing of EV components as well as renewable energy and AI data centre parts, where recycled material certification is necessary.
-
July 2025: An announcement from the United States government indicated that the government mandated the domestic supply of 25% of high-quality copper scrap that should not be exported but left for domestic processing, which shows the strategic importance of secondary copper in domestic EV, grid, and military manufacturing projects.
-
February 2025: The European Copper Institute and major European fabricators formally urged the European Commission to strengthen export controls on copper scrap to protect the region's secondary metals processing industry from competitive disadvantage created by Asian buyers willing to pay export premiums that divert high-quality scrap from European processors.
-
2025: Sims Limited expanded its non-ferrous metal recycling operations across U.S. facilities, investing in advanced sorting and processing technologies to improve copper recovery rates from end-of-life electronics and mixed industrial scrap streams, increasing its capacity to serve domestic wire rod mills and brass mills with domestically processed secondary copper feedstock.
Copper Scrap Market Key Players
-
Ames Copper Group
-
Aurubis AG
-
CMC (Commercial Metals Company)
-
Glencore
-
Global Metals & Iron Inc.
-
JAIN RESOURCE RECYCLING PVT LTD.
-
KGHM METRACO S.A.
-
OmniSource, LLC.
-
Pascha GmbH
-
Perniagaan Logam Panchavarnam Sdn Bhd
-
S.I.C. Recycling, Inc.
-
Boliden
-
Sims Limited (Sims Metal)
-
Umicore
-
Radius Recycling (formerly Schnitzer Steel)
-
Metalico, Inc.
-
Cyclic Materials
-
Kuusakoski Oy
-
European Metal Recycling (EMR)
-
SA Recycling LLC
Copper Scrap Market Report Scope:
| Report Attributes | Details |
|---|---|
| Market Size in 2025 | USD 69.12 Billion |
| Market Size by 2035 | USD 160.83 Billion |
| CAGR | CAGR of 8.82% From 2026 to 2035 |
| Base Year | 2025 |
| Forecast Period | 2026-2035 |
| Historical Data | 2022-2024 |
| Report Scope & Coverage | Market Size, Segments Analysis, Competitive Landscape, Regional Analysis, DROC & SWOT Analysis, Forecast Outlook |
| Key Segments | • By Feed Material (Old Scrap, New Scrap) • By Grade (Bare Bright Copper, Grade #1 Copper, Grade #2 Copper, Light Copper) • By Application (Brass Mills, Wire Rod Mills, Ingot Makers, Others) • By End User (Electrical & Electronics, Building & Construction, Transportation, Industrial Machinery, Others) |
| Regional Analysis/Coverage | North America (US, Canada, Mexico), Europe (Eastern Europe [Poland, Romania, Hungary, Turkey, Rest of Eastern Europe] Western Europe] Germany, France, UK, Italy, Spain, Netherlands, Switzerland, Austria, Rest of Western Europe]), Asia Pacific (China, India, Japan, South Korea, Vietnam, Singapore, Australia, Rest of Asia Pacific), Middle East & Africa (Middle East [UAE, Egypt, Saudi Arabia, Qatar, Rest of Middle East], Africa [Nigeria, South Africa, Rest of Africa], Latin America (Brazil, Argentina, Colombia, Rest of Latin America) |
| Company Profiles | Ames Copper Group, Aurubis AG, CMC (Commercial Metals Company), Glencore, Global Metals & Iron Inc., JAIN RESOURCE RECYCLING PVT LTD., KGHM METRACO S.A., OmniSource, LLC., Pascha GmbH, Perniagaan Logam Panchavarnam Sdn Bhd, S.I.C. Recycling, Inc., Boliden, Sims Limited (Sims Metal), Umicore, Radius Recycling (formerly Schnitzer Steel), Metalico, Inc., Cyclic Materials, Kuusakoski Oy, European Metal Recycling (EMR), SA Recycling LLC |
Frequently Asked Questions
Asia Pacific dominated with approximately 59% of global revenues in 2025.
Old Scrap dominated the Copper Scrap Market in 2025 through its consistent availability from decommissioned infrastructure, end-of-life vehicles, and electronic waste recycling streams.
The electrification megatrend encompassing electric vehicle production, renewable energy infrastructure, and grid modernisation creating unprecedented copper demand that secondary scrap recycling is strategically positioned to supplement, combined with circular economy regulation mandating recycled content integration in copper-intensive products.
The Copper Scrap Market was valued at USD 69.12 billion in 2025.
The Copper Scrap Market is expected to grow at a CAGR of 8.82% from 2026 to 2035.
Get in Touch
