Nitric Acid Market Report Scope & Overview:
Get E-PDF Sample Report on Nitric Acid Market - Request Sample Report
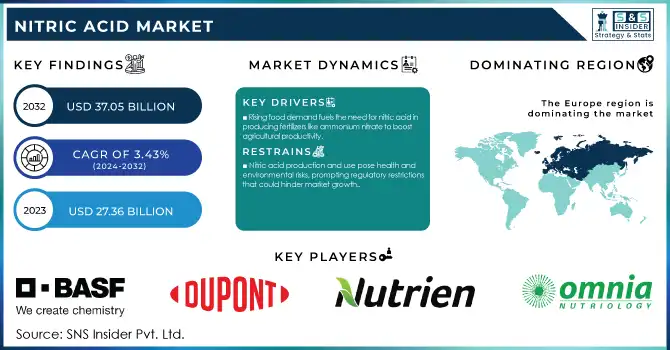
The Nitric Acid Market size was USD 27.36 billion in 2023 and is expected to reach USD 37.05 billion by 2032 and grow at a CAGR of 3.43% over the forecast period of 2024-2032.
The Nitric Acid Market has experienced steady growth, driven by its widespread application in the production of fertilizers, explosives, and various industrial chemicals. Nitric acid is a key component in the manufacturing of ammonium nitrate, a critical ingredient for fertilizers, which has bolstered its demand in agriculture, particularly in developing countries. The increasing need for food production in these regions has directly influenced the demand for fertilizers, and consequently, for nitric acid. Additionally, nitric acid plays a crucial role in the manufacturing of explosives for mining, construction, and defense sectors. As industrialization continues to grow, especially in developing economies, the demand for these products remains robust. Nitric acid is also used in the production of polyurethanes, dyes, and other chemicals, further enhancing its significance in various chemical processes.
One of the key trends driving the market is the growing shift towards more environmentally sustainable production processes. In response to regulatory pressures and environmental concerns, companies are focusing on innovations that reduce emissions and improve energy efficiency in the production of nitric acid. This trend is not only improving operational efficiency but also helping manufacturers align with increasingly stringent environmental regulations. Another notable trend is the increasing adoption of nitric acid in various emerging technologies. This includes applications in electronics and materials sciences, such as the production of semiconductors and other high-performance materials, which require nitric acid for cleaning and etching processes. As these industries evolve, the demand for nitric acid is expected to continue its upward trajectory.
Nitric Acid Market Dynamics
DRIVERS
- The growing demand for nitric acid is driven by its essential role in producing fertilizers like ammonium nitrate, which supports enhanced agricultural productivity to meet the rising global food demand.
The growing demand for nitric acid is largely driven by its use in the production of fertilizers, particularly ammonium nitrate, which is essential for enhancing agricultural productivity. As the global population continues to rise, the demand for food also increases, placing pressure on farmers to improve crop yields. Nitric acid plays a pivotal role in fertilizer production, as it is used to produce nitrogen-based fertilizers that promote plant growth. The need for more efficient and higher crop yields is prompting farmers worldwide to adopt advanced fertilizers, thereby driving market growth. Additionally, agricultural practices in emerging economies are becoming more industrialized, further amplifying the demand for fertilizers. This trend is expected to continue as food security becomes a global priority, creating a sustained demand for nitric acid in fertilizer manufacturing. Consequently, the agricultural sector remains one of the key drivers for the nitric acid market's expansion.
RESTRAINT
- The production and use of nitric acid pose health risks and environmental concerns, including respiratory issues and air pollution, leading to regulatory restrictions that may limit market growth.
The production and use of nitric acid pose significant environmental and health risks. Nitric acid is a highly corrosive substance that, if not handled properly, can cause severe health issues, including respiratory problems, skin burns, and eye damage. The emissions from its production process also contribute to environmental pollution, particularly the release of nitrogen oxides (NOx). These compounds play a key role in air pollution, leading to smog formation and acid rain, which can harm ecosystems, water bodies, and soil quality. Due to these harmful effects, governments have imposed stringent regulations on nitric acid production and use, requiring industries to adopt advanced safety and emission-control measures. These regulations increase operational costs and can limit market growth, especially in regions where environmental laws are becoming stricter. As a result, the nitric acid market faces challenges from both regulatory constraints and the need to mitigate its environmental impact.
Nitric Acid Market Segmentation
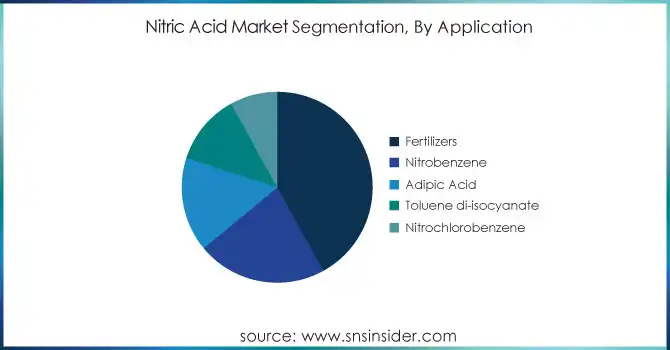
By Application
The fertilizers segment dominated with the market share over 42% in 2023, with Ammonium Nitrate holding the largest share. Its widespread use in agriculture for plant nutrition and its pivotal role in the production of explosives contribute significantly to this dominance. Calcium Ammonium Nitrate, known for its efficient nitrogen-release properties, is another major contributor to this segment, often used in controlled-release fertilizers for improved crop yield. While other fertilizers also play a part, Ammonium Nitrate and Calcium Ammonium Nitrate remain the leading components, driving the growth and stability of the fertilizer segment in the nitric acid market.
Nitric Acid Market Regional Analysis
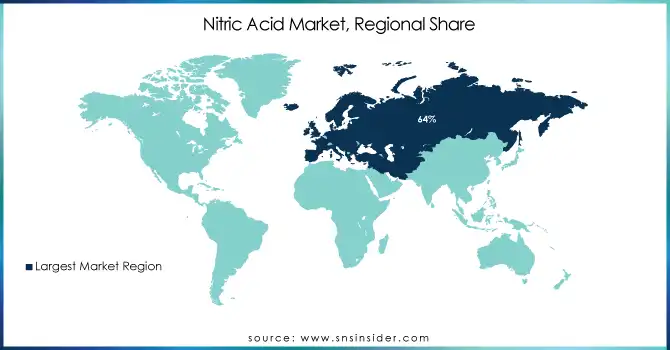
Europe dominated with the market share over 64% in 2023, though it faces significant challenges that have affected its performance. The region grappled with severe shortages, stemming from reduced manufacturing activities, labor shortages during summer holidays, and persistent port congestion. These issues were exacerbated by trade uncertainties and delayed exports, raising import costs and straining the supply chain. Despite these challenges, domestic demand remains variable, largely influenced by adverse weather conditions that have impacted agricultural activities and slower-than-expected demand for downstream products.
Asia-Pacific region is the fastest-growing for Nitric Acid market. While prices remained stable with a slight uptick, demand has risen due to increased export interest from key markets like South America, the Philippines, and South Korea. Additionally, maintenance shutdowns of production plants and growing domestic demand have led to supply constraints, further driving up prices, particularly in China.
Get Customized Report as Per Your Business Requirement - Request For Customized Report
Some of the major key players of the Nitric Acid Market
- BASF SE (Nitric acid for fertilizers, industrial chemicals)
- Dupont (Nitric acid for nylon production, intermediates)
- Nutrien Ltd. (Nitric acid for ammonium nitrate fertilizers)
- Omnia Holdings Limited (Nitric acid for mining explosives, fertilizers)
- Apache Nitrogen Applications Inc. (Nitric acid for explosives, fertilizers)
- CF Industries Holdings, Inc. (Nitric acid for nitrogen-based fertilizers)
- Rashtriya Chemicals & Fertilizers Ltd. (Nitric acid for fertilizers, industrial applications)
- Dyno Nobel (Nitric acid for explosives, industrial applications)
- Sasol (Nitric acid for chemicals, mining explosives)
- Angus Chemical Company (Nitric acid for specialty chemicals)
- Yara International ASA (Nitric acid for fertilizers, industrial solutions)
- Deepak Fertilisers and Petrochemicals Corporation Ltd. (Nitric acid for fertilizers, explosives)
- Grupa Azoty S.A. (Nitric acid for agrochemicals, caprolactam production)
- OCI N.V. (Nitric acid for urea ammonium nitrate fertilizers)
- Thyssenkrupp AG (Nitric acid for industrial processes, fertilizer solutions)
- Orica Limited (Nitric acid for mining explosives)
- LSB Industries, Inc. (Nitric acid for ammonium nitrate, industrial chemicals)
- Haifa Chemicals Ltd. (Nitric acid for specialty fertilizers)
- EuroChem Group AG (Nitric acid for agricultural and industrial uses)
- ChemChina (China National Chemical Corporation) (Nitric acid for various industrial applications)
Suppliers for (high-quality nitric acid for agricultural, including nitrogen fertilizers) steel, of Nitric Acid Market
- BASF SE
- CF Industries Holdings, Inc.
- Nutrien Ltd.
- Omnia Holdings Limited
- Dyno Nobel
- Gujarat State Fertilizers & Chemicals Limited (GSFC)
- Rashtriya Chemicals and Fertilizers Ltd. (RCF)
- Deepak Fertilizers and Petrochemicals Corporation Ltd.
- Yara International ASA
- Linde plc
RECENT DEVELOPMENTS
In January 2024: Saudi Chemical Co. Holding (SCCH), a producer of explosives and detonators, announced that its subsidiary, Saudi Chemical Co. Ltd. (SCCL), had signed a non-binding memorandum of understanding (MoU) with Dyno Nobel to establish a facility in Ras Al Khair. The facility is planned to have an annual production capacity of 440,000 tons of nitric acid and 300,000 tons of ammonium nitrate.
In 2023: CF Industries partnered with CHS Inc., a leading agribusiness cooperative in the U.S., to manufacture and distribute low-carbon nitrogen fertilizer, aiming to reduce measurable and certifiable greenhouse gas (GHG) emissions in agriculture and food systems.
In 2023: Grupa Azoty launched a new facility for concentrated nitric acid production with a designed capacity of 40,000 tons per year, more than tripling its existing capacity. The Tarnow site now operates a second production unit producing nitric acid with a concentration of over 98%.
In 2023: Dorogobuzh commissioned a new 135,000-tons-per-year UKL nitric acid unit at its Smolensk facility. This USD 17 million project was designed by the Acron Engineering Research and Design Centre.
| Report Attributes | Details |
| Market Size in 2023 | USD 27.36 billion |
| Market Size by 2032 | USD 37.05 billion |
| CAGR | CAGR of 3.43% From 2024 to 2032 |
| Base Year | 2023 |
| Forecast Period | 2024-2032 |
| Historical Data | 2020-2022 |
| Report Scope & Coverage | Market Size, Segments Analysis, Competitive Landscape, Regional Analysis, DROC & SWOT Analysis, Forecast Outlook |
| Key Segments | • By Application (Fertilizers (Ammonium Nitrate, Calcium Ammonium Nitrate, Others) Nitrobenzene, Adipic Acid, Toluene di-isocyanate, Nitrochlorobenzene) |
| Regional Analysis/Coverage | North America (US, Canada, Mexico), Europe (Eastern Europe [Poland, Romania, Hungary, Turkey, Rest of Eastern Europe] Western Europe] Germany, France, UK, Italy, Spain, Netherlands, Switzerland, Austria, Rest of Western Europe]), Asia Pacific (China, India, Japan, South Korea, Vietnam, Singapore, Australia, Rest of Asia Pacific), Middle East & Africa (Middle East [UAE, Egypt, Saudi Arabia, Qatar, Rest of Middle East], Africa [Nigeria, South Africa, Rest of Africa], Latin America (Brazil, Argentina, Colombia, Rest of Latin America) |
| Company Profiles | BASF SE, Dupont, Nutrien Ltd., Omnia Holdings Limited, Apache Nitrogen Applications Inc., CF Industries Holdings, Inc., Rashtriya Chemicals & Fertilizers Ltd., Dyno Nobel, Sasol, Angus Chemical Company, Yara International ASA, Deepak Fertilisers and Petrochemicals Corporation Ltd., Grupa Azoty S.A., OCI N.V., Thyssenkrupp AG, Orica Limited, LSB Industries, Inc., Haifa Chemicals Ltd., EuroChem Group AG, ChemChina (China National Chemical Corporation) |
| Key Drivers | • The growing demand for nitric acid is driven by its essential role in producing fertilizers like ammonium nitrate, which supports enhanced agricultural productivity to meet the rising global food demand. |
| Restraints | • The production and use of nitric acid pose health risks and environmental concerns, including respiratory issues and air pollution, leading to regulatory restrictions that may limit market growth. |
Frequently Asked Questions
Ans: The Nitric Acid Market is expected to grow at a CAGR of 3.43% during 2024-2032.
Ans: The Nitric Acid Market was USD 27.36 billion in 2023 and is expected to Reach USD 37.05 billion by 2032.
Ans The growing demand for nitric acid is driven by its essential role in producing fertilizers like ammonium nitrate, which supports enhanced agricultural productivity to meet the rising global food demand.
Ans: The “fertilizers” segment dominated the Nitric Acid Market.
Ans: Europe dominated the Nitric Acid Market in 2023
Get in Touch
