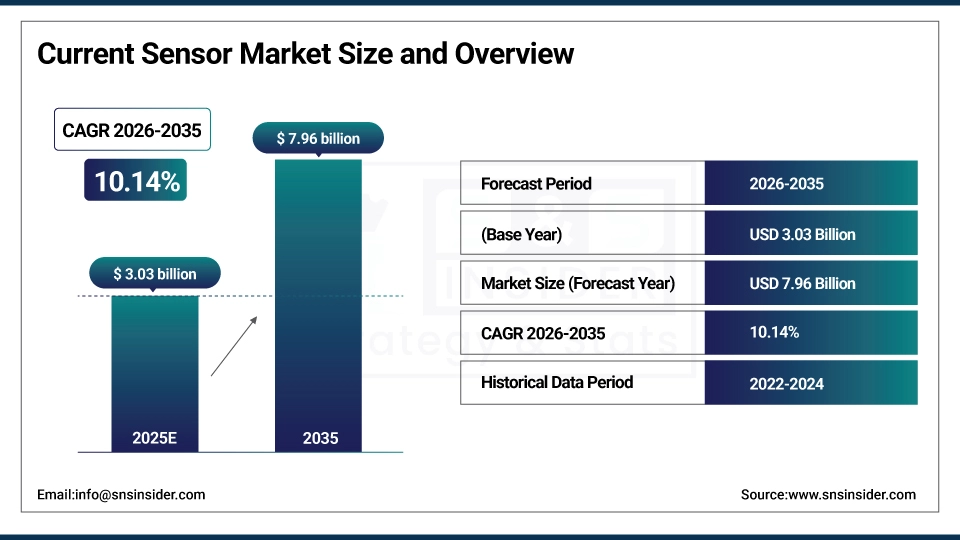
Current Sensor Market Size Analysis:
The Current Sensor Market Size is estimated at USD 3.03 Billion in 2025 and is projected to reach USD 7.96 Billion by 2035, growing at a CAGR of 10.14% during the forecast period 2026–2035.
The Current Sensor Market analysis report provides a thorough analysis of sensing technologies, electrification's effects, and adoption patterns in the automotive, industrial, and energy sectors. Throughout the projected period, key factors propelling market expansion include growing automation in manufacturing, the proliferation of electric vehicles (EVs) and renewable energy systems, and rising demand for power efficiency.
Current sensor deployments are projected to exceed 2.5 billion units annually by 2025, fueled by stringent efficiency regulations and the global shift toward electrified systems.
Market Size and Growth Projection:
-
Market Size in 2025E: USD 3.03 Billion
-
Market Size by 2035: USD 7.96 Billion
-
CAGR: 10.14% from 2026 to 2035
-
Base Year: 2025
-
Forecast Period: 2026–2035
-
Historical Data: 2022–2024
To Get more information on Current Sensor Market - Request Free Sample Report
Current Sensor Market Trends:
-
Accelerating electric vehicle (EV) production is driving high-accuracy current sensing demand, with over 75% of new EV powertrains integrating isolated current sensors for battery and motor control.
-
Growth in renewable energy is boosting demand for grid-tie inverters and solar microinverters, where current sensors ensure safety and efficiency, supporting over 30% annual capacity additions.
-
Industrial automation and robotization are increasing the need for motor drive current monitoring, enhancing system safety and predictive maintenance capabilities.
-
Adoption of wide-bandgap semiconductors (SiC, GaN) is creating opportunities for faster, more precise current sensors capable of high-frequency switching monitoring.
-
Miniaturization and integration trends are leading to increased adoption of chip-scale and package-integrated current sensors, especially in consumer electronics and compact power supplies.
-
Stringent energy efficiency standards (e.g., EU Ecodesign, DOE regulations) are mandating higher-precision current measurement in appliances, HVAC, and industrial equipment.
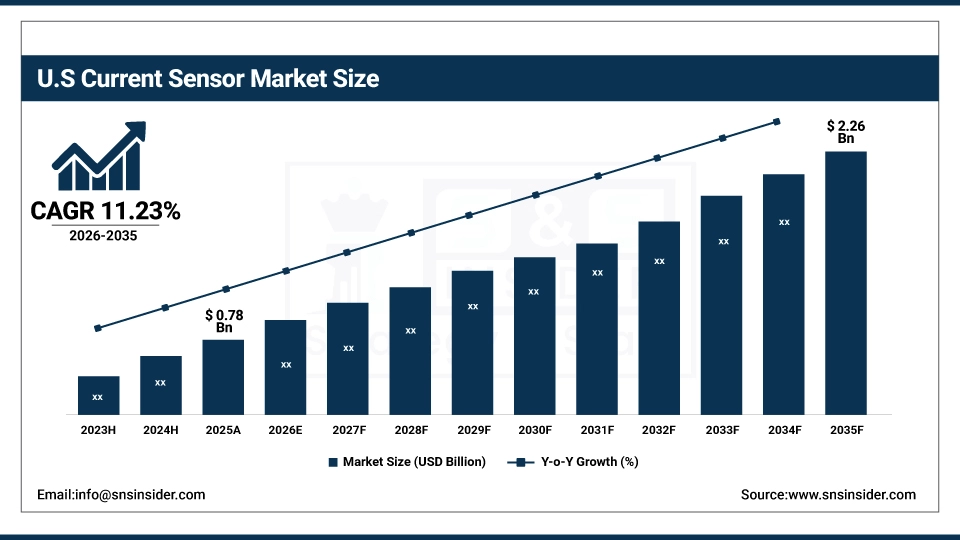
U.S. Current Sensor Market Size Outlook:
The U.S. Current Sensor Market is projected to grow from USD 0.78 Billion in 2025E to USD 2.26 Billion by 2035, at a CAGR of 11.23%. Strong investments in EV manufacturing, the development of data center and renewable energy infrastructure, sophisticated industrial automation, and significant defense and aerospace expenditures that call for high-reliability sensing technologies are all driving growth.
Current Sensor Market Growth Drivers:
-
Rapid Electrification of Transportation and Expansion of Renewable Energy Infrastructure are Primary Drivers for Current Sensor Market Growth
The global push toward electrification, particularly in automotive and energy sectors, is the foremost driver of the Current Sensor Market. Electric vehicle production, requiring accurate battery management (BMS), motor drive control, and onboard charging systems, relies heavily on isolated current sensors. Concurrently, solar photovoltaic and wind energy installations demand robust current sensing for inverter control, grid synchronization, and fault protection. This dual demand from mobility and energy transitions compels innovations in sensor accuracy, bandwidth, and isolation, securing long-term market expansion across high-value applications.
EV and renewable energy applications are projected to account for over 58% of new current sensor demand by 2025, underscoring their central role in market growth.
Current Sensor Market Restraints:
-
Price Sensitivity in Cost-Competitive Applications and Technical Challenges Related to High-Temperature, High-Noise Environments Restrain Broader Current Sensor Adoption in Some Industrial Segments
Profit margins are strained and the adoption of sophisticated, more expensive sensor technologies is constrained by fierce price rivalry, particularly in consumer electronics, automotive tier-2 systems, and low-end industrial equipment. Furthermore, building sensors for harsh environments, such as high-power industrial motors with substantial electromagnetic interference or automobile under-hood applications, presents engineering difficulties that can lengthen development times and raise costs. These technological and financial obstacles may hinder adoption in applications that are extremely demanding or price-sensitive.
Current Sensor Market Opportunities:
-
The Proliferation of IoT and Smart Grid Technologies Presents Substantial Opportunities for Integrated, Intelligent Current Sensors with Communication and Diagnostic Capabilities
An important growth path is created by the incorporation of modern sensors into smart infrastructure and the Internet of Things (IoT). Current sensors with digital outputs (I2C, SPI) and embedded diagnostics are needed for smart meters, connected industrial equipment, and predictive maintenance systems. Similar to this, sensors are required for energy quality analysis, fault detection, and real-time line monitoring in smart grid deployments. This development makes it possible for sensor makers to provide value-added, system-level monitoring solutions rather of just basic measurement components.
IoT-enabled current sensors are forecast to represent nearly 35% of the digital output sensor segment by 2027, highlighting the shift toward connected sensing.
Current Sensor Market Segmentation Analysis:
-
By Sensor Method, In-direct Current Sensing held the largest market share of 68.42% in 2025, while Direct Current Sensing is expected to grow at a CAGR of 10.89% during 2026–2035.
-
By Application, Motor Drive accounted for the highest market share of 28.15% in 2025, while Battery Management Systems (BMS) is projected to expand at the fastest CAGR of 13.27% during the forecast period.
-
By Loop, Open Loop systems dominated with a 55.60% share in 2025, while Closed Loop is expected to grow at the fastest CAGR of 11.05% through 2026–2035.
-
By Technology, Hall Effect sensors held the largest share of 52.75% in 2025, while Shunt-based technology is forecasted to register the fastest CAGR of 10.98% during 2026–2035.
-
By Output, Analog output accounted for the largest share of 61.30% in 2025, while Digital output is expected to grow at the fastest CAGR of 12.18% through the forecast period.
By Application, Motor Drive Dominates While Battery Management Expands Rapidly
Motor Drive application segment dominated, as current sensing is critical for torque control, overload protection, and efficiency optimization in industrial automation, HVAC systems, EVs, and home appliances. This segment utilized over 700 million sensors in 2025, reflecting its foundational role in electromechanical systems.
Battery Management Systems (BMS) is the fastest-growing segment, fueled by the explosive growth of electric vehicles, energy storage systems (ESS), and portable electronics. Precise current measurement for state-of-charge (SoC) calculation, cell balancing, and safety monitoring is paramount, driving high-volume adoption of both shunt and isolated sensor technologies.
By Sensor Method, In-direct Sensing Dominates While Direct Sensing Grows Steadily
In-direct Current Sensing (using magnetic field detection) segment dominated due to its inherent galvanic isolation, safety advantages, and suitability for medium-to-high current applications in automotive traction inverters, industrial motor drives, and solar inverters. Over 1.8 billion units were deployed in 2025, favored for their ability to measure high currents without physical contact.
Direct Current Sensing (using shunt resistors) is growing robustly, driven by its excellent accuracy, low cost, and linearity, making it ideal for battery management systems, low-voltage DC/DC converters, and consumer electronics. Its growth is accelerated by the precision requirements in EV battery packs and data center power distribution.
By Technology, Hall Effect Dominates While Shunt Technology Expands Rapidly
Hall Effect technology segment dominated, valued for its non-contact operation, good isolation, and ability to measure both AC and DC. Its widespread use in automotive, industrial, and renewable energy applications cemented its leading position, with shipments exceeding 1.2 billion units in 2025.
Shunt-based technology is growing at the fastest pace, primarily due to its unmatched accuracy and low cost in BMS applications. The EV revolution, demanding precise Coulomb counting for range estimation, is the single largest driver for shunt resistor adoption, supplemented by growth in data center server power management.
By Loop, Open Loop Dominates While Closed Loop Gains Traction for High Performance
Open Loop systems dominated the market share, favored for their simpler design, lower cost, and smaller size in applications where extreme accuracy and linearity are secondary to cost and space, such as consumer appliances and general-purpose industrial drives.
Closed Loop systems are growing faster, as they offer superior accuracy, linearity, and fast response time. Their adoption is increasing in high-performance applications like servo drives, precision medical equipment, and advanced EV powertrains, where measurement fidelity directly impacts system performance and safety.
By Output, Analog Dominates While Digital Output Grows Rapidly
Analog output segment dominated, as most traditional control systems and microcontrollers are designed to process analog voltage signals. Its simplicity, maturity, and low latency keep it as the default choice for a vast array of motor control and power conversion applications.
Digital output is the fastest-growing segment, driven by the need for noise-immune communication, easier integration with microprocessors, and advanced features like integrated diagnostics, calibration memory, and communication protocols (I2C, SPI). This growth is strongly correlated with the rise of Industry 4.0 and smart, connected systems.
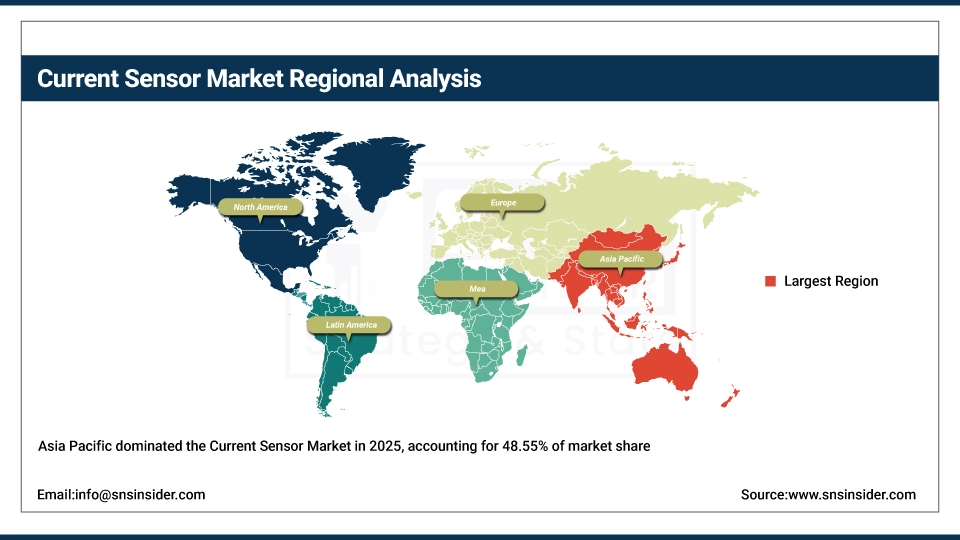
Current Sensor Market Regional Analysis:
Asia Pacific Current Sensor Market Insights:
Asia Pacific dominated the Current Sensor Market with 48.55% share in 2025, driven by its position as the global manufacturing hub for consumer electronics, automotive components, and industrial machinery. Massive investments in EV production in China, semiconductor fabrication in Taiwan and South Korea, and industrial automation across the region create unparalleled demand. Government mandates for energy efficiency and strong renewable energy adoption further solidify APAC's leading position.
Get Customized Report as per Your Business Requirement - Enquiry Now
-
China Current Sensor Market Insights: China is the regional and global epicenter, accounting for over 52% of Asia-Pacific demand. Growth is propelled by the world's largest EV market and production base, aggressive solar and wind power installations, and dominant electronics manufacturing. Domestic policies favoring electrification and technological self-sufficiency are driving massive local sensor production and consumption.
North America Current Sensor Market Insights
North America is expected to grow at a CAGR of 11.87%, making it the fastest-growing area. Strong investments in data center infrastructure, advanced industrial reshoring, aerospace and defense upgrading, and EV and battery gigafactories support growth. The demand for cutting-edge current sensing technology is further accelerated by strict energy laws and the widespread use of industrial IoT solutions.
-
U.S. Current Sensor Market Insights: The U.S. is the core of North American growth, contributing approximately 85% of regional revenue. Leadership is driven by technological innovation, presence of major automotive OEMs transitioning to electric, Silicon Valley's influence on power electronics, and substantial federal investments in grid modernization and clean energy initiatives under acts like the Inflation Reduction Act (IRA).
Europe Current Sensor Market Insights:
Europe holds the position of the second-largest regional market, driven by the world's most stringent automotive emission regulations accelerating EV adoption, a strong industrial automation base (Industry 4.0), and ambitious renewable energy targets. Germany, Italy, and France lead in high-performance motor drive and automotive sensor applications, supported by a strong engineering and manufacturing heritage.
-
Germany Current Sensor Market Insights: Germany leads Europe with nearly 29% regional demand, anchored by its premier automotive industry's rapid electrification, world-leading industrial machinery (Industrie 4.0), and significant investments in wind and solar energy infrastructure. German engineering emphasis on precision and reliability fuels demand for high-end closed-loop and digital output current sensors.
Current Sensor Market Competitive Landscape:
Allegro MicroSystems, Inc.
Allegro MicroSystems, a world leader in power and sensing semiconductors, was founded in 1990 and has its headquarters in Manchester, New Hampshire, in the United States. With an emphasis on electrification and energy economy, the firm serves the automotive, industrial, and computer markets with high-performance Hall-effect sensor integrated circuits (ICs), such as current sensors, magnetic position sensors, and motor drivers.
-
In 2024, Allegro launched a new family of high-bandwidth, isolated current sensors specifically designed for SiC and GaN-based traction inverters in next-generation electric vehicles.
Texas Instruments Incorporated
Texas Instruments (TI) is a multinational semiconductor design and manufacturing company that was founded in 1930 and is headquartered in Dallas, Texas, USA. TI provides precise signal chain solutions for automotive, industrial, and personal electronics applications globally with a comprehensive range of integrated current sense amplifiers, shunt-based monitoring ICs, and isolated sensor interfaces.
-
In 2023, Texas Instruments introduced a highly integrated, precision current sense amplifier with enhanced diagnostic features for robust automotive battery management systems.
LEM Holding SA
Founded in 1972 and headquartered in Geneva, Switzerland, LEM is a pioneer and global market leader in electrical measurement. The company specializes in high-performance current and voltage transducers based on fluxgate, Hall-effect, and magneto-resistive technologies, serving demanding applications in industrial drives, renewable energy, automotive, and rail.
-
In 2024, LEM expanded its automotive-grade sensor portfolio with a new series of ultra-compact, high-accuracy current transducers for 800V EV platform battery monitoring.
Infineon Technologies AG
Founded in 1999, Infineon Technologies is a prominent worldwide semiconductor firm with its headquarters located in Neubiberg, Germany. Targeting automotive, industrial power control, and Internet of Things applications, its sensor range consists of XENSIVTM brand current sensors that use Hall and magneto-resistive technologies in addition to a full ecosystem of power semiconductors and microcontrollers.
-
In 2023, Infineon launched a novel magneto-resistive (XMR) current sensor family offering exceptional accuracy and temperature stability for high-precision industrial and medical equipment.
Current Sensor Companies are:
-
Texas Instruments Incorporated
-
LEM Holding SA
-
Infineon Technologies AG
-
Asahi Kasei Microdevices Corporation
-
Melexis NV
-
ACEINNA Inc.
-
Kohshin Electric Corporation
-
Sensitec GmbH
-
Vishay Intertechnology, Inc.
-
STMicroelectronics N.V.
-
Analog Devices, Inc.
-
Honeywell International Inc.
-
NXP Semiconductors N.V.
-
Murata Manufacturing Co., Ltd.
-
Silicon Laboratories Inc.
-
ROHM Co., Ltd.
-
MagnaChip Semiconductor Corp.
-
TT Electronics plc
|
Report Attributes |
Details |
|---|---|
| Market Size in 2025E | USD 3.03 Billion |
| Market Size by 2035 | USD 7.96 Billion |
| CAGR | CAGR of 10.14% From 2026 to 2035 |
| Base Year | 2025E |
| Forecast Period | 2026-2035 |
| Historical Data | 2021-2024 |
|
Report Scope & Coverage |
Market Size, Segments Analysis, Competitive Landscape, Regional Analysis, DROC & SWOT Analysis, Forecast Outlook |
|
Key Segments |
• By Sensor Method (Direct Current Sensing, In-direct Current Sensing) |
|
Regional Analysis/Coverage |
North America (US, Canada), Europe (Germany, UK, France, Italy, Spain, Russia, Poland, Rest of Europe), Asia Pacific (China, India, Japan, South Korea, Australia, ASEAN Countries, Rest of Asia Pacific), Middle East & Africa (UAE, Saudi Arabia, Qatar, South Africa, Rest of Middle East & Africa), Latin America (Brazil, Argentina, Mexico, Colombia, Rest of Latin America). |
|
Company Profiles |
Allegro MicroSystems, Inc., Texas Instruments Incorporated, LEM Holding SA, Infineon Technologies AG, TDK Corporation, Asahi Kasei Microdevices Corporation, Melexis NV, ACEINNA Inc., Kohshin Electric Corporation, Sensitec GmbH, Vishay Intertechnology, Inc., STMicroelectronics N.V., Analog Devices, Inc., Honeywell International Inc., NXP Semiconductors N.V., Murata Manufacturing Co., Ltd., Silicon Laboratories Inc., ROHM Co., Ltd., MagnaChip Semiconductor Corp. and TT Electronics plc. |
Get in Touch
