Data Visualization Tools Market Report Scope & Overview:
Get more information on Data Visualization Tools Market - Request Sample Report
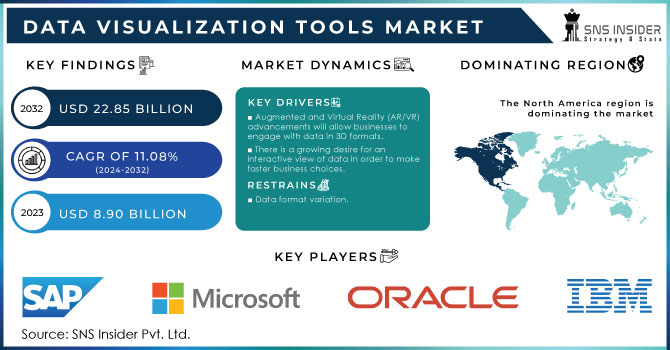
The Data Visualization Tools Market was valued at USD 8.90 billion in 2023 and is expected to reach USD 22.85 billion by 2032, growing at a CAGR of 11.08% from 2024-2032.
The data visualization tools market has experienced substantial growth over recent years, driven by the increasing demand for advanced analytics and the need for actionable insights across various industries. Data visualization tools transform complex datasets into graphical representations, enabling businesses to make data-driven decisions faster and more accurately.
One of the key growth drivers in this market is the rising volume of data generated by businesses due to digital transformation initiatives. Organizations across sectors such as retail, healthcare, finance, and manufacturing are increasingly adopting data visualization tools to analyze large datasets, identify trends, and improve business outcomes. The growing adoption of cloud computing, the Internet of Things (IoT), and Artificial Intelligence (AI) further amplifies the need for robust data visualization solutions. As a result, companies are leveraging these tools to streamline operations, enhance customer experiences, and maintain a competitive edge.
The demand for user-friendly and interactive dashboards, which allow real-time monitoring and analytics, has been another significant growth factor. Tools like Tableau, Power BI, and Qlik Sense lead the market due to their ease of use, flexibility, and integration capabilities with various data sources. The trend towards self-service analytics is also propelling the market forward, enabling non-technical users to create their visualizations without relying on IT departments. This democratization of data is essential in making data-driven insights accessible to a broader range of decision-makers within organizations.
Moreover, the integration of AI and machine learning into data visualization tools is revolutionizing how data is analyzed and presented. Predictive analytics, anomaly detection, and automated insights generation are some advanced features that enhance the value proposition of these tools. For example, AI-driven visualizations can automatically suggest the most relevant charts or graphs based on the data input, saving time and improving analytical outcomes.
Despite the robust growth, challenges such as data privacy concerns, high implementation costs, and the complexity of handling unstructured data can hinder market expansion. However, ongoing technological advancements and the increasing emphasis on data-driven strategies will continue driving the market's growth in the coming years. The data visualization tools market is poised for substantial expansion, driven by the increasing need for insightful and actionable data analysis.
Market Dynamics
Drivers
-
Increasing need for immediate insights to make faster business decisions.
-
Cloud-based solutions enable scalable and flexible data visualization.
-
Advanced analytics and predictive capabilities enhance data insights.
Advanced analytics and predictive capabilities significantly enhance data insights, particularly within the data visualization tools market. These features empower businesses to go beyond basic data representation, enabling them to uncover hidden patterns, forecast future trends, and make data-driven decisions.
Predictive analytics leverages historical data, machine learning, and statistical algorithms to forecast future outcomes, offering businesses a competitive edge. For instance, Power BI’s integration with AI models enables users to predict sales trends and customer behaviors directly from their dashboards.
Advanced analytics not only enhance visualization but also facilitate a deeper understanding of data through techniques like clustering, regression analysis, and anomaly detection.
Cloud-based solutions have revolutionized the data visualization tools market by providing scalable and flexible options that cater to businesses of all sizes. Unlike traditional on-premise tools, cloud-based platforms offer real-time data processing, easy integration, and scalability to handle large datasets, making them ideal for growing companies. Additionally, cloud solutions reduce costs associated with infrastructure, maintenance, and updates, making them more accessible to smaller businesses. With 94% of enterprises already using cloud services, the shift towards cloud-based data visualization tools is a key trend, driving efficiency and agility in data-driven environments.
Restraints
-
Difficulty in switching platforms due to proprietary formats and data structures.
-
Cloud-based tools raise data privacy and security issues.
-
Some tools struggle to handle very large or complex datasets.
Some data visualization tools struggle to handle very large or complex datasets, posing a significant challenge in the market. As data volumes grow exponentially, especially with the rise of big data and IoT, many traditional and even some modern tools face performance bottlenecks, such as slow rendering times, system crashes, or reduced interactivity. For instance, tools like Excel or basic versions of Tableau can lag or fail when processing millions of data points, making them unsuitable for enterprises dealing with massive datasets.
As a result, companies are increasingly turning to advanced, cloud-based, or specialized big data visualization solutions like Microsoft Power BI, Google Data Studio, and D3.js, which are designed to manage high-volume data with enhanced performance capabilities. Nevertheless, overcoming data handling limitations remains a critical challenge for many in the data visualization tools market, driving the demand for more robust and scalable solutions.
Cloud-based data visualization tools raise significant data privacy and security issues, a key concern in the market as businesses increasingly migrate to the cloud. These tools, such as Microsoft Power BI, Google Data Studio, and Tableau Online, store and process vast amounts of sensitive data on external servers, making them vulnerable to cyberattacks, unauthorized access, and data breaches. Data visualization tools often handle confidential business information, personal customer data, and proprietary analytics, which, if compromised, can lead to severe financial and reputational damage.
Segment Analysis
By Component
In 2023, The software segment held the highest revenue share of more than 65.5% and the segment is anticipated to hold the maximum share throughout the forecast period. Startup companies in the data visualization tools market are continually launching new products and innovative solutions to address the changing needs of organizations. These offerings frequently incorporate cutting-edge technologies, providing users with more advanced and user-friendly data analysis capabilities.
The services segment is projected to grow at the highest CAGR over the forecast period. Many data visualization tool providers offer integration services to assist businesses in combining data from various sources into a unified platform. This integration provides a comprehensive view of data and improves analysis capabilities. It also enables companies to design customized dashboards tailored to their specific business needs, enhancing both data visualization and analysis.
By Application
With over 34.5% of global revenue, the marketing and sales segment dominated the market in 2023. Marketing departments utilize data visualization tools to discover patterns and trends in consumer behavior, enabling marketers to make more informed decisions for their campaigns. By analyzing customer demographics, behavior, and preferences, marketers can design targeted campaigns that effectively engage their audience and boost conversions. Likewise, in sales, data visualization tools help analyze customer data to reveal important trends and patterns. Visualizing sales data allows teams to swiftly identify opportunities and concentrate their efforts on the most lucrative market segments.
The Human Resources (HR) sector is expected to experience substantial growth during the forecast period. Data visualization tools help HR professionals present complex data in a straightforward and easily digestible way.
By Deployment
In 2023, the on-premises segment held the largest market share, accounting for over 58.7% of global revenue. A key factor driving the demand for on-premises data visualization tools is the need for data security and privacy. Organizations, especially those in heavily regulated sectors such as finance and healthcare, often require on-premises solutions to meet compliance and security standards. By keeping data on their infrastructure, these organizations gain greater control over their data and can more effectively ensure its protection.
The cloud segment is anticipated to experience rapid growth during the forecast period. This high CAGR is driven by the ease of deployment and the minimal capital and time requirements associated with cloud solutions. Additionally, the trend is the integration of data visualization tools with other cloud-based services, like data warehousing and business intelligence platforms. With the benefits of AI-powered analytics, seamless integrations, scalability, and strong security features, cloud-based data visualization tools are becoming essential for organizations seeking to derive insights and make informed, data-driven decisions.

Need any customization data on Data Visualization Tools Market - Enquiry Now
By Organization Size
With over 68.5% share of the global revenue, the large enterprises segment dominated the market in 2023. Data visualization tools enable large enterprises to handle and analyze extensive datasets, leading to more informed decision-making. Besides uncovering insights, these tools facilitate more effective communication of findings and trends. Visual data representations are simpler to comprehend and interpret, enhancing team collaboration, information sharing, and overall decision-making.
The SMEs segment is anticipated to experience substantial growth during the forecast period. SMEs encounter specific challenges in managing and analyzing their business data. Data visualization tools can assist SMEs in examining customer behavior across multiple touchpoints, including social media, email campaigns, and website interactions. By visualizing this data, SMEs can uncover customer preferences and customize their marketing messages, resulting in more effective campaigns and higher sales.
By End-User
In 2023, the IT and telecommunications segment alone captured the largest revenue share, exceeding 22%. Data visualization tools allow IT and telecom companies to analyze extensive datasets, including network performance, customer behavior, and financial information. Predictive analytics is a growing trend in this sector, helping companies anticipate future trends and detect potential issues before they arise. Tools that integrate predictive analytics can offer valuable insights, enabling companies to maintain a competitive edge.
The healthcare and life sciences segment is expected to experience the highest CAGR during the forecast period. There is a growing need for data visualization tools in this industry to aid in decision-making. Healthcare organizations require data-driven insights and data visualization tools offer a clear and comprehensible view of their data. These solutions can enhance decision-making, improve performance, and optimize patient care.
Regional Analysis
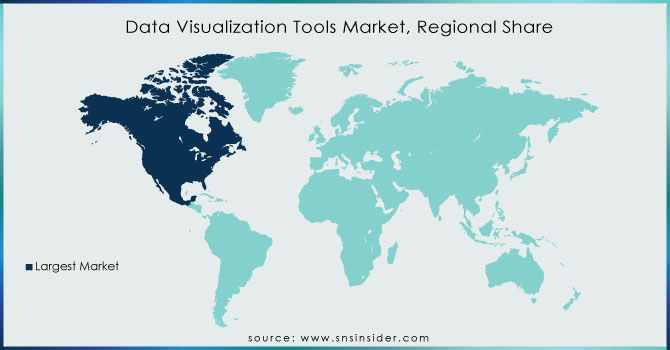
In 2023, North America led the market, capturing over 42.5% of global revenue. Businesses and organizations in the region heavily depend on data to make informed decisions, with data visualization tools being essential to this process. Popular data visualization tools in North America include Tableau, Power BI, D3.js, and Google Data Studio. As concerns about data security and privacy escalate, there is a growing demand for these tools to ensure secure data storage and transfer.
Asia Pacific is expected to register the highest CAGR during the forecast period. As big data, machine learning, and other advanced technologies grow, organizations in the region increasingly require data visualization tools to identify patterns, trends, and anomalies in their data. This demand is especially strong in finance, healthcare, and logistics, where accurate and timely decision-making is crucial. Additionally, with the surge in online shopping and social media, businesses in Asia Pacific are leveraging data visualization to gain insights into consumer behavior and preferences, enabling them to create targeted marketing campaigns that enhance sales and engagement.
KEY PLAYERS:
The major key players are Oracle, Amazon Web Services, Inc., SAS Institute Inc., Sisense Inc., Microsoft Corporation, TIBCO Software, Salesforce, Inc., Alibaba Cloud, IBM, SAP, and others.
Recent Developments
In March 2021, Alteryx partnered with Tech Data, an APA company specializing in automating analytics, data science, and processes to enhance business outcomes more rapidly.
In March 2021, Tableau launched a dedicated region in London, UK, for its fully hosted SaaS solution, Tableau Online. This new region aims to provide customers with improved performance and greater flexibility in data locality.
| Report Attributes | Details |
| Market Size in 2023 | US$ 8.90 Bn |
| Market Size by 2032 | US$ 22.85 Bn |
| CAGR | CAGR of 11.08% From 2024 to 2032 |
| Base Year | 2023 |
| Forecast Period | 2024-2032 |
| Historical Data | 2020-2022 |
| Report Scope & Coverage | Market Size, Segments Analysis, Competitive Landscape, Regional Analysis, DROC & SWOT Analysis, Forecast Outlook |
| Key Segments | • By Component (Software and Service) • By Deployment (Cloud and On-premises) • By Organization Size (Large Enterprises and SMEs) • By Application (Human Resources, Operations, Finance, and Marketing & Sales) • By End-User (BFSI, IT and Telecommunication, Manufacturing, Healthcare & Life Sciences, Retail and E-commerce, Government, Transportation & logistics, and Others) |
| Regional Analysis/Coverage | North America (US, Canada, Mexico), Europe (Eastern Europe [Poland, Romania, Hungary, Turkey, Rest of Eastern Europe] Western Europe] Germany, France, UK, Italy, Spain, Netherlands, Switzerland, Austria, Rest of Western Europe]), Asia Pacific (China, India, Japan, South Korea, Vietnam, Singapore, Australia, Rest of Asia Pacific), Middle East & Africa (Middle East [UAE, Egypt, Saudi Arabia, Qatar, Rest of Middle East], Africa [Nigeria, South Africa, Rest of Africa], Latin America (Brazil, Argentina, Colombia, Rest of Latin America) |
| Company Profiles |
Oracle, Amazon Web Services, Inc., SAS Institute Inc., Sisense Inc., Microsoft Corporation, TIBCO Software, Salesforce, Inc., Alibaba Cloud, IBM, SAP |
| Key Drivers | • Increasing need for immediate insights to make faster business decisions. • Cloud-based solutions enable scalable and flexible data visualization. |
| Market Restraint | • Difficulty in switching platforms due to proprietary formats and data structures. • Cloud-based tools raise data privacy and security issues. |
Get in Touch
