Decentralized Finance Technology Market Report Scope & Overview:
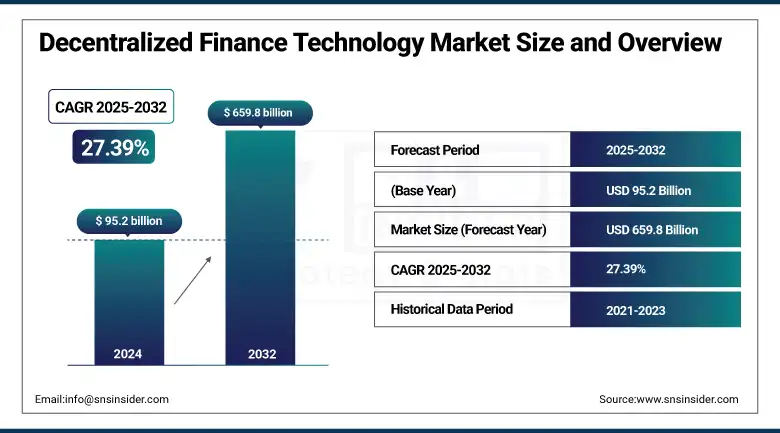
The decentralized finance (defi) technology market size was valued at USD 95.2 billion in 2024 and is expected to reach USD 659.8 billion by 2032, growing at a CAGR of 27.39% during 2025-2032.
The defi technology market growth is fueled by rising adoption of blockchain, growing demand for open financial systems, and the growing need for transparency and decentralized control. DeFi protocols are revolutionizing traditional finance by unlocking new opportunities in the financial industry, within borders or not, ranging from lending, staking, to trading, and many more, without intermediaries. Tokenized real-world assets, and an explosion in the number of DAOs are building the foundations of a new inclusive investment ecosystem. The confluence of regulatory clarity and Layer-2 scaling innovations is accelerating enterprise and developer participation.
To Get more information On Decentralized Finance Technology Market - Request Free Sample Report
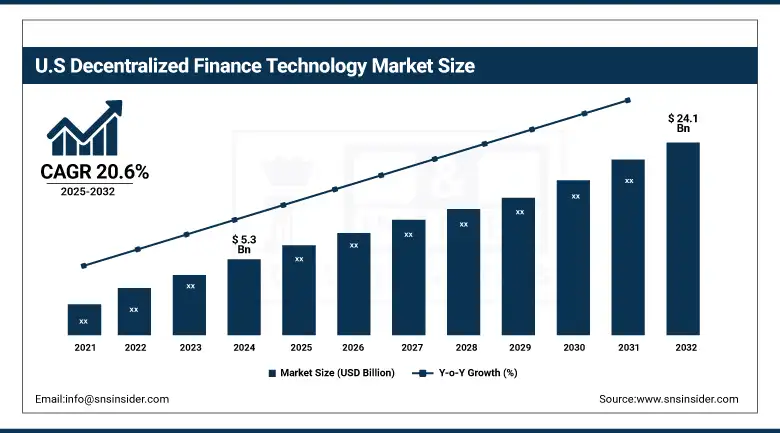
In the U.S., the DeFi market is propelled by a mature crypto infrastructure, regulatory progress around digital assets, and strong institutional interest. The U.S. DeFi technology market was valued at USD 5.3 billion in 2024 and is projected to reach USD 24.1 billion by 2032, growing at a CAGR of 20.6%.
Market Dynamics:
Drivers:
Growing Demand for Transparent, Permissionless Financial Systems Is Driving the As users increasingly want to move away from centralised financial intermediaries like banks, brokers, and other aspects of traditional finance, the decentralised finance (DeFi) ecosystem is gaining momentum. It allows individuals to make transactions directly with each other over the internet using Blockchain technology and smart contracts, removing the need for third-party intermediaries and increasing transparency, speed, and security. The trustless architecture brings down fees and makes financial services accessible to everyone. The rising adoption of digital assets, from stablecoins to tokenized assets, contributed to the development of DeFi in terms of growing products that make use of these digital assets for lending, staking, and trading. The shift towards greater financial decentralization is particularly appealing in areas of the world where large segments of the population remain unbanked or where banking infrastructure is scarce, driving the market outward globally.
As of May 2024, the number of unique DeFi wallet addresses surpassed 34 million, a 55% increase from 21.9 million in mid-2023.
Restraints:
Unclear Global Regulatory Frameworks Are Limiting Institutional Participation and Slowing Mainstream DeFi Adoption
Even though it is an innovative market, the DeFi market faces extensive challenges because in many jurisdictions, regulatory frameworks are not clear or consistent. Governments and other financial authorities are still enacting policies to regulate things like decentralized protocols, smart contracts, and crypto-assets. Many DeFi platforms operate without KYC / AML, which is raising understanding in terms of legality and the risks of financial crime. A crackdown by regulators or an unexpected policy change can impede the growth of the market and deter institutional investors. Moreover, with no central authority to oversee the system, it becomes challenging to find out who is liable in the event of fraud, a security breach, or a technical failure, which lowers user confidence and, consequently, adoption rates.
A 2024 survey by PwC and Crypto Valley revealed that 68% of institutional investors cited lack of regulatory clarity as the primary reason for delaying or avoiding DeFi adoption.
Opportunities:
Lack of Traditional Banking Access in Emerging Markets Is Creating New Opportunities for DeFi-Led Financial Inclusion
DeFi shows the possibility in emerging economies, places with limited access to traditional banking and credit services. In underbanked regions of the world, users can access savings, loans, and insurance via a DeFi platform, using only a smartphone and internet connection. It creates new economic opportunities and enables financial inclusion for millions. Governments and NGOs are already looking into how they can provide aid and identity services using blockchain, further establishing the role of DeFi in socioeconomic development. On top of that, DeFi makes the easiest cross-border payments and remittances, providing a quicker and more affordable solution than traditional methods. These benefits make DeFi a potential disruptor to combat the issue of worldwide financial inequality.
Challenges:
Increasing Smart Contract Vulnerabilities and Cyberattacks Are Threatening User Trust and Platform Reliability in the DeFi Space
Due to their decentralized nature, DeFi platforms are obvious targets for cyber threats, especially those with smart contract vulnerabilities, flash loan attacks, and exploits of the protocol. On a centralized platform, if something happens to your funds, there is at least an accountable entity, someone you can report your loss to, and channels to get your funds back, if at all possible. Flushing the public trust down the toilet due to millions of dollars being lost in hacks or rug pulls for some cloud-hopping telegram superstar. Also, as DeFi systems become more complex and interconnected, these risks compound, as there are no longer separate pockets of risk within ecosystems. Poor code auditing, untested threat modeling, and lack of fail-safes have been ongoing challenges, and without a renewed focus on securing DeFi over the long-term, these deficiencies are going to impede the market's growth.
Segmentation Analysis:
By Component:
Smart Contracts dominated the market in 2024 and accounted for 72% of the decentralized finance technology market share, due to their fundamental role in autonomously facilitating, verifying, and enforcing the negotiation or performance of a forex agreement without a third party. Mass adoption has come through their place within lending, insurance, and trading platforms. Smart contracts continue their reign as the field most popularly utilized by institutions, with deployment and interoperability with secure cross-chain AMM foundry audits.
In May 2025, the New York Fed and BIS launched Project Pine, showing that smart contracts can execute monetary policy operations in a decentralized tokenized environment, potentially enhancing speed and automation in liquidity management
Smart Contracts also register the fastest CAGR through 2032 driven by increasing user demand for DeFi wallets, DEXs, lending platforms, and NFT marketplaces. They are becoming increasingly adopted globally because of their high usability and gradually increasing use cases in various novel web3 ecosystems. With major improvements coming from Layer-2 solutions and mobile DApp use, this exponential growth will only continue to build momentum.
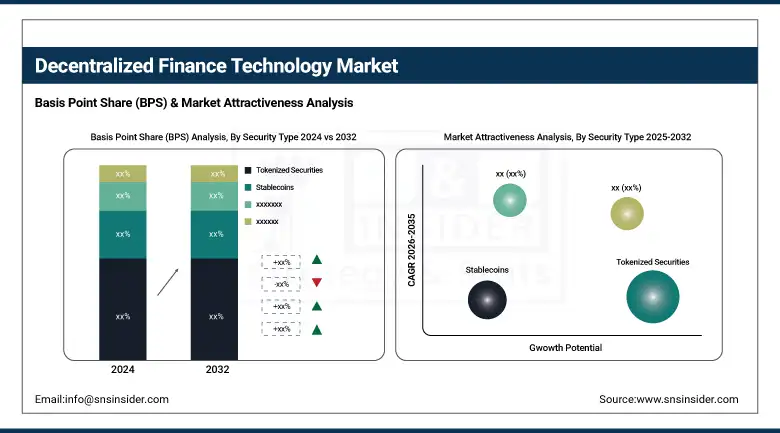
By Security Type:
Tokenized securities dominated the decentralized finance technology market in 2024 and accounted for a significant revenue share, due to they are used for DeFi purposes such as payments, loans, and trading widely throughout 2024. They became the medium of exchange of choice because they were integrating with cross-border transactions and DEX platforms. Regulatory clarity and the introduction of central bank digital currencies (CBDCs) will improve the dominance of stablecoins even more by 2032.
Stablecoins are expected to register the fastest CAGR, primarily led by increasing institutional interest in the tokenization of real-world assets such as equities, bonds, and real estate. For capital markets, they offer greater transparency, rapid settlement and fractional ownership. This part of the DeFi ecosystem will grow rapidly due to adoption by financial institutions and regulatory pilots.
By Industry:
BFSI dominated the decentralized finance technology market in 2024 and accounted for a significant revenue share, due to its early adoption of blockchain for lending, asset tokenization, compliance automation, and cross-border payments. By 2032, BFSI will continue to lead as traditional institutions increasingly integrate DeFi protocols to streamline operations, reduce costs, and improve transaction transparency across global financial networks.
Retail and e-commerce is expected to register the fastest CAGR driven by rising integration of crypto payments, NFT-based loyalty programs, and decentralized marketplaces. Consumer demand for borderless, low-fee transactions and digital ownership is accelerating adoption. Enhanced mobile wallet compatibility and DeFi-based financing tools will further fuel exponential growth in this sector.
Regional Analysis:
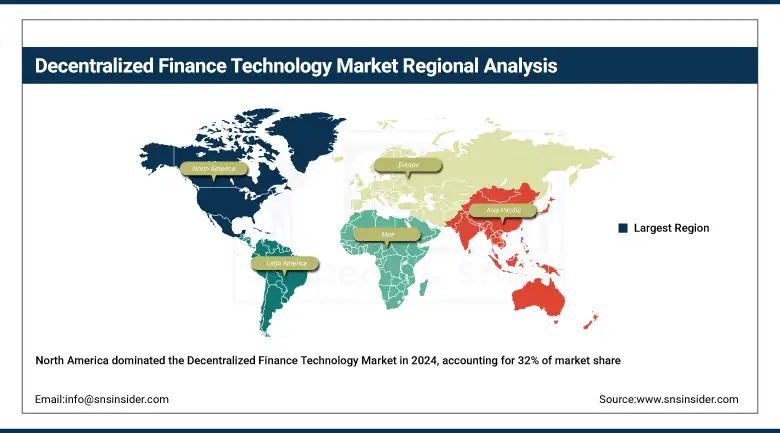
North America dominated the DeFi technology market in 2024, holding 32% of the global share, due to its mature blockchain infrastructure, high cryptocurrency adoption, and active participation by institutional investors. Favorable venture capital investment and advanced fintech ecosystems further fuel growth. By 2032, continued innovation, regulatory progress, and expanding enterprise blockchain integrations will sustain North America’s leadership in the global DeFi market.
Get Customized Report as per Your Business Requirement - Enquiry Now
According to a decentralized finance technology market analysis, Asia-Pacific is expected to register the fastest CAGR through 2032 driven by rapid digital transformation, high mobile penetration, and a surge in DeFi adoption across countries like Singapore, South Korea, and India. Government-led blockchain initiatives, growing crypto user base, and increased use of DeFi for remittances and financial inclusion will propel exponential regional growth.
Europe's growth in the DeFi Technology Market is driven by the EU's MiCA regulatory framework, increasing institutional interest, and growing adoption of tokenized assets. By 2032, enhanced legal clarity and expanding digital finance ecosystems will position Europe as a leading hub for compliant decentralized finance innovation and investment.
The United Kingdom dominates the European DeFi market due to its strong fintech infrastructure, progressive blockchain regulations, and high institutional engagement. With government support for digital asset innovation and rising enterprise blockchain adoption, Germany is expected to drive substantial DeFi expansion across lending, asset tokenization, and decentralized payments by 2032.
Key Players:
The major DeFi Technology Market companies are Uniswap Labs, MakerDAO, Aave, Compound Labs, SushiSwap, Curve Finance, Balancer Labs, Yearn Finance, PancakeSwap, dYdX, 1inch Network, Synthetix, Ren Protocol, Chainlink Labs, Avalanche (Ava Labs), Polygon Labs, Solana Labs, Algorand Foundation, Binance Labs, Ethereum Foundation.
Recent Developments:
-
In January 2025, Uniswap officially launched v4 on January 31, 2025, introducing modular “hooks”—customizable smart contract plugins that enable flexible pool logic, dynamic fees, and gas savings up to 99.99%. The roll‑out included nine audits, a $2.35 M security competition, and a $15.5 M bug bounty to ensure safety and encourage ecosystem innovation.
-
In March 2025, Aave Labs unveiled the “Horizon” initiative, enabling institutions to use tokenized real‑world assets (e.g. money market funds) as on‑chain collateral to borrow stablecoins like GHO and USDC. This bridges DeFi and traditional finance, boosting compliant institutional participation and tokenized liquidity across DeFi rails
|
Report Attributes |
Details |
|
Market Size in 2024 |
US$ 95.2 Billion |
|
Market Size by 2032 |
US$ 659.8 Billion |
|
CAGR |
CAGR of 27.39 % From 2025 to 2032 |
|
Base Year |
2024 |
|
Forecast Period |
2025-2032 |
|
Historical Data |
2021-2023 |
|
Report Scope & Coverage |
Market Size, Segments Analysis, Competitive Landscape, Regional Analysis, DROC & SWOT Analysis, Forecast Outlook |
|
Key Segments |
• By Component (Decentralized Applications, Smart Contracts) |
|
Regional Analysis/Coverage |
North America (US, Canada), Europe (Germany, France, UK, Italy, Spain, Poland, Rest of Europe), Asia Pacific (China, India, Japan, South Korea, ASEAN Countries, Australia, Rest of Asia Pacific), Middle East & Africa (UAE, Saudi Arabia, Qatar,Egypt, South Africa, Rest of Middle East & Africa), Latin America (Brazil, Argentina, Mexico, Colombia, Rest of Latin America) |
|
Company Profiles |
Uniswap Labs, MakerDAO, Aave, Compound Labs, SushiSwap, Curve Finance, Balancer Labs, Yearn Finance, PancakeSwap, dYdX, 1inch Network, Synthetix, Ren Protocol, Chainlink Labs, Avalanche (Ava Labs), Polygon Labs, Solana Labs, Algorand Foundation, Binance Labs, Ethereum Foundation and others in the report |
Frequently Asked Questions
Ans- The North America region dominated the Decentralized Finance Technology Market with 32% of revenue share in 2024.
Ans- Smart Contracts dominated the market in 2024 and accounted for 72% of decentralized finance technology market share
Ans- Growing Demand for Transparent, Permissionless Financial Systems Is Driving the Rapid Adoption of Decentralized Finance Technologies
Ans- The decentralized finance (defi) technology market size was valued at USD 95.2 billion in 2024 and is expected to reach USD 659.8 billion by 2032
Ans- The expected CAGR of the Decentralized Finance Technology Market over 2025-2032 is 27.39%.
Get in Touch
