Diatomite Market Report Scope & Overview:
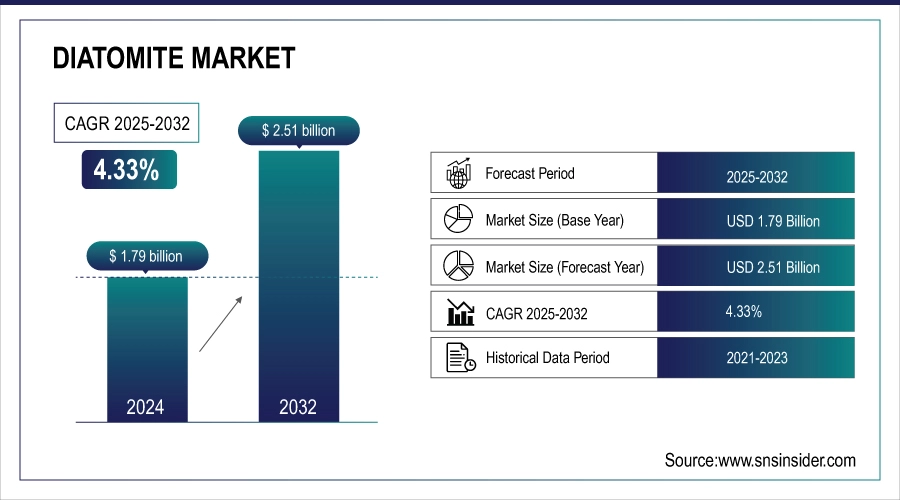
The Diatomite Market Size was valued at USD 1.79 billion in 2024 and is expected to reach USD 2.51 billion by 2032, growing at a CAGR of 4.33% over the forecast period of 2025-2032.
Global diatomite market analysis finds it highly porous, its extraordinary surface area and natural absorptive features make it ideal for use in liquid or gas filtration within water treatment, food processing, among other applications. The purity of diatomite makes it possible to purify drinking water, wastewater treatment, and industrial process water filters without affecting the taste or chemical composition, since they can also remove odors, colours, and suspended solids effectively. In the food and beverage processing, it acts as a high-performance filtration media for beer, wine, edible oils, and fruit juices, providing purity levels of visual clarity and safety requirements drives the diatomite market growth.
Diatomite Market Size and Forecast
-
Market Size in 2024: USD 1.79 Billion
-
Market Size by 2032: USD 2.51 Billion
-
CAGR: 4.33% from 2025 to 2032
-
Base Year: 2024
-
Forecast Period: 2025–2032
-
Historical Data: 2021–2023
To Get more information On Diatomite Market - Request Free Sample Report
Diatomite Market Trends
-
Rising adoption of diatomite in filtration applications across water treatment, food & beverage, and industrial processes.
-
Growing use as an eco-friendly, lightweight, and non-toxic absorbent for oil spill cleanup, industrial spills, and pet care products.
-
Expansion in construction and insulation applications due to diatomite’s heat resistance and lightweight properties.
-
Increasing demand for sustainable and green industrial solutions driving diatomite use in eco-friendly composites, fillers, and advanced insulation materials.
-
Adoption of advanced processing technologies, such as milling and air classification, enhancing purity, particle size control, and filtration efficiency.
-
Rising interest in natural and biodegradable materials for agriculture, cosmetics, and personal care industries.
-
North America leads in market share, driven by established industrial infrastructure and high filtration consumption, while Asia Pacific is the fastest-growing market.
-
Limitations in raw material availability and specialized mining requirements may constrain supply despite rising demand.
-
Increasing applications across diverse end-use industries including food & beverages, water treatment, agriculture, construction, and chemicals.
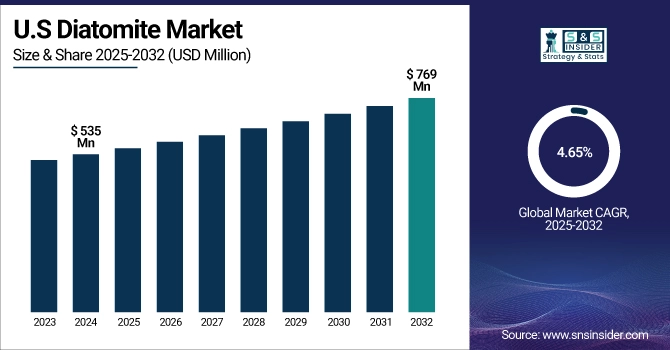
Filtration products accounted for about 65% of the U.S. diatomite production in 2024 and are used in activities-such as refining beer, liquor, water, and wine, and controlling microbial contaminants in public water system.
The U.S. Diatomite market size was USD 535 million in 2024 and is expected to reach USD 769 million by 2032 and grow at a CAGR of 4.65% over the forecast period of 2025-2032. The growth is propelling due to the country’s rich natural reservoirs and fully developed mining & processing setup. The U.S. is also a significant exporter, supplying other countries with top-quality diatomite that is used for filtration and in the manufacturing of millions of industrial applications. Domestically, high domestic consumption is guaranteed by a broad usage of the product in beer, wine, and juice production, among others, and pharmaceuticals and municipal water treatment. Additionally, utilization of diatomite in oil spill clean-up and industrial absorbent products has underpinned market presence.
Diatomite Market Key Drivers:
-
Natural Functional Properties and Versatility Drive the Market Growth
Diatomite resembles fossil algae with its highly porous and light weight nature, making it an excellent filtration, absorption and insulation medium. This is why industries as diverse as beverage production (beer, wine, juices), swimming pool maintenance, and water treatment plants are using it to catch impurities without affecting taste or chemical balance. It is also used as an insulating material in construction and manufacturing, due to its heat resistance.
Diatomite Market Restraints:
-
Mining and Processing Limitations May Hamper the Market Growth
Good diatomite will be available only in certain regions because it is formed by the ancient lake or marine deposits. This makes it more expensive to extract since it requires special mining and processing equipment that must be gentle on its structure. Also, the dust created while handling it needs to be safely controlled and eliminated, as inhaling it is unhealthy over long exposure. The geographic and operational constraints associated with supply also make it considerably more difficult to scale through simply opening more mines, which in turn restricts the flexibility to respond to booming demand.
Diatomite Market Opportunities:
-
Eco-Friendly Market Trends and Product Development Create an Opportunity for the Market Expansion
Given its natural and biodegradable, and chemically inert properties, diatomite is also a great match for the growing market demand for green alternatives. Farmers can use it in place of chemical pesticides (physical pest barrier), cosmetics companies for natural scrubs, manufacturers for sustainable absorbents, filtration products, and more. There is also much untapped potential for combining diatomite with new technologies, such as creating the material in lightweight composites or advanced insulation products, which would take its utilization beyond traditional life-enhancing work in environmental control and agriculture, which drive the diatomite market trends.
Diatomite Market Segmentation Analysis:
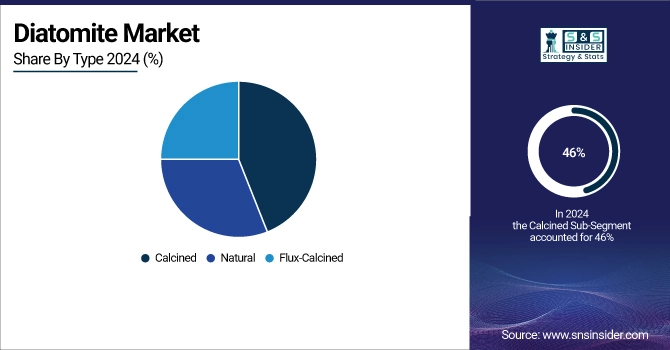
By Type
Calcined diatomite dominates with over 46% share in the diatomite market. It is due to its great filtration effectiveness, warm dependability, and broad utilization in drink processing, pharmaceuticals, and high-temperature protection. Its purified form after heat treatment results in performance improvements, so it is preferred for high-end filtration systems and specific industrial applications.
Flux-calcined grades are experiencing rapid growth because industries, such as water treatment and brewing are creating demand for flux-calcined grades as they require higher filtration clarity at a lower operational cost. It is also used in paints, coatings, and chemical manufacturing for its purer and whiter color, which is improved by the addition of a fluxing agent
By Application
The filtration segment held the largest market share of around 58% in 2024. The segment’s growth is driven by the porous structure of diatomite, filtration is still the leading application area where food and beverage processing, pharmaceuticals, and municipal water systems efficiently remove fine particles.
Absorbent applications are growing quickly as oil spill remediation, industrial spill control, and pet care products demand eco-friendly, lightweight, and non-toxic absorbent materials. The rise in environmental cleanup projects is driving this surge.
By End-Use Industry
Food and beverage held the largest market share of around 39% in 2024. The segment’s growth is propelled by the highest market worth as regulatory requirements for high-quality filtration in tandem with consumer convenience about well well-finished product gives the edge to external housings.
Water treatment is the fastest-growing end-use segment due to the increasing municipal and industrial water purification projects. Government investments in safe drinking water infrastructure and stricter environmental discharge standards are boosting demand.
By Processing Method
Milling segment dominates the market as it produces consistent particle sizes suitable for multiple industrial applications, from filtration media to fillers. The uniformity and controlled particle size distribution enhance filtration efficiency and compatibility in blended products.
Air classification is seeing rapid adoption as industries move toward high-purity, fine-grade diatomite for specialized uses including pharmaceutical excipients and advanced coatings. This method allows precision in separating fine and ultra-fine particles, improving performance in high-value applications.
Diatomite Market Regional Analysis:
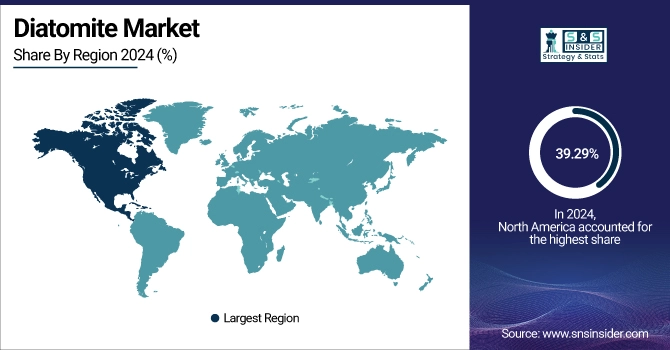
North America held the largest Diatomite Market Share in 2024, around 39.29% 2024 due to its well-established industrial base, high consumption in filtration applications, and presence of large deposits in the western U.S. areas, especially in Nevada, Oregon, and California. High demand in North America can be attributed to significant food and beverage manufacturing industry, besides stringent environmental regulations for water treatment. In addition, diatomite filtration systems are a staple in the U.S. breweries, wineries, and municipal water plants. Thus, the diatomite-based lightweight aggregates market for construction is another contributor to regional demand.
Get Customized Report as per Your Business Requirement - Enquiry Now
The Asia Pacific region is the fastest-growing market. The market is led by the lightning pace of industrialization and rising production in the food & beverage industry, along with fresh water treatment infrastructure being developed in countries, such as China, India, and Japan. The rising demand in urban water purification systems for cost-effective filtration media is a key factor that has boosted the growth of the market. Diatomite industry in agriculture applications of diatomaceous earth (diatomite) is growing, consequently. Growing awareness of greener industrial materials is boosting use in quite a few other verticals.
Europe has a well-established food & beverage sector, and an increasing demand for natural materials in the construction and agricultural sectors is driving the diatomite market growth across Europe. France, Spain, and Denmark, are some of the few countries that commercial diatomite. Increasing application of diatomite in pharmaceutical excipients and as filtration aids for high-end alcoholic beverages acts as a catalyst, fueling the demand.
In 2024, A Spanish producer of diatomite started to produce a new ultra-pure grade, suitable for premium wine filtration to prevent the loss of flavor and in compliance with EU standards for sustainable practices and food safety.
Diatomite Market Key Players:
Major Diatomite companies are Imerys, EP Minerals, Showa Chemical Industry Co., Ltd., Calgon Carbon Corporation, Dicalite Management Group, Jilin Yuantong Mineral Co., Ltd., Damolin, Diatomite CJSC, EaglePicher Technologies LLC, Qingdao Best Diatomite Co., Ltd., Shengzhou Huali Diatomite Products Co., Ltd., Xinyu South Graphite Co., Ltd., Domolin Mining Co., Ltd., CECA Chemical Co., Ltd., Zhongcheng Diatomite Co., Ltd., Jilin Yuan Tong Mineral Co., Ltd., Harbin Diatomite Co., Ltd., Chanye Diatomite Co., Ltd., Diatomite Products Co., and HEPWORTH Minerals & Chemicals Ltd.
Recent Developments:
-
In 2025, Imerys S.A. expanded its diatomite processing facility in Lompoc, California, to integrate advanced dust-control systems and improve energy efficiency, targeting reduced carbon emissions in filtration-grade diatomite production.
-
In 2024, EP Minerals, LLC. introduced a next-generation diatomite filtration aid designed for faster flow rates in brewing and juice manufacturing, with enhanced clarity performance for premium beverage applications.
| Report Attributes | Details |
|---|---|
| Market Size in 2024 | USD 1.79 Billion |
| Market Size by 2032 | USD 2.51 Billion |
| CAGR | CAGR of 4.33% From 2025 to 2032 |
| Base Year | 2024 |
| Forecast Period | 2025-2032 |
| Historical Data | 2021-2023 |
| Report Scope & Coverage | Market Size, Segments Analysis, Competitive Landscape, Regional Analysis, DROC & SWOT Analysis, Forecast Outlook |
| Key Segments | • By Type (Natural, Calcined, Flux-Calcined), • By Application (Filtration, Absorbents, Fillers, Abrasives, Insulation, Others [catalysts, personal care products, rubber & plastics]), • By End-Use Industry (Food & Beverages, Water Treatment, Agriculture, Construction, Paints & Coatings, Others [pharmaceuticals, chemicals, oil & gas]), • By Processing Method (Crushing, Milling, Air Classification, Others [screening, blending, surface modification]) |
| Regional Analysis/Coverage | North America (US, Canada), Europe (Germany, France, UK, Italy, Spain, Poland, Russsia, Rest of Europe), Asia Pacific (China, India, Japan, South Korea, Australia,ASEAN Countries, Rest of Asia Pacific), Middle East & Africa (UAE, Saudi Arabia, Qatar, Egypt, South Africa, Rest of Middle East & Africa), Latin America (Brazil, Argentina, Mexico, Colombia Rest of Latin America) |
| Company Profiles | Imerys, EP Minerals, Showa Chemical Industry Co., Ltd., Calgon Carbon Corporation, Dicalite Management Group, Jilin Yuantong Mineral Co., Ltd., Damolin, Diatomite CJSC, EaglePicher Technologies LLC, Qingdao Best Diatomite Co., Ltd., Shengzhou Huali Diatomite Products Co., Ltd., Xinyu South Graphite Co., Ltd., Domolin Mining Co., Ltd., CECA Chemical Co., Ltd., Zhongcheng Diatomite Co., Ltd., Jilin Yuan Tong Mineral Co., Ltd., Harbin Diatomite Co., Ltd., Chanye Diatomite Co., Ltd., Diatomite Products Co., HEPWORTH Minerals & Chemicals Ltd. |
Frequently Asked Questions
Ans North America leads the global market, followed by Asia Pacific and Europe, driven by strong industrial demand and resource availability.
Ans Trends include the development of high-purity diatomite grades, eco-friendly mining practices, and expansion into advanced filtration for microplastics removal
Ans. Filtration, food and beverage, construction, agriculture, and paints and coatings are the largest consumers of diatomite.
Ans. Major players include Imerys S.A., EP Minerals LLC, Showa Chemical Industry Co., Ltd., Jilin Yuantong Mineral Co., Ltd., and Calgon Carbon Corporation
Ans Rising demand for diatomite in filtration, construction, and agriculture, along with its eco-friendly properties and growing use in water treatment, is driving market growth
Get in Touch
