E-fuels Market Report Scope & Overview:
The E-fuels Market Size was valued at USD 18.12 billion in 2025 and is expected to reach USD 128.03 billion by 2033, growing at a CAGR of 27.69% over the forecast period of 2026-2033.
The global E-Fuels market is anticipated to expand during the forecast period owing to factors such as increasing demand for sustainable mobility, decarbonization of the aviation & marine segment, and favourable government regulations for net-zero targets. Among the reasons are the rise of renewable hydrogen applications for large-scale fuel synthesis, the ramp-up of demand for sustainable aviation fuels (SAF) that replace jet fuel from kerosene, and ongoing technological advances in Power-to-Liquid (PtL) and Fischer-Tropsch synthesis for the reduction of costs and the improvement of efficiency which drive the E-fuels market growth.
For example, HIF Global is investing more than USD 6 billion in its e-fuels plant, located in Texas (U.S.), to produce nearly 200,000 tons of carbon-neutral e-fuels per year from 2027, in one of the largest commercial-scale investments in the sector.
E-fuels Market Size and Forecast:
-
Market Size in 2025: USD 18.12 billion
-
Market Size By 2033: USD 128.03 billion
-
CAGR : 27.69% From 2026 to 2033
-
Base Year: 2025
-
Forecast Period: 2026–2033
-
Historical Data: 2022–2024

To Get more information on E-fuels Market - Request Free Sample Report
E-fuels Market Highlights:
-
Scale-up of Power-to-Liquid (PtL) projects
-
Strong momentum in Sustainable Aviation Fuel (SAF)
-
Policy-backed carbon reduction mandates
-
Rising corporate partnerships & joint ventures
-
Cost reduction through technology optimization
-
Marine and heavy transport adoption
-
Global investment surge in large-scale projects
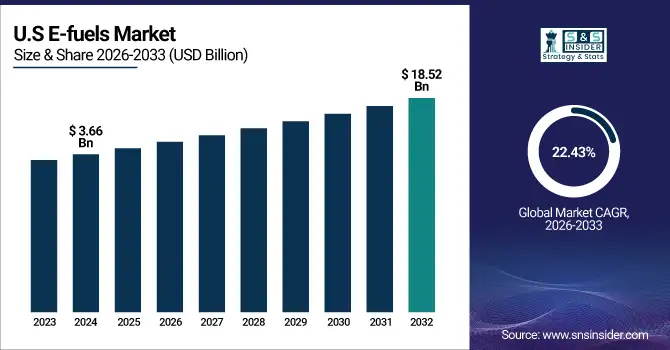
U.S. E-fuels Market Insights
The U.S. E-fuels Market size was valued at USD 3.66 billion in 2024 and is projected to reach USD 18.52 billion by 2032, growing at a CAGR of 22.43%during 2026-2033.
The country is a significant market because of ambitious renewable energy goals, increasing demand for sustainable transportation fuels, and growth in the aviation and marine sectors. In addition, high disposable income, technological advancement in PtL and PtG systems, and favourable government regulations help in increased uptake of E-fuels.
In 2024, America's largest energy corporation set up an R&D centre for R&D E-kerosene and E-diesel technologies.
E-fuels Market Growth Drivers
-
Stringent Climate Policies and Decarbonization Targets Drive Market Expansion
With the world’s nations and industry sectors increasing pressure to meet net-zero carbon targets, there is significant momentum for the adoption of e-fuels in the aviation, marine, and road transport sectors. With the European Union’s as well as the US’ Fit for 55 and Inflation Reduction Act (IRA) packages, respectively, subsidies and regulatory systems that increase production capacities directly are being steered. Aviation in particular is a demand driver, under the mandate to mix Sustainable Aviation Fuel (SAF), with e-kerosene established as a key growth driver. Large oil & gas companies and renewables players are accelerating plans and scaling up demonstration projects to grab early market share.
For restrain, the European Commission’s Refuel EU Aviation regulation requires 70% of aviation fuel to be sustainable by 2050, resulting in significant longer-term demand for e-kerosene.
E-fuels Market Restraints
-
High Production Costs and Energy-Intensity May Slow Adoption May Hamper the Market Growth
Even with a strong policy drive, the cost of e-fuels remains commercially unscalable, due to the high production cost associated with both green hydrogen production and CO₂ capture technologies. Large volumes of renewable electricity can be used to produce one liter of e-fuel, which is still costly and can only be produced in limited quantities. This results in the e-fuel having a much higher price than fossil-based fuel, a factor that faces airlines, shipping companies, and haulage with high prices. Unless prices for renewable energy continue to drop and electrolyser efficiency rises, widespread adoption will be hindered.
Present production costs for e-kerosene are about USD 4-6 per liter, 5x the how much conventional jet fuel, exerting huge pressure on the operating margins of airlines.
E-fuels Market Opportunities
-
Large-Scale Investments and Strategic Partnerships Unlock Growth Potential, Creating an Opportunity for the Market
There is now a flurry of cross-sector investment, with energy majors, automotive giants, and governments coming together for e-fuel projects. Commercialization is being accelerated by strategic partnerships that lock up renewable power sources, CO₂ capture outlets, and transport. Air and maritime transport, where electrification potential is more limited, are likely to lead early large-scale deployment, and thus provide a solid demand base. Furthermore, the development of power-to-liquid (PtL) and Fischer-Tropsch processes is diminishing expenses as well as refining products, thus enabling greater market access.
For instance, in 2023, Porsche and HIF Global opened one of the first commercial-scale e-fuels plants in the world in Chile, to produce about 550 million Liters a year by 2030 to help decarbonize the automotive and aviation sectors.
E-fuels Market Segment Highlights:
-
By Fuel Type: E-Diesel – 28.5% share (largest); E-Kerosene (SAF) fastest-growing at 24.5% CAGR.
-
By Production Process: Power-to-Liquid (PtL) – 46% share; Fischer–Tropsch fastest-growing at 23.8% CAGR.
-
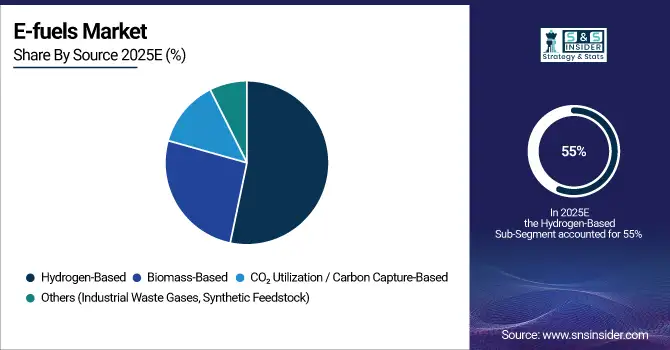
By Source: Hydrogen-based – 55% share; CO₂-based fastest-growing at 22.6% CAGR.
-
By Application: Transportation – 52% share; Shipping/Marine fastest-growing at 25.1% CAGR.
E-fuels Market Segment Analysis:
By Source
The dominance of hydrogen-based e-fuels will increase to a 55% share in 2025, assisted by rapidly growing international green hydrogen capacity and green hydrogen’s vital role in supporting the carbon-neutral fuel market. In comparison, CO2-based fuels are the fastest growing, growing at a CAGR of 22.6%, and support carbon capture, utilization, and storage (CCUS) as they transform emissions into fuel.
By Fuel Type
E-diesel led the fuel type in 2025, with approximately 40% share. Rising penetration in the heavy-duty vehicles and commercial fleet vehicles can be attributed to the stronghold of the industry, as it can be used in the existing diesel engines. However, E-kerosene is the fastest-growing sub-segment and is expected to register a CAGR of 24.5% on account of robust demand from the aviation industry for sustainable aviation fuels (SAF) to achieve global decarbonization goals.
By Production Process
The Power-to-Liquid (PtL) is leading the production process category in 2025due to the utilization of renewable electricity for the synthesis of fuel on a large scale with high efficiency and scalability. On the other hand, the Fischer–Tropsch process is expected to experience the highest growth rate (CAGR of 23.8%), benefiting from its ability to generate drop-in fuels with high quality appropriate for transportation and industrial purposes.
By Application
The application segment is led by transportation with a 52% market size in 2025, owing to increasing product applications in the automotive, aviation, and logistics industries to reduce the dependency on fossil fuels. The Shipping/Marine sub-segment is expected to be the fastest-growing, at a CAGR of 25.1%, due to the rising stringency of International Maritime Organization (IMO) regulations and rising emphasis on decarbonization of maritime shipping using sustainable fuel options.
E-fuels Market Regional Analysis
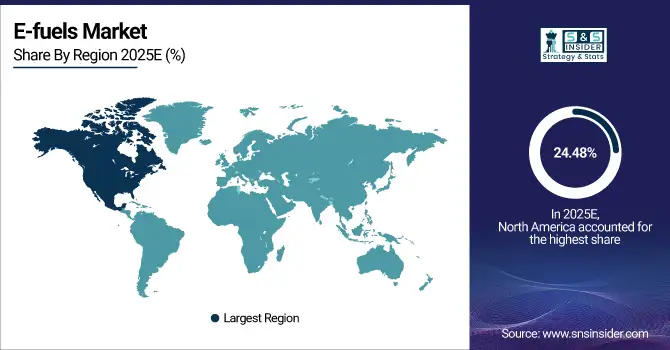
North America E-fuels Market Insights
North America is the fastest-growing region and held the market share of around 24.48% 2025. It is due to the nation and region having the most mature renewable energy infrastructure, large government incentives to support carbon-neutral fuels, and an increasing trend toward sustainable aviation fuel and sustainable transportation fuel. Demand for E-diesel, E-gasoline, and sustainable aviation fuels (SAF) is especially strong in the U.S., fuelled by federal climate policies and power-to-liquid and green hydrogen investments. In 2024, a Texas-based energy company began expanding a facility in the state dedicated to producing e-fuels in response to increasing domestic and global demand.
Get Customized Report as per Your Business Requirement - Enquiry Now
Asia Pacific E-fuels Market Insights
Asia Pacific is becoming a swiftly growing market for E-fuels owing to the increasing dependence on biomass feedstock is increasing due to rapid industrialization, growing population, and demand for sustainable fuels in aviation, shipping, and transportation. The low-cost manufacturing and friendly policies for renewable hydrogen and CO₂ use are also advantages. In the Asia Pacific, China is the leading investor in PtL and PtG and e-methanol production plants. The government’s specification of the goal of net-zero in 2060 and the large-scale application of renewable energy considerably increase E-fuel penetration for C&I use.
Europe E-fuels Market Analysis
Europe held the largest E-fuels market share in 2025, around 42.07% 2025, a demand for green ceramics and high-performance applications. That demand is being pulled by sustainable aviation fuel, green transportation, and industrial applications. Germany – Leading Europe in Hydrogen-Based E-Fuels, Fischer-Tropsch Synthesis, and Renewable Energy Incorporation. Among others in Europe, Germany is focusing on E-fuels based on hydrogen with Fischer-Tropsch synthesis and integrates renewable energy. High demand is linked to the country’s automotive and aviation industries, as well as to regulatory requirements for low-carbon fuels. In 2024, German firms built PtL and e-kerosene-producing factories to support domestic and international demand, improving Europe’s market position.
Latin America (LATAM) and Middle East & Africa (MEA) E-fuels Market Insights
MEA and LATAM represent developing markets for E-fuels, such as green hydrogen, bio-methanol, and sustainable AVFs. Growth Market driven by infrastructure Development and increasing Energy Demand, as well as the high Adoption of Renewable Energy. And in MEA, nations like Saudi Arabia and the UAE are funding PtL and e-methanol for domestic consumption and export. In LATAM, Brazil is capitalizing on its leading bioethanol expertise, and Chile is advancing renewable hydrogen projects. These projects are in line with their long-term commitments to powering industry, transport, and aviation, making MEA and LATAM strategic destinations for future E-fuel production.
Competitive Landscape for E-fuels Market:
Siemens Energy
Siemens Energy is a leading global provider of E-fuels solutions for transportation, aviation, and industrial applications, emphasizing PtL and green hydrogen integration.
-
In March 2024, Siemens Energy inaugurated a new PtL pilot plant in Germany to scale up production of E-diesel and E-kerosene for European markets.
ExxonMobil
ExxonMobil develops and supplies E-fuels for sustainable transportation and industrial sectors, focusing on e-methanol and e-diesel production.
-
In July 2024, ExxonMobil launched a large-scale E-fuels demonstration facility in the U.S. to improve carbon-neutral fuel output and refine production efficiency.
Royal Dutch Shell
Shell is a global leader in E-fuels, offering E-diesel, E-gasoline, and sustainable aviation fuels with an emphasis on low-carbon solutions.
-
In May 2024, Shell opened a new E-fuels production unit in the Netherlands to expand supply for the aviation and road transport sectors.
BP Plc
BP Plc provides innovative E-fuels for transport and industrial applications, integrating hydrogen-based and Fischer-Tropsch synthesis technologies.
-
In September 2023, BP expanded its E-fuels R&D center in the U.K., focusing on green E-kerosene and synthetic diesel for commercial aviation.
E-fuels Market Key Players
-
Siemens Energy
-
Royal Dutch Shell
-
BP Plc
-
Chevron Corporation
-
TotalEnergies SE
-
Neste
-
Eni S.p.A.
-
Sasol Limited
-
HIF Global
-
Ørsted
-
Linde plc
-
Engie
-
Iberdrola
-
Uniper SE
-
Porsche AG
-
Sunfire GmbH
-
Air Liquide
-
Fulcrum BioEnergy
| Report Attributes | Details |
| Market Size in 2025 | USD 18.12 Billion |
| Market Size by 2033 | USD 128.03 Billion |
| CAGR | CAGR of 27.69% From 2026 to 2033 |
| Base Year | 2025 |
| Forecast Period | 2026-2033 |
| Historical Data | 2022-2024 |
| Report Scope & Coverage | Market Size, Segments Analysis, Competitive Landscape, Regional Analysis, DROC & SWOT Analysis, Forecast Outlook |
| Key Segments | • By Type: Zirconium Silicate (Zircon), Zirconia (ZrO₂), Titanium Dioxide (TiO₂), Tin Oxide (SnO₂), Others (antimony oxide, zinc oxide, alumina-based, specialty blends) • By Form: Powder, Granules/Compacted, Dispersions/Slurries, Others (pellets, customized compounds) • By Technology/Processing: Dry Milling, Wet Milling, Micronized/Ultra-fine, Nano-engineered, Others (spray drying, calcination-tailored grades) • By Application: Ceramic Tiles, Sanitaryware, Tableware, Frits & Glazes, Ceramic Inks, Others (technical ceramics, decorative ceramics, refractories) |
| Regional Analysis/Coverage | North America (US, Canada), Europe (Germany, France, UK, Italy, Spain, Poland, Russsia, Rest of Europe), Asia Pacific (China, India, Japan, South Korea, Australia,ASEAN Countries, Rest of Asia Pacific), Middle East & Africa (UAE, Saudi Arabia, Qatar, Egypt, South Africa, Rest of Middle East & Africa), Latin America (Brazil, Argentina, Mexico, Colombia Rest of Latin America) |
| Company Profiles | Zircotec, TORRECID Group, Imerys, Fusion Ceramics, Colorobbia Group, Ferro Corporation, Ultrex Minerals, Endeka Ceramics, Esmalglass-Itaca Grupo, Johnson Matthey, RAK Ceramics, Quarzwerke Group, Sibelco, 3M, Saint-Gobain, Sigma Minerals, Changsha Shenghua Zr Industry, Megacera, Pravin Chemicals, NITCO |
Get in Touch
