Electrolyte Powder Market Report Scope & Overview:
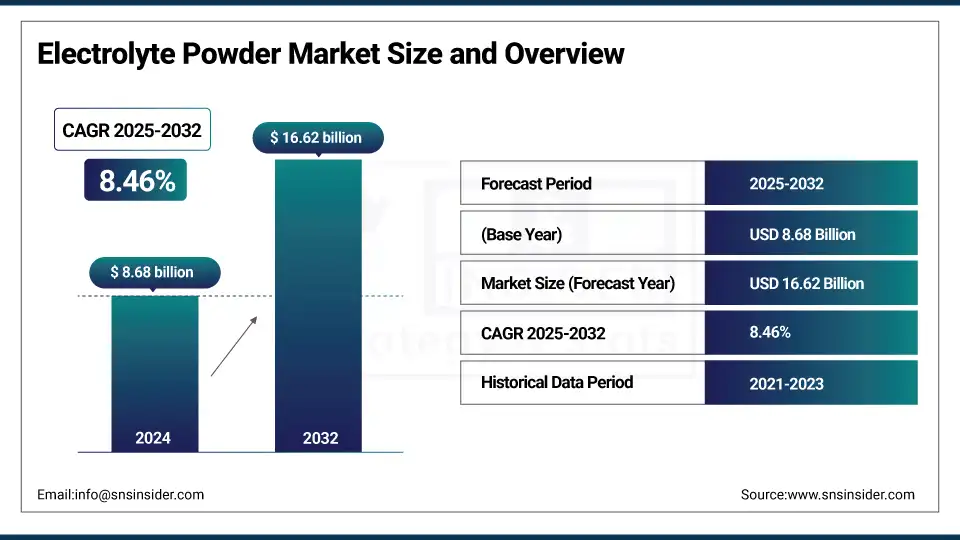
The Electrolyte Powder market size was valued at USD 8.68 billion in 2024 and is expected to reach USD 16.62 billion by 2032, growing at a CAGR of 8.46% over the forecast period of 2025-2032.
The demand for hydration powder, functional powders, and electrolyte blends for providing fitness hydration solutions and consumption of oral rehydration products is providing a huge opportunity for electrolyte powder. Increasing preference for health & wellness supplements among consumers and the sports nutrition market drives the growth of the electrolyte powder, as electrolyte replacement therapy is gaining momentum.
To Get more information On Electrolyte Powder Market - Request Free Sample Report
As per WHO, 41% of children under five years of age suffering from diarrhea can access oral rehydration products, and ORS can avert up to 93% of deaths caused due to diarrhea to support electrolyte powder market analysis. PepsiCo acquired Poppi in March 2025, illustrating consolidation in dance by companies that make leading electrolyte powder. The electrolyte supplements and electrolyte drinks are now dominating the electrolyte powder market trends, contributing toward increasing electrolyte powder market share. Multiple sizes and creative tastes in the electrolyte powder market propel the category. The electrolyte powder industry is booming globally as consumers look for clean-label, natural electrolyte drinks and functional hydration powder that is effective for their active lifestyles and medical needs within the sports nutrition markets.
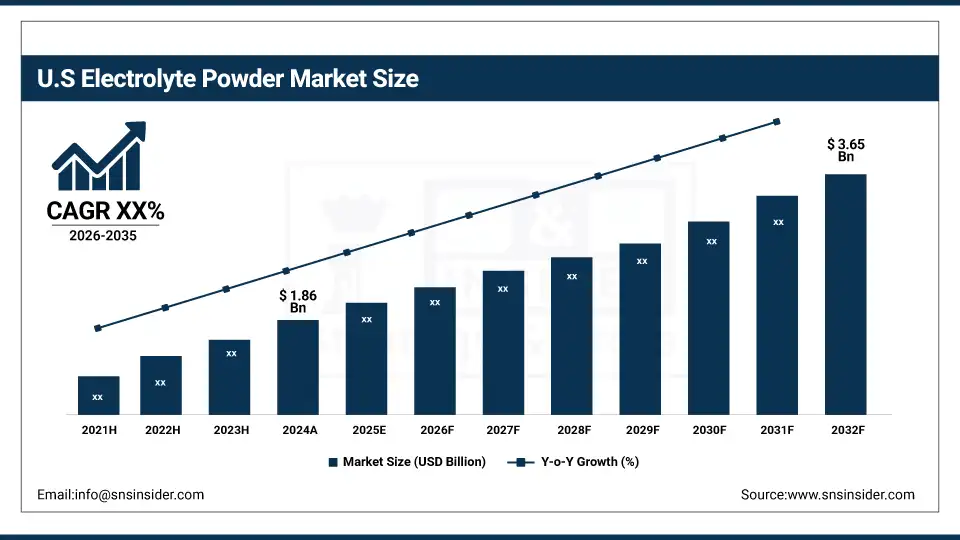
The U.S. holds the dominant Electrolyte Powder Market Share of 79% within North America, with a market size of USD 1.86 billion in 2024 and is projected to reach a value of USD 3.65 billion by 2032, owing to the strong sport culture, high wellness spending, and innovation efforts by top Electrolyte Powder Companies. And according to the USDA, per capita consumption of sports and functional beverages increased in 2023, indicating even more mainstream use of Electrolyte drinks and hydration powder (beyond the athlete) for the average person. Large U.S. companies, such as Liquid I.V. and Gatorade, launched clean-label and immunity-support Electrolyte supplements, which align with the consumer need for Electrolyte blends to be positioned as health & wellness supplements and also for daily Electrolyte replacement therapy.
Market Dynamics:
Drivers:
-
Growing Consumer Demand for Vegan and Allergen-Free Functional Powders Boosts Market Acceptance
The electrolyte powder market is gaining support from increased consumption of functional powders that are vegan, gluten-free, and allergen-free, inclusive, and cater to varied dietary preferences. With all the new electrolyte power companies popping up, some are beginning to experiment with formulas targeting health-conscious individuals who do not want any dairy, soy, or excess added sugars. The U.S. retail sales of plant-based foods grew 6.6% in 2023, observes Plant Based Foods Association, testimony to trends in the electrolyte powder market size and shifting electrolyte powder market trends toward all-inclusive, clean-label hydration powder and fitness hydration solutions.
-
Expansion Into Travel-Focused Oral Rehydration Products Increases Electrolyte Powder Market Penetration
The electrolyte powder market is growing with brands producing portable hydration powder, designed for travelers and outdoor enthusiasts. Electrolyte powder manufacturers create travel-size pack to facilitate electrolyte rehydration through travel, camping, or flight. However, the Transportation Security Administration’s 2023 revision allowing powdered drinks on board hand baggage, also fosters electrolyte powder sales. This product innovation reflects the electrolyte powder market toward a convenience format, enhancing the electrolyte powder market share, and providing functional powders and electrolyte drinks that meet lifestyle efforts.
Restraints:
-
Environmental Concerns Around Plastic Packaging Impact Perception of Electrolyte Powder Market Growth
A lack of environmental sustainability is an issue for the electrolyte powder market when it comes to plastic-heavy packaging for hydration powder and electrolyte blends, as the rising consumer demands to know what is and is not recyclable. Containers and packaging account for 28% of municipal solid waste in the U.S. every year, forcing electrolyte powder companies to use eco-friendly materials. These are the concerns that retard the growth of the electrolyte powder market, underlining the need for an environmentally friendly packaging methodology in sync with the changing electrolyte powder market trends and preservation of electrolyte powder market share.
Segmentation Analysis:
By Product Type
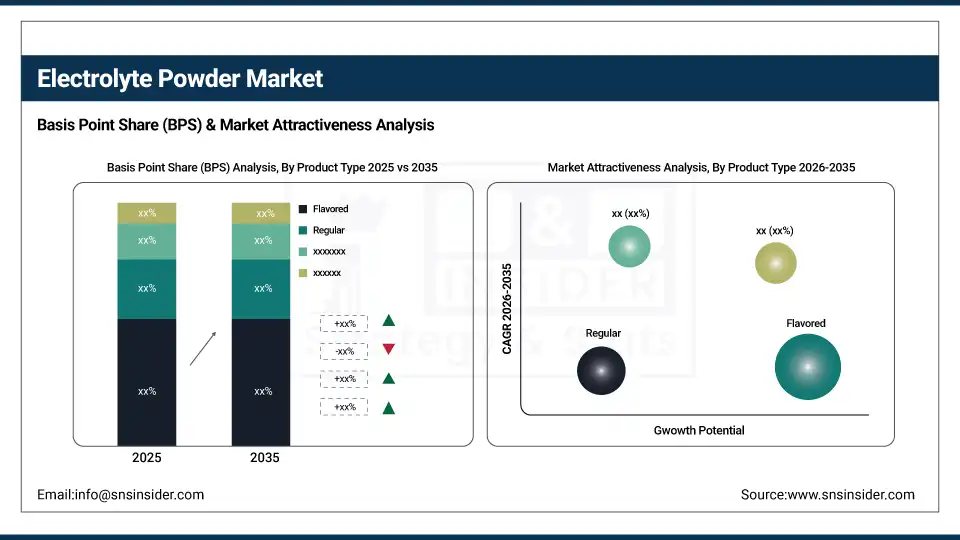
Flavored held a dominant electrolyte powder market share of 59.50% in 2024 as consumers are increasingly inclined toward flavor-enriched hydration powder. Other notable statistics from the USDA reported orange consumption was up 2% in 2023, paving the way for citrus-flavored electrolyte blends to lead the category. Companies offering electrolyte powder are investing in various subsegments of fruit in line with demand for health & wellness supplements. This approach broadens the electrolyte powder market size in flavored electrolyte drinks that cater daily hydration needs in both sports nutrition market and functional powders, further contributing to constant growth of the electrolyte powder market and wider consumer reach.
Flavored is the fastest growing in the electrolyte powder market with a CAGR of 8.57% and demand is still strong for tropical sub-flavors, such as mango and watermelon. National Mango Board campaigns helped elevate the recognition of mango in 2023, inspiring unique electrolyte combinations. Electrolyte powder firms introduce clean-label functional powders for a mass market Appeal. This tendency is confirmed by electrolyte powder market analysis, since customers are looking for health-oriented, flavor-based electrolyte supplements to improve everyday hydration and electrolyte replacement therapy, not only exclusively for sports purposes.
By Package Type
Bagged held a dominant electrolyte powder market share of 49.50% in 2024 due to resealable packaging preferred by daily and sports users. According to EPA sustainable data, the appetite for re-usable packs is influencing demand for bagged hydration powder. Electrolyte powder brands introduce their resealable functional powders packaging that is a compromise between convenience and environmental consciousness. This packaging trend is rooted in the electrolyte powder market size, catering to consumers in the fitness hydration solutions in the sports nutrition market, and wellness-focused lifestyles.
Bulk is the fastest growing in the electrolyte powder market with a CAGR of 8.82% as there is increasing use of these products in gyms, teams, and clubs. CDC hydration recommendation promotes a group-oriented electrolyte replacement, thus making a large-pack electrolyte beverage powder preferable. Electrolyte powder manufacturers cater to institutional purchasers looking for a value-priced electrolyte supplement. This is driving the growth of the electrolyte powder market, and indicating shifting electrolyte powder market trends from individual consumers to group wellness and sports nutrition.
By Application
Sports held a dominant electrolyte powder market share of 57.20% in 2024 owing to increasing product usage among endurance athletes and teams. The organization USA Track & Field reported a 3% increase in turnout at endurance events in 2023, sparking a surge of interest in specially formulated electrolyte drinks. Manufacturers operate by making functional powders for extended exertion, and this leads to the electrolyte powder market size increasing in the sports nutrition market, which include steady athlete-driven demand, and guidelines for electrolyte replacement therapy.
Fitness & gym is the fastest growing segment in the electrolyte powder market with a CAGR of 8.69% due to rising leisure training and gymnasium membership. IHRSA research reveals a robust trend line in gym attendance, driving demand for daily hydration powder. Electrolyte powder sellers focus on specific electrolyte blends aimed at health-conscious consumers, reflecting electrolyte powder market trends that reach far beyond top-level athletes and into larger wellness and health & wellness supplements industries.
By End-User
Athletes held a dominant electrolyte powder market share of 45.20% in 2024 owing to consumption during training and competition. Uptick in the demand for the hydration powder and functional powders is expected to continue, as the CDC guidelines prioritize electrolyte replacement therapy for heat stress. Electrolyte powder manufacturers concentrate on athlete-proven electrolyte supplementation, accounting for the athletes as a leading user base according to electrolyte powder market keeping the electrolyte powder industry growth stable in sports nutrition.
Fitness enthusiasts are the fastest growing in the electrolyte powder market with a CAGR of 8.68% due to an increase in recreational and fitness activity. National Recreation and Park Association notes more community fitness events, helping to drive consumption of clean-label hydration powder and functional powders. The electro powder companies are continuously innovating to cater to the new blends, which are healthful, to target health-focused customers, and to generate revenue for the company, which has increased the market size of electrolyte powder market from professional to health & wellness supplement users.
By Distribution Channel
Supermarkets/Hypermarkets held a dominant electrolyte powder market share of 44.00% in 2024 based on its wide retail packaging and consumer inclination. The Food Marketing Institute reports that more shelf space for things, such as hydration powder and electrolyte drinks, and supermarkets are becoming focal to everyday purchases. In-store promotion strategies are utilized to increase impulse purchase and planned purchasing by consumers by electrolyte powder companies to retain their market share in the mainstream consumer channels of the electrolyte powder market.
Online retail is the fastest growing in the electrolyte powder market with a CAGR of 8.88% driven by due to increasing purchasing power and high consumer demand for products available on the e-commerce platform, driven by the growth in e-commerce business and direct sales strategy. The USDA data indicates increased online shopping, and companies such as those offering electrolyte powders are expanding direct-to-consumer functional powders. Subscription options and customized electrolyte powder formulations satisfy consumer demands for convenience, tapping into market trends for customizable digital procurement of electrolyte powders.
Regional Analysis:
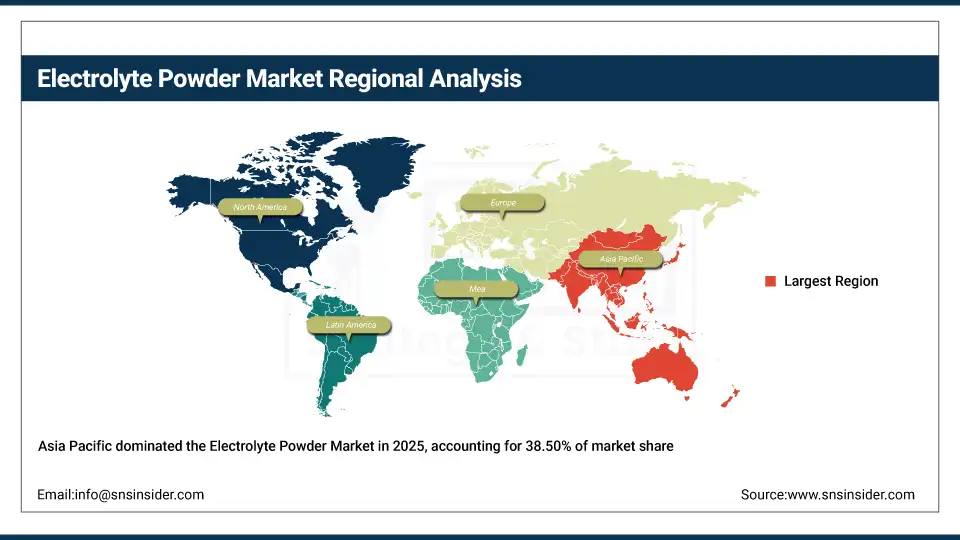
Asia Pacific dominated the electrolyte powder market with a significant market share of 38.50% in 2024 on account of high demand for hydration powder and Electrolyte blends in China, Japan, and India. China sets a growing regional pace with its hunger for sports nutrition market, whereas Japan is focused on functional powders with mineral additions. Increasing awareness and adoption of urban wellness, underpinning health & wellness supplements, and daily electrolyte replacement therapy while driving trends in an Electrolyte Powder Market Analysis are also powerfully influenced by Indian athletes and health enthusiasts.
Get Customized Report as per Your Business Requirement - Enquiry Now
North America is the fastest growing in the Electrolyte Powder Market with a CAGR of 8.85% over 2025-2032, due to the rising demand for hydration powder, electrolyte supplements, and functional powders among sports and wellness users. Sports participation rose, increasing demand for Electrolyte replacement therapy and daily Electrolyte drinks, according to the CDC. Furthermore, the introduction of novel products, such as Hydrant’s launch of its extended range of electrolyte blends in Canada to comply with clean label trends, strengthens the market outlook and brings forward arising Electrolyte Powder Market Trends within the sports nutrition market and health & wellness supplements.
Key Players:
The major electrolyte powder market competitors include Liquid I.V., Nuun Hydration, Ultima Replenisher, Skratch Labs, LMNT, DripDrop, Hydrant, GU Energy Labs, Hammer Nutrition, Science In Sport (SIS), High5 Sports Nutrition, Vitalyte, Nutrend, Isagenix International, Nutrabolt, LyteLine, Key Nutrients, NutriBiotic, SOS Hydration, and Sports Research.
Recent Developments:
-
In June 2025, Skratch Labs released its seasonal Passion Fruit + Orange + Guava Hydration Sport Drink Mix. This limited‑edition summer flavor uses real fruit and mirrors sweat‑lost electrolytes to support endurance performance.
-
In September 2024, Gatorade introduced Gatorade Hydration Booster powder for all‑day hydration. Developed by the Gatorade Sports Science Institute, it provides an advanced electrolyte blend plus 100% DV of vitamins A, B3, B5, B6, and C, with no artificial colors or sweeteners.
| Report Attributes | Details |
|---|---|
| Market Size in 2024 | USD 8.68 billion |
| Market Size by 2032 | USD 16.62 billion |
| CAGR | CAGR of 8.46% From 2025 to 2032 |
| Base Year | 2024 |
| Forecast Period | 2025-2032 |
| Historical Data | 2021-2023 |
| Report Scope & Coverage | Market Size, Segments Analysis, Competitive Landscape, Regional Analysis, DROC & SWOT Analysis, Forecast Outlook |
| Key Segments | •By Product Type (Regular, Flavored, Others) •By Package Type (Bulk, Bagged, Canned, Others) •By Application (Sports, Fitness & Gym, Others) •By End User (Athletes, Fitness Enthusiasts, General Consumers, Others) •By Distribution Channel (Supermarkets/Hypermarkets, Convenience Stores, Online Retail, Specialty Stores, Others) |
| Regional Analysis/Coverage | North America (US, Canada, Mexico), Europe (Germany, France, UK, Italy, Spain, Poland, Turkey, Rest of Europe), Asia Pacific (China, India, Japan, South Korea, Singapore, Australia, Rest of Asia Pacific), Middle East & Africa (UAE, Saudi Arabia, Qatar, South Africa, Rest of Middle East & Africa), Latin America (Brazil, Argentina, Rest of Latin America) |
| Company Profiles | Liquid I.V., Nuun Hydration, Ultima Replenisher, Skratch Labs, LMNT, DripDrop, Hydrant, GU Energy Labs, Hammer Nutrition, Science In Sport (SIS), High5 Sports Nutrition, Vitalyte, Nutrend, Isagenix International, Nutrabolt, LyteLine, Key Nutrients, NutriBiotic, SOS Hydration, and Sports Research |
Frequently Asked Questions
Growing sports nutrition market demand, athlete-focused functional powders, and broader electrolyte replacement therapy adoption boost electrolyte powder consumption worldwide.
Supermarkets/Hypermarkets dominate electrolyte powder sales, holding 44.00% market share, supported by strong retail presence and in-store promotion strategies.
Asia Pacific dominates the Electrolyte Powder Market with 38.50% share, while North America is the fastest growing region through 2032.
Rising demand for hydration powder, functional powders, clean-label electrolyte blends, and health & wellness supplements drives steady Electrolyte Powder Market growth globally.
The Electrolyte Powder Market size was valued at USD 8.68 billion in 2024 and is projected to reach USD 16.62 billion by 2032.
Get in Touch
