Biogas Market Report Scope and Overview:
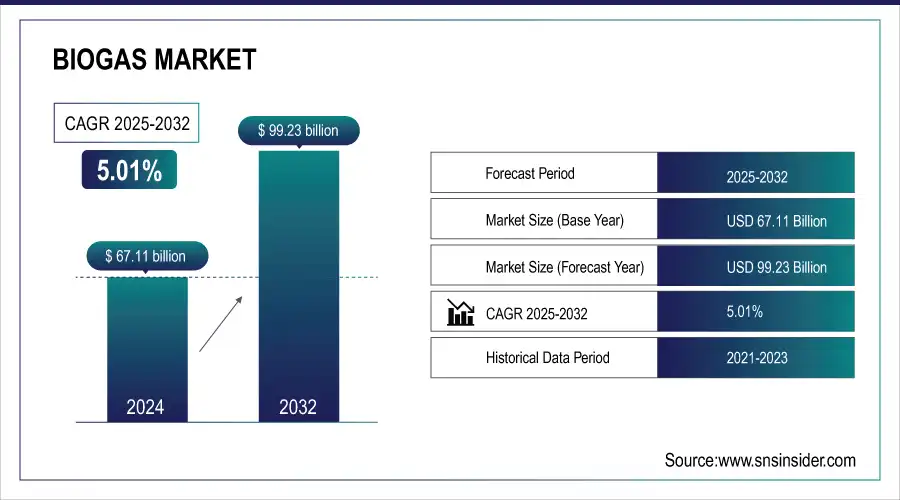
The Biogas Market Size was valued at USD 67.11 billion in 2024 and is expected to reach USD 99.23 billion by 2032, and grow at a CAGR of 5.01% over the forecast period 2025-2032.
The biogas market had been gaining momentum and was reflecting its potential contribution toward overcoming energy and environmental problems with the use of it as a substitute fuel for fossil fuels. Several other market dynamics have supported these growth-increasing investments in the infrastructure of biogas, improvement in technology, and rising awareness about renewable energy solutions. Recent developments have underlined vitality within the sector and its role in global energy transition strategies.
A prevalent market trend is the rise in production in the field of biogas, as forecasted by the International Energy Agency. The IEA projects that, with higher demands on energy and the drive toward cleaner sources of it, the sector of biogas will grow by 32% over the coming years. Such optimism has emerged due to infrastructural expansions and improved technologies dealing with biogas. The biogas production efficiency and its usage are also being refined by innovations, making it a more viable and respectable source of energy.
Recent technological advances in biogas systems have been imperative. For instance, Weltec Biopower has just introduced a new use control interface for biogas plants that greatly enhances the management and monitoring of biogas production. The new interface allows much finer control and optimization of the whole process of production of biogas, thus improving operational efficiency. Such innovation has a key role in enhancing performance in biogas facilities to make them more economically viable, which again propels the market.
Get more information on Biogas Market - Request Sample Report
Biogas Market Size and Forecast:
-
Market Size in 2024: USD 67.11 Billion
-
Market Size by 2032: USD 99.23 Billion
-
CAGR from 2025 to 2032: 5.01%
-
Base Year: 2024
-
Forecast Period: 2025–2032
-
Historical Data: 2021–2023
Biogas Market Highlights:
-
Technological innovations including advanced anaerobic digestion, co-digestion processes, automated management, IoT, and biogas upgrading technologies improve efficiency, yields, and cost-effectiveness, enhancing market adoption
-
Investment growth from public and private sectors, including grants, subsidies, and corporate funding, drives infrastructure expansion and large-scale biogas projects globally
-
Energy security and geopolitical drivers make biogas crucial for sustainable energy strategies by supporting stability in conflict zones and reducing dependency on fossil fuels
-
Corporate adoption by companies like Duvenbeck shows reduced carbon footprints and promotes sustainability through use of biogas in operations and transportation
-
Market restraints include high capital requirements for plant setup, particularly in developing regions, which limit market expansion despite strong demand
-
Opportunities arise from rising global demand for renewable energy, waste-to-energy potential, and sustainability initiatives, creating significant growth across sectors and regions
Geopolitical factors and humanitarian needs are also causing growth in the biogas market. Bioenergy Association of Ukraine pointed out that biogas infrastructures are urgent in times of conflict in the region. This is a situation where the contribution of biogas to energy security and stability becomes highly relevant. Support for biogas infrastructure in Ukraine is part of a greater call that particularly recognizes the resource as essential for achieving sustainability in energy, especially for crisis-torn parts of the world.
Recent developments in Denmark included the upgrading by HOFOR to a wastewater treatment plant that increased its production of biogas. This new system is designed to capture more biogas from wastewater and indicates a commitment toward enhanced renewable energy output with lower dependency on fossil fuels. This is one such project illustrating how cities and municipalities work their way out to improve energy sustainability, reduce environmental impact, and adopt biogas technology.
Duvenbeck replaced a large part of its long-distance transport with biogas. By using biogas as fuel for its fleet, it thus contributes to a reduced carbon footprint and shows the still very diverse utilisations of biogas. This again underlines a wider trend where companies include biogas in their operations to reach goals that have been set by sustainability strategies and to further increase the deployment of biogas technology.
These combine to give a dynamic and ever-changing biogas market. Biogas is fast developing and becoming an important factor in the global energy scenario due to technological changes, geopolitical considerations, and sectoral applications.
Biogas Market Drivers:
-
Innovations in biogas technology, such as improved production and management systems, enhance efficiency and lower costs, driving market growth.
The innovation in biogas technologies will enhance the efficiency and cost-effectiveness of biogas production, hence driving the growth in the market. Advanced technologies have considerably increased biogas yields and operational efficiency in areas such as enhanced anaerobic digestion processes, co-digestion processes, and automated management systems. An example would be a high-performance digester development, with enhanced mixing and heating systems. These enable better degradation of organic material and hence increased rates of biogas production. These innovative modifications not only increase the overall yield but also save time and resources used in the processing. Additionally, in-plant real-time data analytics and IoT technologies within the automated management system let operators remotely monitor and optimize the production process for maximum minimization of downtimes and improvement in scheduled maintenance. These systems also allow better management of waste through integration with the existing infrastructure on organic waste handling. Sophisticated sensors and control systems have been installed in biogas plants, for example, which can dynamically adjust operational parameters to optimize the digestion process and further increase gas yields. New biogas upgrading technologies, namely membrane separation and pressure swing adsorption, on the other hand, make possible high-quality levels of biogas purifying for a wide range of applications, from electricity generation to vehicle fuel. This renders biogas a more versatile and attractive source of energy. Collectively, these technologies reduce operational costs, increase production efficiency, and also enhance the economic viability of biogas projects, which eventually accelerates market growth and adoption.
-
Growing investments in biogas infrastructure from both public and private sectors support expansion and development in the market.
The increase in the investment of public and private sectors in biogas infrastructure is thus an important driver of market growth and development. Increased funds and financial support enable the installation and scaling up of biogas plants, which are key to increased production capacity and improvement in technology. Public sector investment can include grants, subsidies, and incentives for renewable projects. Such financial supports lessen the initial burden of capital for biogas facility establishment and help innovation in technology. Besides, venture capital from the private sector and corporate funding provide the necessary resources for research and development in advanced biogas technologies and infrastructure. The companies investing in biogas projects will profit through better profitability because of the economy of scale and value addition from the technology. The same companies offer sustainability in energy supplies. Large corporations and energy companies have invested in large-scale biogas plants using agricultural waste and municipal solid waste to convert it into worthy energy resources. Government-private partnerships often produce public-private initiatives by using combined resources for more expansive projects on biogas production. This collaborative approach can therefore accelerate the uptake of biogas technologies in most regions, creating demand and a more developed biogas market. The investment flow from the two industries also creates the necessary supporting infrastructure, such as pipeline delivery systems for biogas and processing facilities to upgrade biogas into high-quality renewable natural gas. In this respect, increasing investments becomes very important to enhance capacity in the biogas sector and simultaneously contribute to market growth while opening opportunities toward greener energy systems.
Biogas Market Restraints:
-
The substantial capital required for setting up biogas plants can deter investments, limiting market expansion, especially in developing regions.
The high capital investment required to establish biogas plants acts as one of the key restraining factors, especially affecting market growth across developing regions. The initial cost of infrastructure, technology, and setting up operations may be unaffordable for many stakeholders. Building and equipping a biogas plant with anaerobic digesters, gas storage systems, and purification units alone may be slated to cost several million dollars. This high upfront expenditure then becomes an obstacle to medium and small enterprises, or even the local governments of less well-off regions, which may not have financial resources or even access to credit. As a result, the impossibility of getting proper funding can prevent or delay biogas projects, making them less available and accessible for the benefits thereof in those areas. For example, in developing countries, investment in biogas plants may be too low in rural areas. In this respect, if such crucial investment is not performed, valuable local resources of organic waste will not be converted into an asset and will impede the opportunities for alternative energy development. The bottom line is that this financial burden eventually reduces overall growth in the biogas market by placing barriers around the deployment of technology and infrastructure in those areas that have a huge demand for renewable energy solutions.
Biogas Market Opportunities:
-
Rising global demand for renewable energy sources provides a significant opportunity for biogas to replace fossil fuels and contribute to cleaner energy solutions.
The global demand for renewable sources of energy is on the increase, providing a great avenue for biogas to importantly contribute to the replacement of fossil fuels and further develop cleaner energy. As countries and companies across the world pledged to cut greenhouse gas emissions and move from traditional sources of energy, biogas has become an option given that this form of energy is renewable and can minimize carbon footprint. Locally produced, for example, in countries where agricultural or organic waste is rich, biogas can be produced. This would provide a clean source of energy while simultaneously helping to take care of waste management. The increased focus on sustainability and energy security encourages investment in infrastructure and technologies that involve biogas, possibly answering increased energy demand with less environmental impact. This shift towards renewable energy sources is further encouraging research and development in biogas technologies, making it more efficient for use in areas like electricity generation, heating, and transportation fuels. In this respect, the global thrust toward cleaner energy provides a conducive climate for the growth of biogas to meet broader goals of sustainable development and energy diversification.
Biogas Market Segment Analysis:
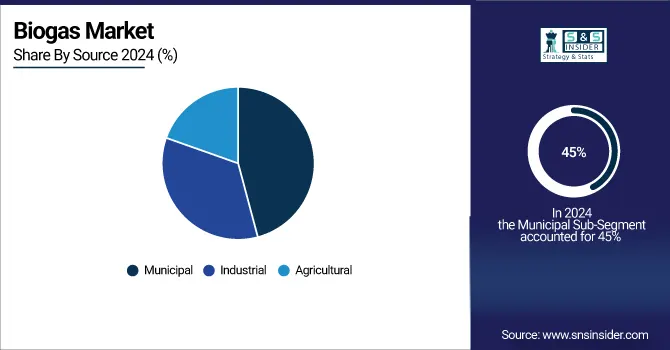
By Source
In 2024, the Municipal segment dominated the biogas market, with a share of about 45% in the biogas market. The dominance of the segment is attributed to the fact that a colossal amount of organic waste comes from urban areas acting as a feedstock for producing biogas. Landfill and wastewater treatment plants from municipal sources have been reliable and continuous supplies of organic materials; therefore, they are preferred sources for projects on biogas production. The anaerobic digestion systems can be implemented in municipal wastewater treatment plants to handle sewage sludge and produce biogas from organic waste, which can further be used in electricity generation and heating. Moreover, landfill gas recovery projects capture methane emanation from the decaying waste and turn it into different types of valuable energy. These diverse applications not only help manage municipal waste but also reduce greenhouse gas emissions, strengthening the leading position of the segment in the market.
By Application
In 2024, the Electricity segment dominated the biogas market and accounted for a market share of about 50%. This is due to the wide use of biogas systems for generating electricity, which uses the renewable energy source of biogas to produce steady and highly reliable power. Biogas plants convert methane into electricity through combined heat and power systems, heavily utilized in industrial and municipal contexts. For instance, many wastewater treatment plants and farms use biogas for generators that produce electricity by reducing their reliance on fossil fuels, hence contributing to grid stability. The fact that biogas can easily integrate with the existing energy infrastructure adds to its desirability to become a source of reliable energy and further secures its place in the biogas market.
Biogas Market Regional Analysis:
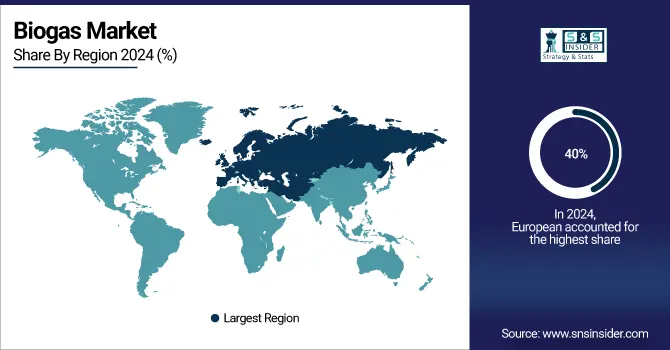
Europe Biogas Market Trends:
In 2024, the European region dominated the biogas market and accounted for about 40% of the market share. Strong commitment toward renewable energy combined with stringent environmental regulations propels the leadership of Europe in the market. Major countries like Germany, the UK, and Sweden have been at the frontline in adopting biogas technology with favorable policies, huge investments, and developed infrastructure. For example, the extensive network of biogas plants in Germany is largely integrated with agricultural business and municipal waste management systems, thus demonstrating the positive attitude of the region toward renewable energy. In addition, the incentives and subsidies offered by the European Union toward projects related to biogas fuel market growth, since these extra incentives boost the development and deployment of the technology throughout the continent. This also fortifies the leading position of Europe in the global marketplace.
Get Customized Report as per your Business Requirement - Request For Customized Report
North America Biogas Market Trends:
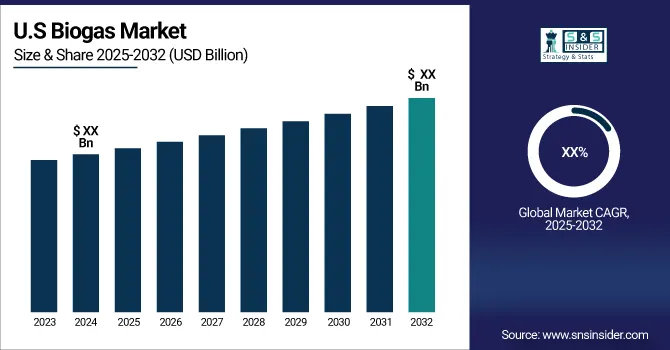
In 2024, North America held a significant share of the biogas market. The U.S. and Canada are leading adoption, driven by supportive government initiatives, renewable energy targets, and strong R&D investments. Agricultural residues, landfill gas recovery, and wastewater treatment projects enhance biogas production. Policies such as tax credits and grants further accelerate deployment, strengthening the region’s market presence.
Asia-Pacific Biogas Market Trends:
Asia-Pacific is emerging as a high-growth region in 2024, with China, India, Japan, and South Korea leading adoption. Rapid industrialization, rising energy demand, and environmental concerns are key growth drivers. Government incentives, renewable energy mandates, and infrastructure development support market expansion, while agricultural and livestock sectors provide strong potential for biogas production.
Latin America Biogas Market Trends:
In Latin America, Brazil, Argentina, and Mexico are the main contributors to the biogas market. Agricultural waste utilization and sugarcane/ethanol industries drive adoption. Regional policies and subsidies encourage renewable energy projects, while opportunities exist in rural energy access and waste-to-energy initiatives, reinforcing the region’s growing role in the global biogas market.
Middle East & Africa Biogas Market Trends:
Middle East & Africa witnessed gradual growth in 2024, with South Africa, UAE, and Saudi Arabia leading the market. Government initiatives toward renewable energy diversification and sustainability support biogas adoption. Municipal solid waste and agricultural residues are key sources for production. Despite infrastructure gaps and high initial investments, the region shows potential for long-term market expansion.
Biogas Market Key Players:
-
Agrinz Technologies GmbH
-
DMT International
-
Gasum Oy
-
HomeBiogas Inc.
-
Scandinavian Biogas Fuels International AB
-
Schmack Biogas Service
-
Total Xebec Adsorption Inc.
-
WELTEC BIOPOWER
-
BTS-biogas
-
Xergi A/S
-
Anaergia Inc.
-
Bioenergy Devco
-
Biogas Technology Ltd.
-
Greener Energy Systems
-
MT-Energie GmbH
-
Future Biogas Ltd.
-
Gas Technology Institute (GTI)
Biogas Market Competitive Landscape:
Anaergia Founded in 2005,is a global leader in renewable energy and waste-to-value solutions. The company specializes in biogas, organic waste recycling, and resource recovery technologies, providing sustainable solutions for municipalities, industries, and agriculture. Anaergia drives circular economy initiatives while promoting environmental sustainability worldwide.
-
September 2024: Anaergia received a contract to build a biogas plant in South Korea, further enhancing the nation's renewable energy infrastructures and waste management potential.
1Vision Biogas AB Established in 2023 is a joint venture between St1, HitecVision, and Aneo, headquartered in Sweden. The company aims to become the leading biogas provider in the Nordic region by operating the entire biogas value chain—from feedstock sourcing to sales and distribution. With over 550 GWh of biomethane production capacity and several growth projects in Sweden, Norway, and Finland, 1Vision Biogas is committed to investing more than €1 billion in biogas production and distribution networks in the Nordic countries.
-
September 2024: 1Vision Biogas plans to be the leading biogas company in Nordics by applying strategic expansions and technology innovations.
GreenGas USA Founded in 2019 is a Charleston, South Carolina-based company specializing in renewable natural gas (RNG) production from agricultural waste. Utilizing anaerobic digestion technology, the company captures methane emissions from organic waste to produce clean, transportable RNG. GreenGas USA partners with agribusinesses like Perdue Farms and McCall Farms to implement methane capture systems, transforming waste lagoons into energy assets. The company has expanded its operations to multiple U.S. states, including South Carolina, North Carolina, Kentucky, and Florida.
-
August 2024: GreenGas USA partners to turn on renewable natural gas production at its farm portfolio to contribute to cleaner energy in agriculture.
Future Biogas Founded in 2010 is a leading UK-based developer and operator of anaerobic digestion (AD) plants. Headquartered in Guildford, Surrey, the company manages 12 large-scale AD facilities across Eastern and North-Eastern England, collectively valued at over £120 million. Future Biogas specializes in converting organic waste into renewable energy, offering comprehensive services including construction, commissioning, optimization, operations, maintenance, and compliance with environmental standards. In 2023, the company was acquired by 3i Infrastructure plc, positioning it for sustained growth in the renewable energy sector
-
August 2024: Future Biogas has acquired six anaerobic digestion plants which will significantly increase its production capacity and further solidify its position in the biomethane market.
| Report Attributes | Details |
|---|---|
| Market Size in 2024 | USD 67.11 Billion |
| Market Size by 2032 | USD 99.23 Billion |
| CAGR | CAGR of 5.01% From 2025 to 2032 |
| Base Year | 2024 |
| Forecast Period | 2025-2032 |
| Historical Data | 2021-2023 |
| Report Scope & Coverage | Market Size, Segments Analysis, Competitive Landscape, Regional Analysis, DROC & SWOT Analysis, Forecast Outlook |
| Key Segments | •By Source (Municipal [Landfill, Wastewater], Industrial [Food Scrap, Wastewater], Agricultural [Poultry, Swine Farm, Dairy, Agricultural Residue] •By Application (Vehicle Fuel, Electricity, Heat, Cooking Gas, Others) |
| Regional Analysis/Coverage | North America (US, Canada, Mexico), Europe (Eastern Europe [Poland, Romania, Hungary, Turkey, Rest of Eastern Europe] Western Europe] Germany, France, UK, Italy, Spain, Netherlands, Switzerland, Austria, Rest of Western Europe]), Asia Pacific (China, India, Japan, South Korea, Vietnam, Singapore, Australia, Rest of Asia Pacific), Middle East & Africa (Middle East [UAE, Egypt, Saudi Arabia, Qatar, Rest of Middle East], Africa [Nigeria, South Africa, Rest of Africa], Latin America (Brazil, Argentina, Colombia, Rest of Latin America) |
| Company Profiles | Agrinz Technologies GmbH, Air Liquide, DMT International, Gasum Oy, HomeBiogas Inc., PlanET Biogas, Scandinavian Biogas Fuels International AB, Schmack Biogas Service, Total Xebec Adsorption Inc., EnviTec Biogas AG, WELTEC BIOPOWER, BTS-biogas and other key players |
| Key Drivers | • Innovations in biogas technology, such as improved production and management systems, enhance efficiency and lower costs •Growing investments in biogas infrastructure from both public and private sectors support expansion and development in the market |
| Restraints | • The substantial capital required for setting up biogas plants can deter investments, limiting market expansion, especially in developing regions |
Frequently Asked Questions
The Biogas Market is expected to grow at a CAGR of 5.01%.
The Biogas Market Size was valued at USD 67.11 billion in 2024 and is expected to reach USD 99.23 billion by 2032
Rising global demand for renewable energy sources provides a significant opportunity for biogas to replace fossil fuels and contribute to cleaner energy solutions.
Navigating complex regulatory environments and obtaining necessary permits can pose significant challenges for biogas projects, affecting market growth and implementation.
The Europe region dominated the Biogas market holding the largest market share of about 40% during the forecast period.
Get in Touch
