Electronic Warfare Market Report Scope & Overview:

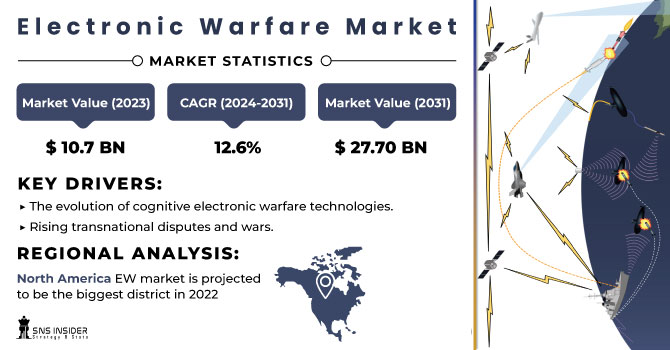
The Electronic Warfare Market Size was valued at USD 12.04 billion in 2024, is expected to reach USD 31.13 billion by 2032 and grow at a CAGR of 12.6% over the forecast period 2025-2032.

The advancement of modern electromagnetic spectrum technologies challenges military operations in an information-reliant environment. With the development in electronic threats, there is a greater requirement for electronic warfare to support unhindered access to electromagnetic environment defense activities. Electronic warfare is a major component of information warfare and is used in both offensive and defensive counter-information operations. Electronic warfare policy and doctrine have been developed and embraced by nations all over the world. Infrared and radio frequency countermeasures, electronic masking, electronic security, electronic counter-countermeasures, and anti-jamming capabilities are all part of electronic warfare efforts.

Electronic Warfare Market Revenue Analysis

To get more information on Electronic Warfare Market - Request Free Sample Report

During the projected period, the worldwide electronic warfare market is expected to grow due to an increase in innovations and the creation of new warfare. The Iranian Army Ground Force's Research and Self-Sufficiency Jihad Organization, for example, debuted a plethora of electronic warfare and other electronic equipment. The combat technologies would be deployed to safeguard Iranian drones in enemy territory as well as to disrupt opposing drones. With the rising threat of hostile drones and remotely activated IEDs, investments in electronic warfare equipment for defence against such threats have surged. Edge Group, for example, launched Nav-Control-G, a specialist counter-drone capability, and V-Protect, a radio frequency communication jamming technology. Electronic warfare systems protect Iranian VIPs and key commanders on the move.

Market Size and Forecast:

  • Market Size in 2024 USD 12.04 Billion

  • Market Size by 2032 USD 31.13 Billion

  • CAGR of 12.6% From 2025 to 2032

  • Base Year 2024

  • Forecast Period 2025-2032

  • Historical Data 2021-2023

Electronic Warfare Market Trends:

  • Increasing adoption of AI-driven cognitive electronic warfare systems to counter evolving electronic threats.

  • Growing reliance on immersive simulations and training solutions amid rising global disputes.

  • Development of modular, interoperable systems to reduce high costs and integration challenges.

  • Intensified R&D in next-generation air and missile defense to address advanced threats.

  • Integration of automation and digital warfare tools for improved situational awareness and battlefield dominance.

Electronic Warfare Market Growth Drivers:

The immersive content creation market is propelled by two major drivers: the evolution of cognitive electronic warfare technologies, which demand advanced simulation and training tools, and the rising transnational disputes and wars, increasing the need for immersive defense applications. Together, these factors accelerate adoption across defense, security, and training sectors, enhancing situational awareness, preparedness, and mission effectiveness in complex environments.

Electronic Warfare Market Restraints:

The electronic warfare market faces restraints such as high development and deployment costs, which limit accessibility for smaller defense budgets. Integration challenges with existing legacy systems and the complexity of maintaining advanced electronic systems also hinder adoption. Additionally, strict regulatory frameworks and export restrictions on sensitive technologies slow global expansion, affecting the pace of innovation and deployment.

Electronic Warfare Market Opportunities:

The electronic warfare market presents significant opportunities through increasing research and development of next-generation air and missile defense systems, aimed at countering evolving threats. Advancements in enhanced warfare technology, including AI-driven solutions, cognitive systems, and advanced signal processing, further create avenues for growth. These innovations enable stronger defense capabilities, improved threat detection, and strategic advantages in modern military operations.

Electronic Warfare Market Segment Analysis:

By Capability

In 2024, the attack segment dominated the electronic warfare market with around 46% share, driven by rising transnational conflicts and demand for offensive capabilities. Looking ahead, the protection segment is expected to grow at the fastest CAGR from 2025–2032, fueled by increasing investments in advanced defense systems and the need for safeguarding communication and critical assets.

By Product

In 2024, jammers dominated the electronic warfare product market with approximately 28% share, driven by widespread requirements for signal disruption and legacy platform integration. From 2025–2032, counter-UAV systems are forecast to record the highest CAGR, propelled by rapid drone proliferation, heightened asymmetric threats, and accelerated investment in detection and mitigation technologies.

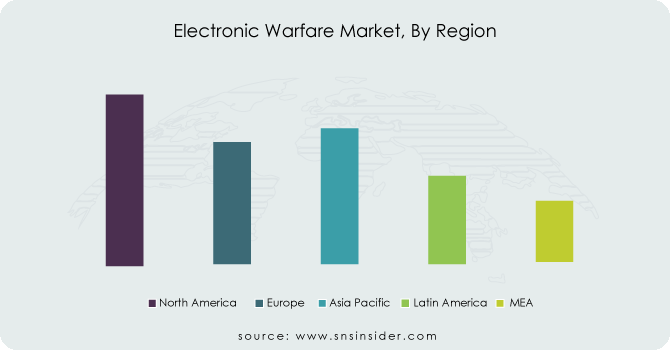
Electronic Warfare Market Regional Analysis:

North America Electronic Warfare Market Insights

North America EW market is projected to be the biggest district in 2022 attributable to the high speculations by the U.S. Branch of Defense in the extension of EW frameworks. The U.S. DoD is supposed to put USD 25.8 billion in research, improvement, test, and assessment and USD 27.8 billion in acquirement all through the guard program. In addition, the market in the locale is expected to develop because of elements like regional questions, political debates, and expanded psychological oppression. Followed by North America, Europe is supposed to be the second-biggest district because of an ascent in interest in EW framework obtainment and improvement. Furthermore, a portion of the key market players, for example, Thales Group, BAE Systems, and Saab AB in the district are expected to fuel the development of the market.

Asia Pacific Electronic Warfare Market Insights

Asia-Pacific is anticipated to be the quickest developing district during the gauge time frame because of the fast development in interests in nations, for example, China and India to foster mechanically progressed frameworks and improve their warfighting abilities. China is zeroing in on the modernization of its powers and building strong air bases and maritime armadas. As of late, the arising clashes between China and the U.S. have driven the nations to fortify their safeguard.

Europe Electronic Warfare Market Insights

Europe’s electronic warfare market is driven by rising regional security threats, NATO modernization programs, and investments in advanced defense technologies. Countries such as the U.K., Germany, and France are prioritizing electronic protection and attack systems to strengthen air and missile defense. Strong collaboration among European defense firms further accelerates innovation and market growth.

Latin America (LATAM) and Middle East & Africa (MEA) Electronic Warfare Market Insights

The LATAM and MEA electronic warfare markets are expanding steadily, supported by growing defense modernization programs and rising geopolitical tensions. In Latin America, countries like Brazil focus on strengthening surveillance and communication security. Meanwhile, Middle Eastern and African nations prioritize counter-UAV systems and advanced radar warning receivers to address escalating border threats and asymmetric warfare challenges.

Electronic-Warfare-Market-By-Region

Need any customization research on Electronic Warfare Market - Enquiry Now


KEY PLAYERS

Raytheon Technologies Corporation-Company Financial Analysis

Electronic Warfare Market Report Scope:

Report Attributes Details
Market Size in 2024 USD 12.04 Billion
Market Size by 2032 USD 31.13 Billion
CAGR CAGR of 12.6% From 2025 to 2032
Base Year 2024
Forecast Period 2025-2032
Historical Data 2021-2023
Report Scope & Coverage Market Size, Segments Analysis, Competitive  Landscape, Regional Analysis, DROC & SWOT Analysis, Forecast Outlook
Key Segments • By Category (Electronic Attack, Electronic Support and Electronic Protection)
• By Capability (Support, Attack, Protection)
• By Product (Jammers, Countermeasure System, Decoy, Directed Energy Weapon, Antennas, Direction Finders, Laser Warning Systems, Radar Warning Receivers, Counter UAV Systems, Electromagnetic Pulse (EMP) Weapons, Others)
• By Platform (Land, Naval, Airborne, and Space)
Regional Analysis/Coverage North America (US, Canada), Europe (Germany, UK, France, Italy, Spain, Russia, Poland, Rest of Europe), Asia Pacific (China, India, Japan, South Korea, Australia, ASEAN Countries, Rest of Asia Pacific), Middle East & Africa (UAE, Saudi Arabia, Qatar, South Africa, Rest of Middle East & Africa), Latin America (Brazil, Argentina, Mexico, Colombia, Rest of Latin America).
Company Profiles BAE Systems, Raytheon Technologies Corporation, Thales Group, Northrop Grumman Corporation, HENSOLDT, Boeing, General Dynamics Corporation, Lockheed Martin Corporation, Leonardo SpA, Saab AB, and other players.

Table Of Contents

1. Introduction

1.1 Market Definition & Scope

 1.2 Research Assumptions & Abbreviations

 1.3 Research Methodology

2. Executive Summary

2.1 Market Snapshot

 2.2 Market Absolute $ Opportunity Assessment & Y-o-Y Analysis, 2021–2032

 2.3 Market Size & Forecast, By Segmentation, 2021–2032

  2.3.1 Market Size By Capability

  2.3.2 Market Size By Product

  2.3.3 Market Size By Platform

 2.4 Market Share & Bps Analysis By Region, 2024

 2.5 Industry Growth Scenarios – Conservative, Likely & Optimistic

 2.6 Industry CxO’s Perspective

3. Market Overview

3.1 Market Dynamics

  3.1.1 Drivers

  3.1.2 Restraints

  3.1.3 Opportunities

  3.1.4 Key Market Trends

 3.2 Industry PESTLE Analysis

 3.3 Key Industry Forces (Porter’s) Impacting Market Growth

 3.4 Industry Supply Chain Analysis

  3.4.1 Raw Material Suppliers

  3.4.2 Manufacturers

  3.4.3 Distributors/Suppliers

  3.4.4 Customers/End-Users

 3.5 Industry Life Cycle Assessment

 3.6 Parent Market Overview

 3.7 Market Risk Assessment

4. Statistical Insights & Trends Reporting

4.1 Efficiency & Performance Metrics

4.1.1 Average detection and jamming range (km) of electronic warfare systems

4.1.2 Average response time (ms) for threat detection and countermeasure deployment

4.1.3 Average reduction (%) in radar cross-section (RCS) achieved with EW countermeasures

4.2 Adoption & Deployment Trends

4.2.1 Share of adoption by platform type (airborne, naval, land, space-based) (%)

4.2.2 Year-on-year growth (%) in EW system procurement across regions

4.2.3 Share of EW systems deployed in defense vs homeland security applications (%)

4.3 Technology & Integration Metrics

4.3.1 Share of EW systems integrated with AI/ML for adaptive threat recognition (%)

4.3.2 Average bandwidth (GHz) coverage of modern EW systems

4.3.3 Share of platforms with cyber-electronic warfare convergence capabilities (%)

4.4 Operational & Cost Efficiency Benchmarks

4.4.1 Average reduction (%) in mission risk through EW deployment

4.4.2 Average lifecycle cost savings (%) from modular/open-architecture EW systems

4.4.3 Average interoperability rate (%) of EW systems with NATO/Allied platforms

5. Electronic Warfare Market Segmental Analysis & Forecast, By Capability, 2021 – 2032, Value (USD Billion)

5.1 Introduction

 5.2 Support

  5.2.1 Key Trends

  5.2.2 Market Size & Forecast, 2021 – 2032

 5.3 Attack

 5.4 Protection

6. Electronic Warfare Market Segmental Analysis & Forecast, By Product, 2021 – 2032, Value (USD Billion)

    6.1 Introduction

 6.2 Jammers

  6.2.1 Key Trends

  6.2.2 Market Size & Forecast, 2021 – 2032

 6.3 Countermeasure System

 6.4 Decoy

 6.5 Directed Energy Weapon

 6.6 Antennas

 6.7 Direction Finders

 6.8 Laser Warning Systems

 6.9 Radar Warning Receivers

 6.10 Counter UAV Systems

 6.11 Electromagnetic Pulse (EMP) Weapons

 6.12 Others

7. Electronic Warfare Market Segmental Analysis & Forecast, By Platform, 2021 – 2032, Value (USD Billion)

    7.1 Introduction

 7.2 Land

  7.2.1 Key Trends

  7.2.2 Market Size & Forecast, 2021 – 2032

 7.3 Naval

 7.4 Airborne

 7.5 Space

8. Electronic Warfare Market Segmental Analysis & Forecast By Region, 2021 – 2025, Value (USD Billion)

8.1 Introduction

8.2 North America

 8.2.1 Key Trends

 8.2.2 Electronic Warfare Market Size & Forecast, By Capability, 2021 – 2032

 8.2.3 Electronic Warfare Market Size & Forecast, By Product, 2021 – 2032

 8.2.4 Electronic Warfare Market Size & Forecast, By Platform, 2021 – 2032

 8.2.5 Electronic Warfare Market Size & Forecast, By Country, 2021 – 2032

  8.2.5.1 USA

   8.2.5.1.1 Electronic Warfare Market Size & Forecast, By Capability, 2021 – 2032

   8.2.5.1.2 Electronic Warfare Market Size & Forecast, By Product, 2021 – 2032

   8.2.5.1.3 Electronic Warfare Market Size & Forecast, By Platform, 2021 – 2032

  8.2.5.2 Canada

   8.2.5.2.1 Electronic Warfare Market Size & Forecast, By Capability, 2021 – 2032

   8.2.5.2.2 Electronic Warfare Market Size & Forecast, By Product, 2021 – 2032

   8.2.5.2.3 Electronic Warfare Market Size & Forecast, By Platform, 2021 – 2032

8.3 Europe

 8.3.1 Key Trends

 8.3.2 Electronic Warfare Market Size & Forecast, By Capability, 2021 – 2032

 8.3.3 Electronic Warfare Market Size & Forecast, By Product, 2021 – 2032

 8.3.4 Electronic Warfare Market Size & Forecast, By Platform, 2021 – 2032

 8.3.5 Electronic Warfare Market Size & Forecast, By Country, 2021 – 2032

  8.3.5.1 Germany

   8.3.5.1.1 Electronic Warfare Market Size & Forecast, By Capability, 2021 – 2032

   8.3.5.1.2 Electronic Warfare Market Size & Forecast, By Product, 2021 – 2032

   8.3.5.1.3 Electronic Warfare Market Size & Forecast, By Platform, 2021 – 2032

  8.3.5.2 UK

   8.3.5.2.1 Electronic Warfare Market Size & Forecast, By Capability, 2021 – 2032

   8.3.5.2.2 Electronic Warfare Market Size & Forecast, By Product, 2021 – 2032

   8.3.5.2.3 Electronic Warfare Market Size & Forecast, By Platform, 2021 – 2032

  8.3.5.3 France

   8.3.5.3.1 Electronic Warfare Market Size & Forecast, By Capability, 2021 – 2032

   8.3.5.3.2 Electronic Warfare Market Size & Forecast, By Product, 2021 – 2032

   8.3.5.3.3 Electronic Warfare Market Size & Forecast, By Platform, 2021 – 2032

  8.3.5.4 Italy

   8.3.5.4.1 Electronic Warfare Market Size & Forecast, By Capability, 2021 – 2032

   8.3.5.4.2 Electronic Warfare Market Size & Forecast, By Product, 2021 – 2032

   8.3.5.4.3 Electronic Warfare Market Size & Forecast, By Platform, 2021 – 2032

  8.3.5.5 Spain

   8.3.5.5.1 Electronic Warfare Market Size & Forecast, By Capability, 2021 – 2032

   8.3.5.5.2 Electronic Warfare Market Size & Forecast, By Product, 2021 – 2032

   8.3.5.5.3 Electronic Warfare Market Size & Forecast, By Platform, 2021 – 2032

  8.3.5.6 Russia

   8.3.5.6.1 Electronic Warfare Market Size & Forecast, By Capability, 2021 – 2032

   8.3.5.6.2 Electronic Warfare Market Size & Forecast, By Product, 2021 – 2032

   8.3.5.6.3 Electronic Warfare Market Size & Forecast, By Platform, 2021 – 2032

  8.3.5.7 Poland

   8.3.5.7.1 Electronic Warfare Market Size & Forecast, By Capability, 2021 – 2032

   8.3.5.7.2 Electronic Warfare Market Size & Forecast, By Product, 2021 – 2032

   8.3.5.7.3 Electronic Warfare Market Size & Forecast, By Platform, 2021 – 2032

  8.3.5.8 Rest of Europe

   8.3.5.8.1 Electronic Warfare Market Size & Forecast, By Capability, 2021 – 2032

   8.3.5.8.2 Electronic Warfare Market Size & Forecast, By Product, 2021 – 2032

   8.3.5.8.3 Electronic Warfare Market Size & Forecast, By Platform, 2021 – 2032

8.4 Asia-Pacific

 8.4.1 Key Trends

 8.4.2 Electronic Warfare Market Size & Forecast, By Capability, 2021 – 2032

 8.4.3 Electronic Warfare Market Size & Forecast, By Product, 2021 – 2032

 8.4.4 Electronic Warfare Market Size & Forecast, By Platform, 2021 – 2032

 8.4.5 Electronic Warfare Market Size & Forecast, By Country, 2021 – 2032

  8.4.5.1 China

   8.4.5.1.1 Electronic Warfare Market Size & Forecast, By Capability, 2021 – 2032

   8.4.5.1.2 Electronic Warfare Market Size & Forecast, By Product, 2021 – 2032

   8.4.5.1.3 Electronic Warfare Market Size & Forecast, By Platform, 2021 – 2032

  8.4.5.2 India

   8.4.5.2.1 Electronic Warfare Market Size & Forecast, By Capability, 2021 – 2032

   8.4.5.2.2 Electronic Warfare Market Size & Forecast, By Product, 2021 – 2032

   8.4.5.2.3 Electronic Warfare Market Size & Forecast, By Platform, 2021 – 2032

  8.4.5.3 Japan

   8.4.5.3.1 Electronic Warfare Market Size & Forecast, By Capability, 2021 – 2032

   8.4.5.3.2 Electronic Warfare Market Size & Forecast, By Product, 2021 – 2032

   8.4.5.3.3 Electronic Warfare Market Size & Forecast, By Platform, 2021 – 2032

  8.4.5.4 South Korea

   8.4.5.4.1 Electronic Warfare Market Size & Forecast, By Capability, 2021 – 2032

   8.4.5.4.2 Electronic Warfare Market Size & Forecast, By Product, 2021 – 2032

   8.4.5.4.3 Electronic Warfare Market Size & Forecast, By Platform, 2021 – 2032

  8.4.5.5 Australia

   8.4.5.5.1 Electronic Warfare Market Size & Forecast, By Capability, 2021 – 2032

   8.4.5.5.2 Electronic Warfare Market Size & Forecast, By Product, 2021 – 2032

   8.4.5.5.3 Electronic Warfare Market Size & Forecast, By Platform, 2021 – 2032

  8.4.5.6 ASEAN Countries

   8.4.5.6.1 Electronic Warfare Market Size & Forecast, By Capability, 2021 – 2032

   8.4.5.6.2 Electronic Warfare Market Size & Forecast, By Product, 2021 – 2032

   8.4.5.6.3 Electronic Warfare Market Size & Forecast, By Platform, 2021 – 2032

  8.4.5.7 Rest of Asia-Pacific

   8.4.5.7.1 Electronic Warfare Market Size & Forecast, By Capability, 2021 – 2032

   8.4.5.7.2 Electronic Warfare Market Size & Forecast, By Product, 2021 – 2032

   8.4.5.7.3 Electronic Warfare Market Size & Forecast, By Platform, 2021 – 2032

8.5 Latin America

 8.5.1 Key Trends

 8.5.2 Electronic Warfare Market Size & Forecast, By Capability, 2021 – 2032

 8.5.3 Electronic Warfare Market Size & Forecast, By Product, 2021 – 2032

 8.5.4 Electronic Warfare Market Size & Forecast, By Platform, 2021 – 2032

 8.5.5 Electronic Warfare Market Size & Forecast, By Country, 2021 – 2032

  8.5.5.1 Brazil

   8.5.5.1.1 Electronic Warfare Market Size & Forecast, By Capability, 2021 – 2032

   8.5.5.1.2 Electronic Warfare Market Size & Forecast, By Product, 2021 – 2032

   8.5.5.1.3 Electronic Warfare Market Size & Forecast, By Platform, 2021 – 2032

  8.5.5.2 Argentina

   8.5.5.2.1 Electronic Warfare Market Size & Forecast, By Capability, 2021 – 2032

   8.5.5.2.2 Electronic Warfare Market Size & Forecast, By Product, 2021 – 2032

   8.5.5.2.3 Electronic Warfare Market Size & Forecast, By Platform, 2021 – 2032

  8.5.5.3 Mexico

   8.5.5.3.1 Electronic Warfare Market Size & Forecast, By Capability, 2021 – 2032

   8.5.5.3.2 Electronic Warfare Market Size & Forecast, By Product, 2021 – 2032

   8.5.5.3.3 Electronic Warfare Market Size & Forecast, By Platform, 2021 – 2032

  8.5.5.4 Colombia

   8.5.5.4.1 Electronic Warfare Market Size & Forecast, By Capability, 2021 – 2032

   8.5.5.4.2 Electronic Warfare Market Size & Forecast, By Product, 2021 – 2032

   8.5.5.4.3 Electronic Warfare Market Size & Forecast, By Platform, 2021 – 2032

  8.5.5.5 Rest of Latin America

   8.5.5.5.1 Electronic Warfare Market Size & Forecast, By Capability, 2021 – 2032

   8.5.5.5.2 Electronic Warfare Market Size & Forecast, By Product, 2021 – 2032

   8.5.5.5.3 Electronic Warfare Market Size & Forecast, By Platform, 2021 – 2032

8.6 Middle East & Africa

 8.6.1 Key Trends

 8.6.2 Electronic Warfare Market Size & Forecast, By Capability, 2021 – 2032

 8.6.3 Electronic Warfare Market Size & Forecast, By Product, 2021 – 2032

 8.6.4 Electronic Warfare Market Size & Forecast, By Platform, 2021 – 2032

 8.6.5 Electronic Warfare Market Size & Forecast, By Country, 2021 – 2032

  8.6.5.1 UAE

   8.6.5.1.1 Electronic Warfare Market Size & Forecast, By Capability, 2021 – 2032

   8.6.5.1.2 Electronic Warfare Market Size & Forecast, By Product, 2021 – 2032

   8.6.5.1.3 Electronic Warfare Market Size & Forecast, By Platform, 2021 – 2032

  8.6.5.2 Saudi Arabia

   8.6.5.2.1 Electronic Warfare Market Size & Forecast, By Capability, 2021 – 2032

   8.6.5.2.2 Electronic Warfare Market Size & Forecast, By Product, 2021 – 2032

   8.6.5.2.3 Electronic Warfare Market Size & Forecast, By Platform, 2021 – 2032

  8.6.5.3 Qatar

   8.6.5.3.1 Electronic Warfare Market Size & Forecast, By Capability, 2021 – 2032

   8.6.5.3.2 Electronic Warfare Market Size & Forecast, By Product, 2021 – 2032

   8.6.5.3.3 Electronic Warfare Market Size & Forecast, By Platform, 2021 – 2032

  8.6.5.4 Egypt

   8.6.5.4.1 Electronic Warfare Market Size & Forecast, By Capability, 2021 – 2032

   8.6.5.4.2 Electronic Warfare Market Size & Forecast, By Product, 2021 – 2032

   8.6.5.4.3 Electronic Warfare Market Size & Forecast, By Platform, 2021 – 2032

  8.6.5.5 South Africa

   8.6.5.5.1 Electronic Warfare Market Size & Forecast, By Capability, 2021 – 2032

   8.6.5.5.2 Electronic Warfare Market Size & Forecast, By Product, 2021 – 2032

   8.6.5.5.3 Electronic Warfare Market Size & Forecast, By Platform, 2021 – 2032

  8.6.5.6 Rest of Middle East & Africa

   8.6.5.6.1 Electronic Warfare Market Size & Forecast, By Capability, 2021 – 2032

   8.6.5.6.2 Electronic Warfare Market Size & Forecast, By Product, 2021 – 2032

   8.6.5.6.3 Electronic Warfare Market Size & Forecast, By Platform, 2021 – 2032

9. Competitive Landscape

 9.1 Key Players' Positioning

 9.2 Competitive Developments

  9.2.1 Key Strategies Adopted (%), By Key Players, 2024

  9.2.2 Year-Wise Strategies & Development, 2021 – 2025

  9.2.3 Number Of Strategies Adopted By Key Players, 2024

 9.3 Market Share Analysis, 2024

 9.4 Product/Service & Application Benchmarking

  9.4.1 Product/Service Specifications & Features By Key Players

  9.4.2 Product/Service Heatmap By Key Players

  9.4.3 Application Heatmap By Key Players

 9.5 Industry Start-Up & Innovation Landscape

9.6 Key Company Profiles

 9.6.1 BAE Systems.

  9.6.1.1 Company Overview & Snapshot

  9.6.1.2 Product/Service Portfolio

  9.6.1.3 Key Company Financials

  9.6.1.4 SWOT Analysis

9.6.2 Raytheon Technologies Corporation

9.6.3 Thales Group

9.6.4 Northrop Grumman Corporation

9.6.5 HENSOLDT

9.6.6 Boeing

9.6.7 General Dynamics Corporation

9.6.8 Lockheed Martin Corporation

9.6.9 Leonardo SpA

9.6.10 Saab AB

9.6.11 L3Harris Technologies, Inc.

9.6.12 Elbit Systems Ltd.

9.6.13 Israel Aerospace Industries (IAI)

9.6.14 Collins Aerospace

9.6.15 Rheinmetall AG

9.6.16 Airbus Defence and Space

9.6.17 Cobham Limited

9.6.18 Mercury Systems, Inc.

9.6.19 Curtiss-Wright Corporation

9.6.20 Indra Sistemas, S.A.

10. Analyst Recommendations

 10.1 SNS Insider Opportunity Map

 10.2 Industry Low-Hanging Fruit Assessment

 10.3 Market Entry & Growth Strategy

 10.4 Analyst Viewpoint & Suggestions On Market Growth

11. Assumptions

12. Disclaimer

13. Appendix

 13.1 List Of Tables

 13.2 List Of Figures

Key Segmentation

By Capability

  • Support
  • Attack
  • Protection

By Product

  • Jammers
  • Countermeasure System
  • Decoy
  • Directed Energy Weapon
  • Antennas
  • Direction Finders
  • Laser Warning Systems
  • Radar Warning Receivers
  • Counter UAV Systems
  • Electromagnetic Pulse (EMP) Weapons
  • Others

By Platform

  • Land
  • Naval
  • Airborne
  • Space

Request for Segment Customization as per your Business Requirement: Segment Customization Request

Regional Coverage: 

North America

  • US
  • Canada

Europe

  • Germany
  • UK
  • France
  • Italy
  • Spain
  • Russia
  • Poland
  • Rest of Europe

Asia Pacific

  • China
  • India
  • Japan
  • South Korea
  • Australia
  • ASEAN Countries
  • Rest of Asia Pacific

Middle East & Africa

  • UAE
  • Saudi Arabia
  • Qatar
  • South Africa
  • Rest of Middle East & Africa

Latin America

  • Brazil
  • Argentina
  • Mexico
  • Colombia
  • Rest of Latin America

Request for Country Level Research Report: Country Level Customization Request

Available Customization 

With the given market data, SNS Insider offers customization as per the company’s specific needs. The following customization options are available for the report: 

  • Detailed Volume Analysis 
  • Criss-Cross segment analysis (e.g. Product X Application) 
  • Competitive Product Benchmarking 
  • Geographic Analysis 
  • Additional countries in any of the regions 
  • Customized Data Representation 
  • Detailed analysis and profiling of additional market player


An accurate research report requires proper strategizing as well as implementation. There are multiple factors involved in the completion of good and accurate research report and selecting the best methodology to compete the research is the toughest part. Since the research reports we provide play a crucial role in any company’s decision-making process, therefore we at SNS Insider always believe that we should choose the best method which gives us results closer to reality. This allows us to reach at a stage wherein we can provide our clients best and accurate investment to output ratio.

Each report that we prepare takes a timeframe of 350-400 business hours for production. Starting from the selection of titles through a couple of in-depth brain storming session to the final QC process before uploading our titles on our website we dedicate around 350 working hours. The titles are selected based on their current market cap and the foreseen CAGR and growth.


The 5 steps process:

Step 1: Secondary Research:

Secondary Research or Desk Research is as the name suggests is a research process wherein, we collect data through the readily available information. In this process we use various paid and unpaid databases which our team has access to and gather data through the same. This includes examining of listed companies’ annual reports, Journals, SEC filling etc. Apart from this our team has access to various associations across the globe across different industries. Lastly, we have exchange relationships with various university as well as individual libraries.

Secondary Research

Step 2: Primary Research

When we talk about primary research, it is a type of study in which the researchers collect relevant data samples directly, rather than relying on previously collected data.  This type of research is focused on gaining content specific facts that can be sued to solve specific problems. Since the collected data is fresh and first hand therefore it makes the study more accurate and genuine.

We at SNS Insider have divided Primary Research into 2 parts.

Part 1 wherein we interview the KOLs of major players as well as the upcoming ones across various geographic regions. This allows us to have their view over the market scenario and acts as an important tool to come closer to the accurate market numbers. As many as 45 paid and unpaid primary interviews are taken from both the demand and supply side of the industry to make sure we land at an accurate judgement and analysis of the market.

This step involves the triangulation of data wherein our team analyses the interview transcripts, online survey responses and observation of on filed participants. The below mentioned chart should give a better understanding of the part 1 of the primary interview.

Primary Research

Part 2: In this part of primary research the data collected via secondary research and the part 1 of the primary research is validated with the interviews from individual consultants and subject matter experts.

Consultants are those set of people who have at least 12 years of experience and expertise within the industry whereas Subject Matter Experts are those with at least 15 years of experience behind their back within the same space. The data with the help of two main processes i.e., FGDs (Focused Group Discussions) and IDs (Individual Discussions). This gives us a 3rd party nonbiased primary view of the market scenario making it a more dependable one while collation of the data pointers.

Step 3: Data Bank Validation

Once all the information is collected via primary and secondary sources, we run that information for data validation. At our intelligence centre our research heads track a lot of information related to the market which includes the quarterly reports, the daily stock prices, and other relevant information. Our data bank server gets updated every fortnight and that is how the information which we collected using our primary and secondary information is revalidated in real time.

Data Bank Validation

Step 4: QA/QC Process

After all the data collection and validation our team does a final level of quality check and quality assurance to get rid of any unwanted or undesired mistakes. This might include but not limited to getting rid of the any typos, duplication of numbers or missing of any important information. The people involved in this process include technical content writers, research heads and graphics people. Once this process is completed the title gets uploader on our platform for our clients to read it.

Step 5: Final QC/QA Process:

This is the last process and comes when the client has ordered the study. In this process a final QA/QC is done before the study is emailed to the client. Since we believe in giving our clients a good experience of our research studies, therefore, to make sure that we do not lack at our end in any way humanly possible we do a final round of quality check and then dispatch the study to the client.