Electronic Weighing Scale Market Report Scope & Overview:

The Electronic Weighing Scale Market size was valued at USD 8.56 Billion in 2024 and is projected to reach USD 14.20 Billion by 2032, growing at a CAGR of 6.58% during 2025-2032.
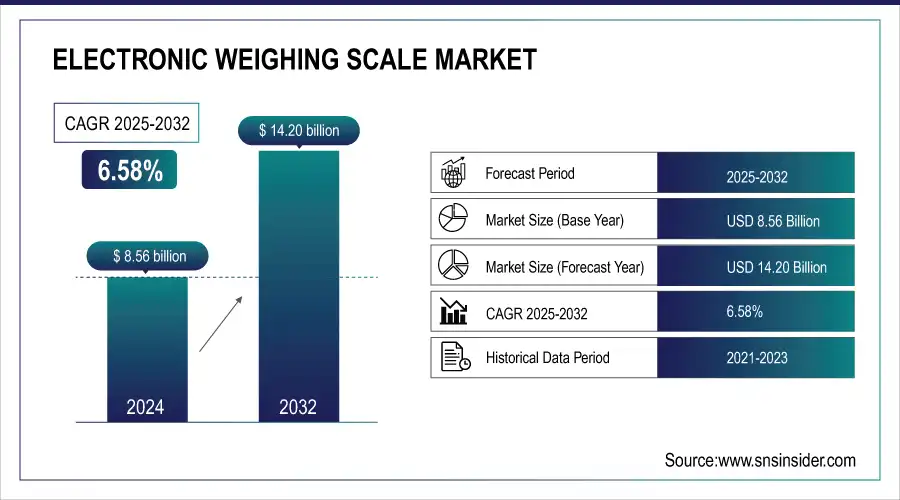
The global market for electronic weighing scales is gradually growing as a result of increasing adoption of digital and advanced solutions in retail, healthcare, and industrial applications. Rising adoption of precise measurement in trade and commerce is a key driver for demand, while IoT integration and smart connectivity functions make it user-friendly and efficient. The electronic weighing scales are providing accuracy, compliance and operational effectiveness across industries and the growing applications are supporting market expansion across the globe together with the technological innovations.

  • Over 70% of new industrial scales support wireless connectivity for real-time monitoring and cloud data logging.

  • More than 80% of electronic scales now comply with international trade and measurement standards (OIML/ISO).

Electronic Weighing Scale Market Trends

  • Electronic weighing scales are increasingly used in retail for precision billing, in healthcare for patient monitoring, and in industries for quality compliance.

  • Adoption is strengthened by IoT, wireless, and cloud-based analytics, enabling businesses to optimize operations through connected smart weighing systems.

  • Advanced features such as real-time monitoring, cloud connectivity, and data analytics support improved decision-making in logistics, manufacturing, and healthcare.

  • Smart weighing scales offer predictive maintenance capabilities and seamless automation, reducing downtime and improving productivity across industries.

  • Smart scales integrate with ERP systems, allowing uninterrupted workflows and stronger synchronization between weighing processes and business operations.

  • With industries shifting toward digitalization, IoT-enabled weighing scales are expected to witness rapid global adoption during the forecast period.

The U.S. Electronic Weighing Scale Market size was valued at USD 1.35 Billion in 2024 and is projected to reach USD 2.21 Billion by 2032, growing at a CAGR of 6.41% during 2025-2032. The U.S. electronic weighing scale market is growing rapidly due to the hot demand in retail, healthcare, and logistics sectors. Adoption is also being spurred by regulatory requirements surrounding accuracy in trade and commerce. Furthermore, the increasing adoption of smart weighing solutions with wireless connectivity and automation, which improve operational efficiency, is aiding global market development. The ongoing app integration across multiple commercial and industrial applications encourages steady growth, making the U.S. one of the significant backbones for the long-term growth path of the global market.
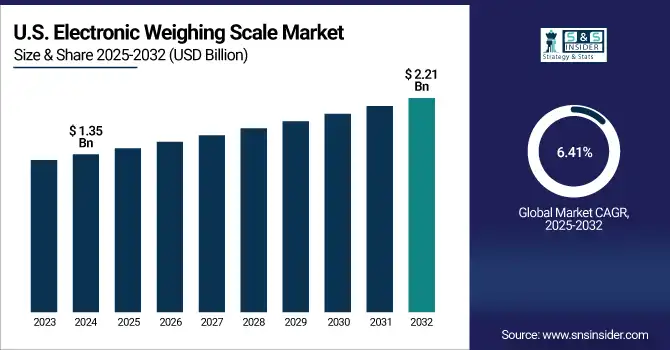
The Electronic Weighing Scale Market forecast trends show that the market is experiencing a steady development owing to the digitization of retail and increasing adoption of healthcare applications, entry of IoT products, and the rising need for accurate measurement for trade and industrial applications.

Electronic Weighing Scale Market Segment Analysis

  • By type, retail scales held the largest share of around 32.10% in 2024, while health scales are projected to be the fastest-growing segment with a CAGR of 7.96%.

  • By application, the retail sector dominated the market with approximately 24.95% share in 2024, whereas healthcare is expected to register the highest growth with a CAGR of 7.78%.

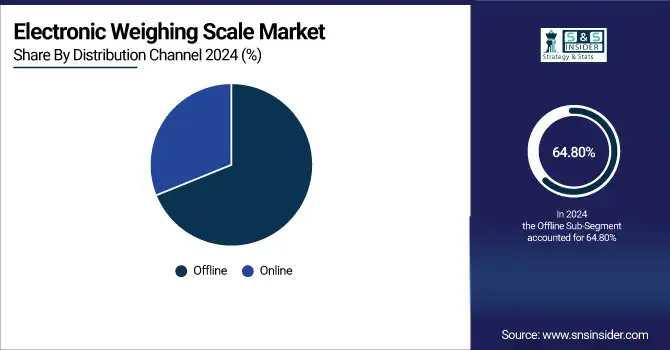
  • By distribution channel, offline sales accounted for the leading share of nearly 64.80% in 2024, but online channels are anticipated to be the fastest-growing segment with a CAGR of 6.47%.

  • By end-user, the commercial segment led the market with about 58.20% share in 2024, while the industrial segment is forecasted to grow the fastest at a CAGR of 6.69%.

By Type, Retail Scales Leads Market While Health Scales Registers Fastest Growth

Retail scales held the largest revenue share of approximately 32.10% in 2024. This high share can be ascertained by the important role of scales in facilitating accurate measurement during sales operations. To build consumer confidence in supermarkets, grocery shops, and convenience shops use electronic weighing scalers at billing counters and weighing machine for efficient billing and doing stock count so inventory systems are strengthened. Health scale is expected to grow at the highest CAGR of 7.96% during the forecast period (2024–2032) owing to the increasing awareness about health and lifestyle-related diseases such as obesity and diabetes. Digital health scales are gaining consumer adoption as home health scales, while healthcare providers continue to use them for patient management. Key market players operate branded smart health monitoring scales having integrations of mobile apps and wearable technologies including Omron Healthcare Inc., thus contributes to the growth and adoption of smart health monitoring scales supported by rise in demand of smart health monitoring scales in consumer and professional healthcare segments.

By Application, Retail Dominate While Healthcare Shows Rapid Growth

The retail segment was the highest revenue contributor to the market, accounting for more than 24.95% share in 2024, owing to high usage in supermarkets, grocery chains and convenience stores. Correct weighing guarantees fair trade while integrates billing, POS to improve operational efficiency. Avery Weigh-Tronix manufactures high-end retail weighing systems that marry accuracy with software, with an end result that promotes trust and builds efficiency. Direct impact on sales and customer satisfaction, thus stronghold in the global electronic weighing scale market. In the healthcare segment, CAGRs increase to 7.78% during 2024–2032; owing to demand for accurate weight measurements for patients while monitoring their health or using diagnostic techniques. If we talk about chronic conditions such as diabetes, cardiovascular diseases and obesity then the rising incidences are primarily driving the dependency upon weighing scales.

By Distribution Channel, Offline Lead While Online Registers Fastest Growth

The offline segment held the largest share of revenue in the market, over 64.80%, in 2024 owing to the high dependence on physical retailers, distributors, and independent retail stores for their purchasing of weighing scales. Offline channels are also preferred by customers for product demos, calibration services and after sales service. The online segment is projected to witness the fastest CAGR of 6.47% over the 2024–2032 period, due to rising penetration of e-commerce, competitive pricing, and convenience of doorstep delivery. When it comes to online platforms, they offer much larger product availability, customer feedback, and detailed specifications that can help influence your purchases. Digital marketplaces are also being leveraged by Kern & Sohn GmbH who is selling its precision weighing instruments through e-commerce across various digital marketplaces owing to the growing consumer preference towards online purchase and increasing adoption of e-commerce channels by individual and industrial buyers across the globe.
By End-User, Commercial Lead While Industrial Grows the Fastest

In 2024, the commercial segment held the largest revenue share of approximately 58.20%, which is attributed to widespread applications in the retail, hospitality, and food service sectors. Proper weighing helps you get better billing, helps out in compliance, and leads to customer satisfaction. Industrial segment is expected to be the fastest growing CAGR of 6.69% during 2024–2032 due to raising automation in manufacturing or logistic and production excess. With smooth features, Industries are in need of precise weighing solutions to handle raw materials, take care of packaging and look after quality checking. This growth is driven by Sartorius AG through advanced industrial weighing systems based on IoT and automation, favoring global manufacturers the possibility to meet international quality standards while efficiently optimizing their supply chain operations.

Asia-pacific Electronic Weighing Scale Market Insights

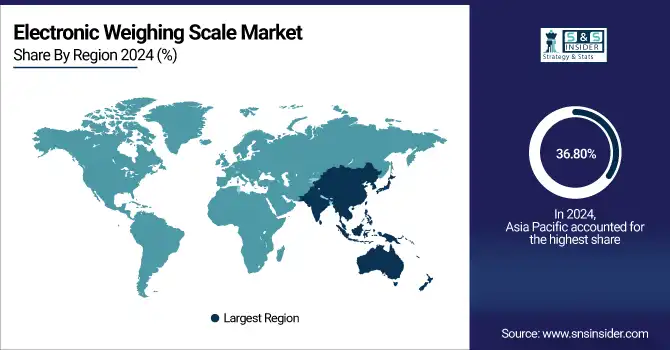
Asia Pacific attracted commanding revenue share of nearly 36.80% in 2024, and is anticipated to become swiftest expanding regional segment during aforementioned period with CAGR of 7.13%, owing to sizeable urbanization and industrialization amidst growing retail sector in nations such as China, India, and Japan. Rising population density leads to demand for high-volume retail and healthcare, positively influencing weighing scale adoption as logistics and manufacturing industries grow. The widespread use of electronic weighing scales in Asia Pacific is also due to the emphasis provided by the government towards fair trade practices and its mandatory adherence to various regulations.
North America Electronic Weighing Scale Market Insights

The North America electronic weighing scale market is witnessing progressive growth, primarily in retail, healthcare, and logistics sectors. Solution adoption of smart, connected weighing solutions with IoT and automation enhance operational efficacy. The stringency of trade regulation and quality trading standards adds to the push for this market growth. North America too remains a leading global player, due to the need for regional financial and technological integration across commercial and industrial applications.

Europe Electronic Weighing Scale Market Insights

Europe electronic weighing scale market is expected to grow steadily owing to stringent regulatory standards for high degree of trade accuracy and high market demand from retail, industrial and healthcare sector. Supported by growing digital & smart weighing adoption trend coupled with rising automation in manufacturing & logistics, expansion is taking place. Market adoption across the European economies continues to be driven by technological advancements, sales training and focus on compliance.

Latin America (LATAM) and Middle East & Africa (MEA) Electronic Weighing Scale Market Insights

In Middle East & Africa rising retail and industrial sectors in countries such as Qatar & South Africa are supporting the electronic weighing scale market growth, Latin America electronic weighing scale market growing due to high rise adoption for healthcare & commercial applications by countries such as Brazil, Argentina, etc. Both of these regions are being driven by growing technology integration and the need for precise measurement solutions.

Electronic Weighing Scale Market Growth Drivers:

  • Rising Adoption of Digital and Smart Weighing Scales Across Retail, Healthcare, And Industrial Applications Globally

Global demand is being driven by increased adoption of digital and smart weighing scales in retail, healthcare, and industrial applications. Retail relies on precision billing and bug inventory management that drives the sales. Electronic weighing scales are majorly used in healthcare facilities for monitoring patient weight and industries for checking the quality and compliance of production. Coupled with IoT, wireless, and cloud computing analytics, adoption is cemented enabling businesses to optimize their operations. Low end of that range with segmenting electronic weighing scales from the other end. This uneven application scope across diverse sectors of the industry establishes electronic weighing scales as a vital component and playing a major role internationally and conveying the weight of the significant revolutionization in the market growth during the upcoming forecast period.

Over 60% of modern hospitals have adopted digital body composition scales in the last five years.

Hospitals report up to 25% faster patient monitoring with digital weighing scales, while factories improve quality compliance checks by 20%.

Electronic Weighing Scale Market Restraints:

  • Lack of Standardization and Technical Challenges in Integration of Advanced Weighing Solutions Across Diverse End-User Industries

The integration of advanced weighing solutions is required to be specific to industry which results in the lack of standardization along with technical complexity that restrains the market growth. The calibration and compliance needs based on the domain such as healthcare, logistics and manufacturing are unique which makes interoperability a pain point. Furthermore, an increase in adoption of smart weighing systems, coupled with the existing condition of IT and automation infrastructure, often raises fitness issues, increasing the cost of implementation. These challenges have made optimum acceptance of advanced electronic weighing scales by businesses, especially in the regions with lack of technical expertise, low. These problems introduce barriers to scaling adoption, inhibiting the ability for the market to grow to its full-sized potential.

Electronic Weighing Scale Market Opportunities:

  • Increasing Integration of IoT and Smart Connectivity in Weighing Scales Offering Enhanced Efficiency and Real-Time Data Analytics

Due to the synergy of IoT and smart connectivity with weighing scale there is huge room for growth. Real-time monitoring and reporting capabilities provided by some advanced features such as wireless, cloud connectivity, and data analytics. This enhances the decision-making process in sectors such as logistics, manufacturing, and healthcare. For businesses, this translates into all the benefits of improved operational efficiencies, predictive maintenance and automation. Smart scales also facilitate integration with Enterprise Resource Planning (ERP) systems for uninterrupted workflows. The trend of IoT enabled weighing scales is expected to have a huge market adoption across the globe during the forecast period as industries adapt to the digital transformation and position IoT enabled weighing scales as a potential tool.

Over 65% of industrial operations using smart scales report seamless integration with ERP systems for real-time inventory and production tracking.

IoT-enabled scales can transmit weight data in less than 2 seconds per reading, reducing manual recording delays by over 30%.

Electronic Weighing Scale Market Competitive Landscape:

Mettler-Toledo International Inc. is one of the world's leading suppliers of precision instruments and services for use in laboratory, industrial, food retailing, and food service applications. The MS Series Precision Balances are designed to provide high precision measurements for laboratory and industrial applications, while ICS Industrial Checkweighers streamline production line weighing processes to guarantee compliance and productivity. Mettler-Toledo is recognized for reliability, innovation, and integration with IoT and smart technologies, supporting operational GOB and GOOO, accuracy, and productivity across various industries globally.

  • In February 2024, Mettler-Toledo discontinued several models from its MS Series Precision Balances, including the MS3002TS/00, MS204, and MS32000L/03. These models were phased out in favor of newer, more advanced weighing solutions. The company is focusing on next-generation smart and IoT-enabled weighing solutions for laboratories and industrial applications.

Sartorius AG is an efficient global laboratory and industrial weighing industry while focusing on quality and precision. Cubis II: Modular high-precision lab balances RoboWeigh: Automated, connected industrial scales With innovation, smart features, and automation bundled together, Sartorius makes accurate measurements, operational efficiency, and regulatory compliance seamless, earning its place as a leading global provider in the electronic weighing scale market.

  • In April 2025, Sartorius released a firmware update for its Cubis® II Analytical Balance, version 09-03-08.04.07. This update enhances connectivity, precision, and automation features, aligning with the growing demand for smart and IoT-enabled weighing solutions in laboratory applications.  

Ohaus Corporation conducts the global manufacturing and marketing of electronic weighing solutions for laboratory, industrial and education applications. A compact portable balance for labs and classrooms, the Scout STX Portable Balance features high-precision load cell technology, while the Valor 7000 Checkweigher, designed for high-speed and industrial use, provides accurate production line weighing. Ohaus has built a strong reputation for durability, high uptime, reliability, and ease of use while incorporating innovative technologies with smart features to improve measurement precision, reliability, and regulatory compliance in many industries globally.

  • In January 2024, OHAUS Corporation launched the Scout™ STX Portable Balance, a high-performance portable balance designed for laboratory and industrial applications. This model features a 4.3" full-color touchscreen display, offering intuitive operation and fast stabilization times of up to one second. The Scout™ STX is engineered for superior performance, with high-resolution weighing results and an integrated overload protection system rated at ten times the capacity, ensuring durability in demanding environments.

Tanita Corporation is the global leader in the development and manufacturing of accurate health and body composition scales, with special focus on consumer health comprising regular monitoring, and professional health incorporating clinical measurements. The RD-545 Body Composition Monitor provides cutting edge diagnostics for clinics and fitness facilities, and the UM-075 Professional Weight Scale is used for exacting professional health measurements. Through smart connectivity and app integration and other digital innovations, Japan-based Tanita provides trusted, accurate and easy-to-use solutions for personal and clinical health monitoring globally, just as we have done since made-to-order precision scales and the very first body fat analyzer.

  • In September 2024, the Tanita RD-545 InnerScan PRO is a segmental body composition monitor that provides an in-depth analysis of 26 body composition readings, including weight, body fat, muscle mass, muscle quality score, physique rating, bone mass, visceral fat, basal metabolic rate, metabolic age, total body water, and BMI. It features hand electrodes enabling segmental fat and muscle analysis of the arms, legs, and trunk (5 segmental fat measurements, 5 segmental muscle mass measurements).

A&D Company, Limited is a global leader in providing accurate and precise weighing and measurement solutions for laboratory, healthcare and industrial applications. High Accuracy Measurements for Lab and Industrial Operations: The GR Series Precision Balance and the FG-i Series Floor Scale with Automated Data Logging for Robust Industrial Floor Weighing. With a perfect mix of innovation, IoT integration and enhanced durability, A&D confirms trustable, efficient and regulatory-compliant weighing solutions to cater operational and regulatory needs of different types of industries globally.

  • In January 2024, A&D Company released the GR Series Semi-Micro Analytical Balances brochure, highlighting high-precision laboratory and industrial weighing with automated data logging features. The GR Series balances offer 0.01 mg readability up to 42 g (GR-202 model), featuring internal calibration, space-saving design, and compliance with GLP standards. These balances are designed for applications requiring precise measurements and data integrity, making them suitable for various scientific and industrial environments.

Electronic Weighing Scale Market Key Players

Some of the Electronic Weighing Scale Market Companies are:

  • Mettler-Toledo International Inc.

  • A&D Company, Limited

  • Avery Weigh-Tronix LLC

  • Adam Equipment Co. Ltd.

  • Kern & Sohn GmbH

  • Shimadzu Corporation

  • Sartorius AG

  • Fairbanks Scales Inc.

  • Essae-Teraoka Pvt. Ltd.

  • CAS Corporation

  • Tanita Corporation

  • OHAUS Corporation

  • Rice Lake Weighing Systems

  • Contech Instruments Ltd.

  • Doran Scales, Inc.

  • Salter Brecknell

  • Weightron Bilanciai Ltd.

  • Torbal Scales

  • Digiweigh USA

  • Citizen Scales Pvt. Ltd.

Electronic Weighing Scale Market Report Scope:

Report Attributes Details
Market Size in 2024 USD 8.56 Billion
Market Size by 2032 USD 14.20 Billon
CAGR CAGR of 6.58% From 2025 to 2032
Base Year 2024
Forecast Period 2025-2032
Historical Data 2021-2023
Report Scope & Coverage Market Size, Segments Analysis, Competitive  Landscape, Regional Analysis, DROC & SWOT Analysis, Forecast Outlook
Key Segments • By Type (Laboratory scales, Gem and jewellery scales, Retail scales, Health scales, Kitchen scales and Others)
• By Application (Food and beverage, Manufacturing, Healthcare, Retail, Logistics and Others)
• By Distribution Channel (Online and Offline)
• By End-User (Commercial and Industrial)
Regional Analysis/Coverage North America (US, Canada, Mexico), Europe (Germany, France, UK, Italy, Spain, Poland, Turkey, Rest of Europe), Asia Pacific (China, India, Japan, South Korea, Singapore, Australia, Taiwan,  Rest of Asia Pacific), Middle East & Africa (UAE, Saudi Arabia, Qatar, South Africa, Rest of Middle East & Africa), Latin America (Brazil, Argentina, Rest of Latin America)
Company Profiles Mettler-Toledo International Inc., A&D Company, Limited, Avery Weigh-Tronix LLC, Adam Equipment Co. Ltd., Kern & Sohn GmbH, Shimadzu Corporation, Sartorius AG, Fairbanks Scales Inc., Essae-Teraoka Pvt. Ltd., CAS Corporation, Tanita Corporation, OHAUS Corporation, Rice Lake Weighing Systems, Contech Instruments Ltd., Doran Scales, Inc., Salter Brecknell, Weightron Bilanciai Ltd., Torbal Scales, Digiweigh USA and Citizen Scales Pvt. Ltd.

Table Of Contents

1. Introduction

1.1 Market Definition & Scope

 1.2 Research Assumptions & Abbreviations

 1.3 Research Methodology

2. Executive Summary

2.1 Market Snapshot

 2.2 Market Absolute $ Opportunity Assessment & Y-o-Y Analysis, 2021–2032

 2.3 Market Size & Forecast, By Segmentation, 2021–2032

  2.3.1 Market Size By Type

  2.3.2 Market Size By Application

         2.3.3 Market Size By Distribution Channel

         2.3.4 Market Size By End-User

 2.4 Market Share & Bps Analysis By Region, 2024

 2.5 Industry Growth Scenarios – Conservative, Likely & Optimistic

 2.6 Industry CxO’s Perspective

3. Market Overview

3.1 Market Dynamics

  3.1.1 Drivers

  3.1.2 Restraints

  3.1.3 Opportunities

  3.1.4 Key Market Trends

 3.2 Industry PESTLE Analysis

 3.3 Key Industry Forces (Porter’s) Impacting Market Growth

 3.4 Industry Supply Chain Analysis

  3.4.1 Raw Material Suppliers

  3.4.2 Manufacturers

  3.4.3 Distributors/Suppliers

  3.4.4 Customers/End-Users

 3.5 Industry Life Cycle Assessment

 3.6 Parent Market Overview

 3.7 Market Risk Assessment

4. Statistical Insights & Trends Reporting

4.1 Consumer Behavior & Usage Statistics

4.1.1 Adoption rate of electronic weighing scales across retail, healthcare, and industrial sectors (%)

4.1.2 Average replacement cycle of weighing scales in commercial vs. industrial usage (years)

4.1.3 Share of consumers preferring smart/digital scales over traditional models (%)

4.2 Technology & Product Statistics

4.2.1 Accuracy levels of electronic weighing scales (e.g., % offering ±0.01g precision)

4.2.2 Percentage of products with IoT, Bluetooth, or Wi-Fi connectivity features

4.2.3 Share of smart weighing scales in total shipments (%)

4.3 Pricing & Cost Statistics

4.3.1 Average selling price (ASP) of electronic weighing scales by type (USD)

4.3.2 Price segmentation across low-end, mid-range, and premium scales (%)

4.3.3 Cost breakdown: sensors, microcontrollers, and display components (%)

4.4 Operational & Manufacturing Statistics

4.4.1 Global production output by major manufacturing hubs (units per year)

4.4.2 Import/export trade volumes of electronic weighing scales (value in USD)

4.4.3 Average manufacturing lead time and capacity utilization rates (%)

4.5 Distribution & Sales Statistics

4.5.1 Share of online vs. offline sales channels (%)

4.5.2 Growth rate of e-commerce sales of electronic weighing scales (%)

4.5.3 B2B vs. B2C sales distribution (%)

4.6 Regulatory & Compliance Statistics

4.6.1 Percentage of scales certified under OIML, NIST, and ISO standards (%)

4.6.2 Regional regulatory approval timelines (weeks/months)

4.6.3 Number of recalls due to non-compliance or accuracy failures

4.7 Future Outlook & Emerging Trends Statistics

4.7.1 Forecasted penetration of smart/connected scales by 2032 (%)

4.7.2 Share of eco-friendly or sustainable materials in weighing scale production (%)

4.7.3 Expected automation adoption rate in industrial weighing systems (%)

5. Electronic Weighing Scale Market Segmental Analysis & Forecast, By Type, 2021 – 2032, Value (Usd Billion)

5.1 Introduction

 5.2 Laboratory scales

  5.2.1 Key Trends

  5.2.2 Market Size & Forecast, 2021 – 2032

 5.3 Gem and jewellery scales

  5.3.1 Key Trends

  5.3.2 Market Size & Forecast, 2021 – 2032

 5.4 Retail scales

  5.4.1 Key Trends

  5.4.2 Market Size & Forecast, 2021 – 2032

   5.5 Health scales

  5.5.1 Key Trends

  5.5.2 Market Size & Forecast, 2021 – 2032

   5.6 Kitchen scales

  5.6.1 Key Trends

  5.6.2 Market Size & Forecast, 2021 – 2032

   5.7 Others

  5.7.1 Key Trends

  5.7.2 Market Size & Forecast, 2021 – 2032

6. Electronic Weighing Scale Market Segmental Analysis & Forecast, By Application, 2021 – 2032, Value (Usd Billion)

    6.1 Introduction

 6.2 Food and beverage

  6.2.1 Key Trends

  6.2.2 Market Size & Forecast, 2021 – 2032

 6.3 Manufacturing

  6.3.1 Key Trends

  6.3.2 Market Size & Forecast, 2021 – 2032

 6.4 Healthcare

  6.4.1 Key Trends

  6.4.2 Market Size & Forecast, 2021 – 2032

6.5 Retail

  6.5.1 Key Trends

  6.5.2 Market Size & Forecast, 2021 – 2032

6.6 Logistics

  6.6.1 Key Trends

  6.6.2 Market Size & Forecast, 2021 – 2032

6.7 Others

  6.7.1 Key Trends

  6.7.2 Market Size & Forecast, 2021 – 2032

7. Electronic Weighing Scale Market Segmental Analysis & Forecast, By Distribution Channel, 2021 – 2032, Value (Usd Billion)

    7.1 Introduction

 7.2 Online

  7.2.1 Key Trends

  7.2.2 Market Size & Forecast, 2021 – 2032

 7.3 Offline

  7.3.1 Key Trends

  7.3.2 Market Size & Forecast, 2021 – 2032

8. Electronic Weighing Scale Market Segmental Analysis & Forecast, By End-User, 2021 – 2032, Value (Usd Billion)

    8.1 Introduction

 8.2 Commercial

  8.2.1 Key Trends

  8.2.2 Market Size & Forecast, 2021 – 2032

 8.3 Industrial

  8.3.1 Key Trends

  8.3.2 Market Size & Forecast, 2021 – 2032

9. Electronic Weighing Scale Market Segmental Analysis & Forecast By Region, 2021 – 2025, Value (Usd Billion)

9.1 Introduction

9.2 North America

 9.2.1 Key Trends

 9.2.2 Electronic Weighing Scale Market Size & Forecast, By Type, 2021 – 2032

 9.2.3 Electronic Weighing Scale Market Size & Forecast, By Application, 2021 – 2032

 9.2.4 Electronic Weighing Scale Market Size & Forecast, By Distribution Channel, 2021 – 2032

 9.2.5 Electronic Weighing Scale Market Size & Forecast, By End-User, 2021 – 2032

 9.2.6 Electronic Weighing Scale Market Size & Forecast, By Country, 2021 – 2032

  9.2.6.1 USA

   9.2.6.1.1 Electronic Weighing Scale Market Size & Forecast, By Type, 2021 – 2032

   9.2.6.1.2 Electronic Weighing Scale Market Size & Forecast, By Application, 2021 – 2032

   9.2.6.1.3 Electronic Weighing Scale Market Size & Forecast, By Distribution Channel, 2021 – 2032

   9.2.6.1.4 Electronic Weighing Scale Market Size & Forecast, By End-User, 2021 – 2032

  9.2.6.2 Canada

   9.2.6.2.1 Electronic Weighing Scale Market Size & Forecast, By Type, 2021 – 2032

   9.2.6.2.2 Electronic Weighing Scale Market Size & Forecast, By Application, 2021 – 2032

   9.2.6.2.3 Electronic Weighing Scale Market Size & Forecast, By Distribution Channel, 2021 – 2032

   9.2.6.2.4 Electronic Weighing Scale Market Size & Forecast, By End-User, 2021 – 2032

9.3 Europe

 9.3.1 Key Trends

 9.3.2 Electronic Weighing Scale Market Size & Forecast, By Type, 2021 – 2032

 9.3.3 Electronic Weighing Scale Market Size & Forecast, By Application, 2021 – 2032

 9.3.4 Electronic Weighing Scale Market Size & Forecast, By Distribution Channel, 2021 – 2032

 9.3.5 Electronic Weighing Scale Market Size & Forecast, By End-User, 2021 – 2032

 9.3.6 Electronic Weighing Scale Market Size & Forecast, By Country, 2021 – 2032

  9.3.6.1 Germany

   9.3.6.1.1 Electronic Weighing Scale Market Size & Forecast, By Type, 2021 – 2032

   9.3.6.1.2 Electronic Weighing Scale Market Size & Forecast, By Application, 2021 – 2032

   9.3.6.1.3 Electronic Weighing Scale Market Size & Forecast, By Distribution Channel, 2021 – 2032

   9.3.6.1.4 Electronic Weighing Scale Market Size & Forecast, By End-User, 2021 – 2032

  9.3.6.2 UK

   9.3.6.2.1 Electronic Weighing Scale Market Size & Forecast, By Type, 2021 – 2032

   9.3.6.2.2 Electronic Weighing Scale Market Size & Forecast, By Application, 2021 – 2032

   9.3.6.2.3 Electronic Weighing Scale Market Size & Forecast, By Distribution Channel, 2021 – 2032

   9.3.6.2.4 Electronic Weighing Scale Market Size & Forecast, By End-User, 2021 – 2032

  9.3.6.3 France

   9.3.6.3.1 Electronic Weighing Scale Market Size & Forecast, By Type, 2021 – 2032

   9.3.6.3.2 Electronic Weighing Scale Market Size & Forecast, By Application, 2021 – 2032

   9.3.6.3.3 Electronic Weighing Scale Market Size & Forecast, By Distribution Channel, 2021 – 2032

   9.3.6.3.4 Electronic Weighing Scale Market Size & Forecast, By End-User, 2021 – 2032

  9.3.6.4 Italy

   9.3.6.4.1 Electronic Weighing Scale Market Size & Forecast, By Type, 2021 – 2032

   9.3.6.4.2 Electronic Weighing Scale Market Size & Forecast, By Application, 2021 – 2032

   9.3.6.4.3 Electronic Weighing Scale Market Size & Forecast, By Distribution Channel, 2021 – 2032

   9.3.6.4.4 Electronic Weighing Scale Market Size & Forecast, By End-User, 2021 – 2032

  9.3.6.5 Spain

   9.3.6.5.1 Electronic Weighing Scale Market Size & Forecast, By Type, 2021 – 2032

   9.3.6.5.2 Electronic Weighing Scale Market Size & Forecast, By Application, 2021 – 2032

   9.3.6.5.3 Electronic Weighing Scale Market Size & Forecast, By Distribution Channel, 2021 – 2032

   9.3.6.5.4 Electronic Weighing Scale Market Size & Forecast, By End-User, 2021 – 2032

  9.3.6.6 Russia

   9.3.6.6.1 Electronic Weighing Scale Market Size & Forecast, By Type, 2021 – 2032

   9.3.6.6.2 Electronic Weighing Scale Market Size & Forecast, By Application, 2021 – 2032

   9.3.6.6.3 Electronic Weighing Scale Market Size & Forecast, By Distribution Channel, 2021 – 2032

   9.3.6.6.4 Electronic Weighing Scale Market Size & Forecast, By End-User, 2021 – 2032

  9.3.6.7 Poland

   9.3.6.7.1 Electronic Weighing Scale Market Size & Forecast, By Type, 2021 – 2032

   9.3.6.7.2 Electronic Weighing Scale Market Size & Forecast, By Application, 2021 – 2032

   9.3.6.7.3 Electronic Weighing Scale Market Size & Forecast, By Distribution Channel, 2021 – 2032

   9.3.6.7.4 Electronic Weighing Scale Market Size & Forecast, By End-User, 2021 – 2032

  9.3.6.8 Rest of Europe

   9.3.6.8.1 Electronic Weighing Scale Market Size & Forecast, By Type, 2021 – 2032

   9.3.6.8.2 Electronic Weighing Scale Market Size & Forecast, By Application, 2021 – 2032

   9.3.6.8.3 Electronic Weighing Scale Market Size & Forecast, By Distribution Channel, 2021 – 2032

   9.3.6.8.4 Electronic Weighing Scale Market Size & Forecast, By End-User, 2021 – 2032   

9.4 Asia-Pacific

 9.4.1 Key Trends

 9.4.2 Electronic Weighing Scale Market Size & Forecast, By Type, 2021 – 2032

 9.4.3 Electronic Weighing Scale Market Size & Forecast, By Application, 2021 – 2032

 9.4.4 Electronic Weighing Scale Market Size & Forecast, By Distribution Channel, 2021 – 2032

 9.4.5 Electronic Weighing Scale Market Size & Forecast, By End-User, 2021 – 2032

 9.4.6 Electronic Weighing Scale Market Size & Forecast, By Country, 2021 – 2032

  9.4.6.1 China

   9.4.6.1.1 Electronic Weighing Scale Market Size & Forecast, By Type, 2021 – 2032

   9.4.6.1.2 Electronic Weighing Scale Market Size & Forecast, By Application, 2021 – 2032

   9.4.6.1.3 Electronic Weighing Scale Market Size & Forecast, By Distribution Channel, 2021 – 2032

   9.4.6.1.4 Electronic Weighing Scale Market Size & Forecast, By End-User, 2021 – 2032

  9.4.6.2 India

   9.4.6.2.1 Electronic Weighing Scale Market Size & Forecast, By Type, 2021 – 2032

   9.4.6.2.2 Electronic Weighing Scale Market Size & Forecast, By Application, 2021 – 2032

   9.4.6.2.3 Electronic Weighing Scale Market Size & Forecast, By Distribution Channel, 2021 – 2032

   9.4.6.2.4 Electronic Weighing Scale Market Size & Forecast, By End-User, 2021 – 2032

  9.4.6.3 Japan

   9.4.6.3.1 Electronic Weighing Scale Market Size & Forecast, By Type, 2021 – 2032

   9.4.6.3.2 Electronic Weighing Scale Market Size & Forecast, By Application, 2021 – 2032

   9.4.6.3.3 Electronic Weighing Scale Market Size & Forecast, By Distribution Channel, 2021 – 2032

   9.4.6.3.4 Electronic Weighing Scale Market Size & Forecast, By End-User, 2021 – 2032

  9.4.6.4 South Korea

   9.4.6.4.1 Electronic Weighing Scale Market Size & Forecast, By Type, 2021 – 2032

   9.4.6.4.2 Electronic Weighing Scale Market Size & Forecast, By Application, 2021 – 2032

   9.4.6.4.3 Electronic Weighing Scale Market Size & Forecast, By Distribution Channel, 2021 – 2032

   9.4.6.4.4 Electronic Weighing Scale Market Size & Forecast, By End-User, 2021 – 2032

  9.4.6.5 Australia

   9.4.6.5.1 Electronic Weighing Scale Market Size & Forecast, By Type, 2021 – 2032

   9.4.6.5.2 Electronic Weighing Scale Market Size & Forecast, By Application, 2021 – 2032

   9.4.6.5.3 Electronic Weighing Scale Market Size & Forecast, By Distribution Channel, 2021 – 2032

   9.4.6.5.4 Electronic Weighing Scale Market Size & Forecast, By End-User, 2021 – 2032

  9.4.6.6 ASEAN Countries

   9.4.6.6.1 Electronic Weighing Scale Market Size & Forecast, By Type, 2021 – 2032

   9.4.6.6.2 Electronic Weighing Scale Market Size & Forecast, By Application, 2021 – 2032

   9.4.6.6.3 Electronic Weighing Scale Market Size & Forecast, By Distribution Channel, 2021 – 2032

   9.4.6.6.4 Electronic Weighing Scale Market Size & Forecast, By End-User, 2021 – 2032

  9.4.6.7 Rest of Asia-Pacific

   9.4.6.7.1 Electronic Weighing Scale Market Size & Forecast, By Type, 2021 – 2032

   9.4.6.7.2 Electronic Weighing Scale Market Size & Forecast, By Application, 2021 – 2032

   9.4.6.7.3 Electronic Weighing Scale Market Size & Forecast, By Distribution Channel, 2021 – 2032

   9.4.6.7.4 Electronic Weighing Scale Market Size & Forecast, By End-User, 2021 – 2032

9.5 Latin America

 9.5.1 Key Trends

 9.5.2 Electronic Weighing Scale Market Size & Forecast, By Type, 2021 – 2032

 9.5.3 Electronic Weighing Scale Market Size & Forecast, By Application, 2021 – 2032

 9.5.4 Electronic Weighing Scale Market Size & Forecast, By Distribution Channel, 2021 – 2032

 9.5.5 Electronic Weighing Scale Market Size & Forecast, By End-User, 2021 – 2032

 9.5.6 Electronic Weighing Scale Market Size & Forecast, By Country, 2021 – 2032

  9.5.6.1 Brazil

   9.5.6.1.1 Electronic Weighing Scale Market Size & Forecast, By Type, 2021 – 2032

   9.5.6.1.2 Electronic Weighing Scale Market Size & Forecast, By Application, 2021 – 2032

   9.5.6.1.3 Electronic Weighing Scale Market Size & Forecast, By Distribution Channel, 2021 – 2032

   9.5.6.1.4 Electronic Weighing Scale Market Size & Forecast, By End-User, 2021 – 2032

  9.5.6.2 Argentina

   9.5.6.2.1 Electronic Weighing Scale Market Size & Forecast, By Type, 2021 – 2032

   9.5.6.2.2 Electronic Weighing Scale Market Size & Forecast, By Application, 2021 – 2032

   9.5.6.2.3 Electronic Weighing Scale Market Size & Forecast, By Distribution Channel, 2021 – 2032

   9.5.6.2.4 Electronic Weighing Scale Market Size & Forecast, By End-User, 2021 – 2032

  9.5.6.3 Mexico

   9.5.6.3.1 Electronic Weighing Scale Market Size & Forecast, By Type, 2021 – 2032

   9.5.6.3.2 Electronic Weighing Scale Market Size & Forecast, By Application, 2021 – 2032

   9.5.6.3.3 Electronic Weighing Scale Market Size & Forecast, By Distribution Channel, 2021 – 2032

   9.5.6.3.4 Electronic Weighing Scale Market Size & Forecast, By End-User, 2021 – 2032

  9.5.6.4 Colombia

   9.5.6.4.1 Electronic Weighing Scale Market Size & Forecast, By Type, 2021 – 2032

   9.5.6.4.2 Electronic Weighing Scale Market Size & Forecast, By Application, 2021 – 2032

   9.5.6.4.3 Electronic Weighing Scale Market Size & Forecast, By Distribution Channel, 2021 – 2032

   9.5.6.4.4 Electronic Weighing Scale Market Size & Forecast, By End-User, 2021 – 2032

  9.5.6.5 Rest of Latin America

   9.5.6.5.1 Electronic Weighing Scale Market Size & Forecast, By Type, 2021 – 2032

   9.5.6.5.2 Electronic Weighing Scale Market Size & Forecast, By Application, 2021 – 2032

   9.5.6.5.3 Electronic Weighing Scale Market Size & Forecast, By Distribution Channel, 2021 – 2032

   9.5.6.5.4 Electronic Weighing Scale Market Size & Forecast, By End-User, 2021 – 2032

9.6 Middle East & Africa

 9.6.1 Key Trends

 9.6.2 Electronic Weighing Scale Market Size & Forecast, By Type, 2021 – 2032

 9.6.3 Electronic Weighing Scale Market Size & Forecast, By Application, 2021 – 2032

 9.6.4 Electronic Weighing Scale Market Size & Forecast, By Distribution Channel, 2021 – 2032

 9.6.5 Electronic Weighing Scale Market Size & Forecast, By End-User, 2021 – 2032

 9.6.6 Electronic Weighing Scale Market Size & Forecast, By Country, 2021 – 2032

  9.6.6.1 UAE

   9.6.6.1.1 Electronic Weighing Scale Market Size & Forecast, By Type, 2021 – 2032

   9.6.6.1.2 Electronic Weighing Scale Market Size & Forecast, By Application, 2021 – 2032

   9.6.6.1.3 Electronic Weighing Scale Market Size & Forecast, By Distribution Channel, 2021 – 2032

   9.6.6.1.4 Electronic Weighing Scale Market Size & Forecast, By End-User, 2021 – 2032

  9.6.6.2 Saudi Arabia

   9.6.6.2.1 Electronic Weighing Scale Market Size & Forecast, By Type, 2021 – 2032

   9.6.6.2.2 Electronic Weighing Scale Market Size & Forecast, By Application, 2021 – 2032

   9.6.6.2.3 Electronic Weighing Scale Market Size & Forecast, By Distribution Channel, 2021 – 2032

   9.6.6.2.4 Electronic Weighing Scale Market Size & Forecast, By End-User, 2021 – 2032

  9.6.6.3 Qatar

   9.6.6.3.1 Electronic Weighing Scale Market Size & Forecast, By Type, 2021 – 2032

   9.6.6.3.2 Electronic Weighing Scale Market Size & Forecast, By Application, 2021 – 2032

   9.6.6.3.3 Electronic Weighing Scale Market Size & Forecast, By Distribution Channel, 2021 – 2032

   9.6.6.3.4 Electronic Weighing Scale Market Size & Forecast, By End-User, 2021 – 2032

  9.6.6.4 Egypt

   9.6.6.4.1 Electronic Weighing Scale Market Size & Forecast, By Type, 2021 – 2032

   9.6.6.4.2 Electronic Weighing Scale Market Size & Forecast, By Application, 2021 – 2032

   9.6.6.4.3 Electronic Weighing Scale Market Size & Forecast, By Distribution Channel, 2021 – 2032

   9.6.6.4.4 Electronic Weighing Scale Market Size & Forecast, By End-User, 2021 – 2032

  9.6.6.5 South Africa

   9.6.6.5.1 Electronic Weighing Scale Market Size & Forecast, By Type, 2021 – 2032

   9.6.6.5.2 Electronic Weighing Scale Market Size & Forecast, By Application, 2021 – 2032

   9.6.6.5.3 Electronic Weighing Scale Market Size & Forecast, By Distribution Channel, 2021 – 2032

   9.6.6.5.4 Electronic Weighing Scale Market Size & Forecast, By End-User, 2021 – 2032

  9.6.6.6 Rest of Middle East & Africa

   9.6.6.6.1 Electronic Weighing Scale Market Size & Forecast, By Type, 2021 – 2032

   9.6.6.6.2 Electronic Weighing Scale Market Size & Forecast, By Application, 2021 – 2032

   9.6.6.6.3 Electronic Weighing Scale Market Size & Forecast, By Distribution Channel, 2021 – 2032

   9.6.6.6.4 Electronic Weighing Scale Market Size & Forecast, By End-User, 2021 – 2032

10. Competitive Landscape

 10.1 Key Players' Positioning

 10.2 Competitive Developments

  10.2.1 Key Strategies Adopted (%), By Key Players, 2024

  10.2.2 Year-Wise Strategies & Development, 2021 – 2025

  10.2.3 Number Of Strategies Adopted By Key Players, 2024

 10.3 Market Share Analysis, 2024

 10.4 Product/Service & Application Benchmarking

  10.4.1 Product/Service Specifications & Features By Key Players

  10.4.2 Product/Service Heatmap By Key Players

  10.4.3 Application Heatmap By Key Players

 10.5 Industry Start-Up & Innovation Landscape

10.6 Key Company Profiles

 10.6.1 Mettler-Toledo International Inc.

  10.6.1.1 Company Overview & Snapshot

  10.6.1.2 Product/Service Portfolio

  10.6.1.3 Key Company Financials

  10.6.1.4 SWOT Analysis

 10.6.2 A&D Company, Limited

  10.6.2.1 Company Overview & Snapshot

  10.6.2.2 Product/Service Portfolio

  10.6.2.3 Key Company Financials

  10.6.2.4 SWOT Analysis

 10.6.3 Avery Weigh-Tronix LLC

  10.6.3.1 Company Overview & Snapshot

  10.6.3.2 Product/Service Portfolio

  10.6.3.3 Key Company Financials

  10.6.3.4 SWOT Analysis

 10.6.4 Adam Equipment Co. Ltd.

  10.6.4.1 Company Overview & Snapshot

  10.6.4.2 Product/Service Portfolio

  10.6.4.3 Key Company Financials

  10.6.4.4 SWOT Analysis

 10.6.5 Kern & Sohn GmbH

  10.6.5.1 Company Overview & Snapshot

  10.6.5.2 Product/Service Portfolio

  10.6.5.3 Key Company Financials

  10.6.5.4 SWOT Analysis

 10.6.6 Shimadzu Corporation

  10.6.6.1 Company Overview & Snapshot

  10.6.6.2 Product/Service Portfolio

  10.6.6.3 Key Company Financials

  10.6.6.4 SWOT Analysis

 10.6.7 Sartorius AG

  10.6.7.1 Company Overview & Snapshot

  10.6.7.2 Product/Service Portfolio

  10.6.7.3 Key Company Financials

  10.6.7.4 SWOT Analysis

 10.6.8 Fairbanks Scales Inc.

  10.6.8.1 Company Overview & Snapshot

  10.6.8.2 Product/Service Portfolio

  10.6.8.3 Key Company Financials

  10.6.8.4 SWOT Analysis

 10.6.9 Essae-Teraoka Pvt. Ltd.

  10.6.9.1 Company Overview & Snapshot

  10.6.9.2 Product/Service Portfolio

  10.6.9.3 Key Company Financials

  10.6.9.4 SWOT Analysis

 10.6.10 CAS Corporation

  10.6.10.1 Company Overview & Snapshot

  10.6.10.2 Product/Service Portfolio

  10.6.10.3 Key Company Financials

  10.6.10.4 SWOT Analysis

 10.6.11 Tanita Corporation

  10.6.11.1 Company Overview & Snapshot

  10.6.11.2 Product/Service Portfolio

  10.6.11.3 Key Company Financials

  10.6.11.4 SWOT Analysis

 10.6.12 OHAUS Corporation

  10.6.12.1 Company Overview & Snapshot

  10.6.12.2 Product/Service Portfolio

  10.6.12.3 Key Company Financials

  10.6.12.4 SWOT Analysis

 10.6.13 Rice Lake Weighing Systems

  10.6.13.1 Company Overview & Snapshot

  10.6.13.2 Product/Service Portfolio

  10.6.13.3 Key Company Financials

  10.6.13.4 SWOT Analysis

 10.6.14 Contech Instruments Ltd.

  10.6.14.1 Company Overview & Snapshot

  10.6.14.2 Product/Service Portfolio

  10.6.14.3 Key Company Financials

  10.6.14.4 SWOT Analysis

 10.6.15 Doran Scales, Inc.

  10.6.15.1 Company Overview & Snapshot

  10.6.15.2 Product/Service Portfolio

  10.6.15.3 Key Company Financials

  10.6.15.4 SWOT Analysis

 10.6.16 Salter Brecknell

  10.6.16.1 Company Overview & Snapshot

  10.6.16.2 Product/Service Portfolio

  10.6.16.3 Key Company Financials

  10.6.16.4 SWOT Analysis

 10.6.17 Weightron Bilanciai Ltd.

  10.6.17.1 Company Overview & Snapshot

  10.6.17.2 Product/Service Portfolio

  10.6.17.3 Key Company Financials

  10.6.17.4 SWOT Analysis

 10.6.18 Torbal Scales

  10.6.18.1 Company Overview & Snapshot

  10.6.18.2 Product/Service Portfolio

  10.6.18.3 Key Company Financials

  10.6.18.4 SWOT Analysis

 10.6.19 Digiweigh USA

  10.6.19.1 Company Overview & Snapshot

  10.6.19.2 Product/Service Portfolio

  10.6.19.3 Key Company Financials

  10.6.19.4 SWOT Analysis

 10.6.20 Citizen Scales Pvt. Ltd.

  10.6.20.1 Company Overview & Snapshot

  10.6.20.2 Product/Service Portfolio

  10.6.20.3 Key Company Financials

  10.6.20.4 SWOT Analysis

11. Analyst Recommendations

 11.1 SNS Insider Opportunity Map

 11.2 Industry Low-Hanging Fruit Assessment

 11.3 Market Entry & Growth Strategy

 11.4 Analyst Viewpoint & Suggestions On Market Growth

12. Assumptions

13. Disclaimer

14. Appendix

 14.1 List Of Tables

 14.2 List Of Figures

Key Segments: 

By Type

  • Laboratory scales

  • Gem and jewellery scales

  • Retail scales

  • Health scales

  • Kitchen scales

  • Others   

By Application

  • Food and beverage

  • Manufacturing

  • Healthcare

  • Retail

  • Logistics

  • Others

By Distribution Channel

  • Online

  • Offline

By End-User

  • Commercial

  • Industrial

Request for Segment Customization as per your Business Requirement: Segment Customization Request

Regional Coverage:

North America

  • US

  • Canada

Europe

  • Germany

  • UK

  • France

  • Italy

  • Spain

  • Russia

  • Poland

  • Rest of Europe

Asia Pacific

  • China

  • India

  • Japan

  • South Korea

  • Australia

  • ASEAN Countries

  • Rest of Asia Pacific

Middle East & Africa

  • UAE

  • Saudi Arabia

  • Qatar

  • South Africa

  • Rest of Middle East & Africa

Latin America

  • Brazil

  • Argentina

  • Mexico

  • Colombia

  • Rest of Latin America

Request for Country Level Research Report: Country Level Customization Request

Available Customization 

With the given market data, SNS Insider offers customization as per the company’s specific needs. The following customization options are available for the report: 

  • Detailed Volume Analysis 

  • Criss-Cross segment analysis (e.g. Product X Application) 

  • Competitive Product Benchmarking 

  • Geographic Analysis 

  • Additional countries in any of the regions 

  • Customized Data Representation 

  • Detailed analysis and profiling of additional market players

An accurate research report requires proper strategizing as well as implementation. There are multiple factors involved in the completion of good and accurate research report and selecting the best methodology to compete the research is the toughest part. Since the research reports we provide play a crucial role in any company’s decision-making process, therefore we at SNS Insider always believe that we should choose the best method which gives us results closer to reality. This allows us to reach at a stage wherein we can provide our clients best and accurate investment to output ratio.

Each report that we prepare takes a timeframe of 350-400 business hours for production. Starting from the selection of titles through a couple of in-depth brain storming session to the final QC process before uploading our titles on our website we dedicate around 350 working hours. The titles are selected based on their current market cap and the foreseen CAGR and growth.


The 5 steps process:

Step 1: Secondary Research:

Secondary Research or Desk Research is as the name suggests is a research process wherein, we collect data through the readily available information. In this process we use various paid and unpaid databases which our team has access to and gather data through the same. This includes examining of listed companies’ annual reports, Journals, SEC filling etc. Apart from this our team has access to various associations across the globe across different industries. Lastly, we have exchange relationships with various university as well as individual libraries.

Secondary Research

Step 2: Primary Research

When we talk about primary research, it is a type of study in which the researchers collect relevant data samples directly, rather than relying on previously collected data.  This type of research is focused on gaining content specific facts that can be sued to solve specific problems. Since the collected data is fresh and first hand therefore it makes the study more accurate and genuine.

We at SNS Insider have divided Primary Research into 2 parts.

Part 1 wherein we interview the KOLs of major players as well as the upcoming ones across various geographic regions. This allows us to have their view over the market scenario and acts as an important tool to come closer to the accurate market numbers. As many as 45 paid and unpaid primary interviews are taken from both the demand and supply side of the industry to make sure we land at an accurate judgement and analysis of the market.

This step involves the triangulation of data wherein our team analyses the interview transcripts, online survey responses and observation of on filed participants. The below mentioned chart should give a better understanding of the part 1 of the primary interview.

Primary Research

Part 2: In this part of primary research the data collected via secondary research and the part 1 of the primary research is validated with the interviews from individual consultants and subject matter experts.

Consultants are those set of people who have at least 12 years of experience and expertise within the industry whereas Subject Matter Experts are those with at least 15 years of experience behind their back within the same space. The data with the help of two main processes i.e., FGDs (Focused Group Discussions) and IDs (Individual Discussions). This gives us a 3rd party nonbiased primary view of the market scenario making it a more dependable one while collation of the data pointers.

Step 3: Data Bank Validation

Once all the information is collected via primary and secondary sources, we run that information for data validation. At our intelligence centre our research heads track a lot of information related to the market which includes the quarterly reports, the daily stock prices, and other relevant information. Our data bank server gets updated every fortnight and that is how the information which we collected using our primary and secondary information is revalidated in real time.

Data Bank Validation

Step 4: QA/QC Process

After all the data collection and validation our team does a final level of quality check and quality assurance to get rid of any unwanted or undesired mistakes. This might include but not limited to getting rid of the any typos, duplication of numbers or missing of any important information. The people involved in this process include technical content writers, research heads and graphics people. Once this process is completed the title gets uploader on our platform for our clients to read it.

Step 5: Final QC/QA Process:

This is the last process and comes when the client has ordered the study. In this process a final QA/QC is done before the study is emailed to the client. Since we believe in giving our clients a good experience of our research studies, therefore, to make sure that we do not lack at our end in any way humanly possible we do a final round of quality check and then dispatch the study to the client.