TV Signal Analyzer Market Size & Trends:
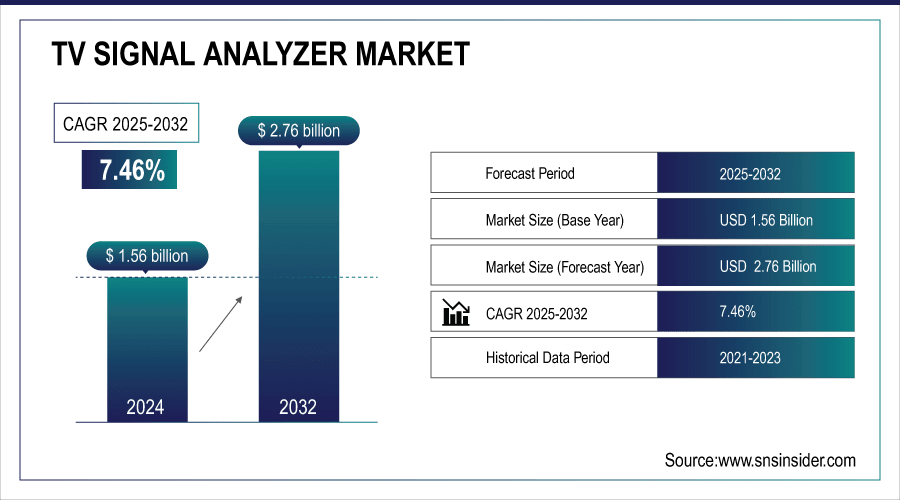
The TV Signal Analyzer Market size was valued at USD 1.56 billion in 2024 and is expected to reach USD 2.76 billion by 2032 and grow at a CAGR of 7.46% over the forecast period of 2025-2032.
The global market includes comprehensive TV signal analyzer market analysis by segmentation based on product type, application, technology, end-user, and region. Along market dynamics, it also depicts drivers, restraint, opportunities, and challenges in front of its players. These demands along with the explosion of advanced telecommunication infrastructure, which is anticipated to increase the quality standards of high definition or 3D video and gain popularity amongst digital signal analyzers utilizers across sectors, are expected to act as a market expansion propelling factor. The market is also likely to expand due to continuous technological developments and the demand for accurate signal monitoring over the forecast period.
For instance, over 60% of live broadcasters now rely on digital signal analyzers.
To Get more information on TV signal analyzer market - Request Free Sample Report
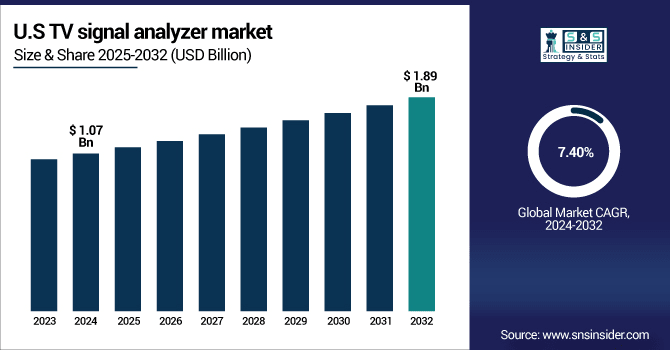
The U.S. TV signal analyzer market size was USD 1.07 billion in 2024 and is expected to reach USD 1.89 billion by 2032, growing at a CAGR of 7.40% over the forecast period of 2025–2032.
The U.S. market is further expected to grow due to extensive transmission networks for digital broadcasting, increase in satellite communication services, and growing investment in high-definition and 4K video distribution. The rapid growth in technology, and the rise in demand for the telecommunication and defense industries, are also contributing to the growing popularity of the market. This strengthens the place of U.S. as the largest market in North America and likely to have steady TV signal analyzer market growth throughout the forecast period owing to solid overall infrastructure development and need for advanced signal monitoring.
For instance, over 55% of U.S. telecommunication operators now use advanced TV signal analyzers to monitor multiple channels in real time.
TV Signal Analyzer Market Dynamics:
Key Drivers:
-
Rising Adoption of Digital Broadcasting Networks and Infrastructure Investments Globally Driving TV Signal Analyzer Market Growth
With increasing global momentum of digital broadcasting networks, advanced TV signal analyzers that one can provide accurate monitoring and optimization of the highest quality signal needed are needed. With many broadcasters looking long-term to upgrade infrastructure capable of not just HD and 4K, but IP-based content transmission, they are pouring the funds into solution upgrades. The expansion of this growing infrastructure creates a need for signal analyzers with high accuracy and real-time diagnostics. Additionally, demand for efficiency spectrum usage, lower signal interference, and compliance with rules and regulations is further boosting the demand for TV signal analyzers in both commercial and professional applications.
For instance, more than 50% of professional broadcasting facilities rely on handheld or benchtop signal analyzers for real-time diagnostics and signal optimization.
Restraints:
-
High Cost and Complexity of Advanced TV Signal Analyzers Restricting Market Growth Potential
Advanced TV signal analyzers generally come at a high cost, which limits adoption–especially by small broadcasters and new telecommunication providers. They also require skilled personnel to set up, calibrate and maintain their complex operation. Continuous software and technical skill maintenance creates added operational overhead. While the demand for advanced monitoring solutions is on the rise, especially in the broadcasting, telecommunication and defense sector globally, this financial and technical barrier can potentially restrict smaller organizations to invest in state-of-the-art analyzers thereby restricting the market penetration for the modern analyzers.
Opportunities:
-
Integration of Artificial Intelligence and IoT Solutions Creating New TV Signal Analyzer Market Opportunities
Integration of AI and IoT technologies with TV signal analyzers is ushering in a vast range of opportunities for higher automation and remote, real-time monitoring, and predictive maintenance. With smart analyzers, one can identify signal degradation, trigger frequency allocation, and even highlight recommendations without the need for any manual effort. This allows Broadcasters and Telecommunication operators to operate at lower costs while strengthening the signal and network management here and there. This offers lucrative opportunities for key players in the market to offer more innovative, intelligent signal analyzers in response to the growing adoption of AI-powered monitoring solutions across various industries to meet evolving digital and smart broadcasting demands.
For instance, implementation of AI and IoT-enabled analyzers has helped over 50% of operators reduce manual interventions by up to 40% while enhancing network efficiency.
Challenges:
-
Rapid Technological Advancements in Signal Processing Creating Operational Challenges for TV Signal Analyzer Manufacturers
The rapid rate of development in digital signal processing, spectrum monitoring, and analyzer functionality leads to difficulties for manufacturers when trying to keep up with the technological evolution process. More frequent updates, the need to accommodate new communication standards and the desire for more complex, portable devices are all factors that increase development complexity. Advertising huge amounts of money into R&D to provide people with state-of-the-art products that also full felt tested to be more economic during this time period. Achieving the right trade-off between performance, accuracy, and cost is a major challenge, especially for small and mid-sized manufacturers. This technical push causes a necessity of innovations for meeting market demands while not compromising product quality.
TV Signal Analyzer Market Segmentation Analysis:
By Technology
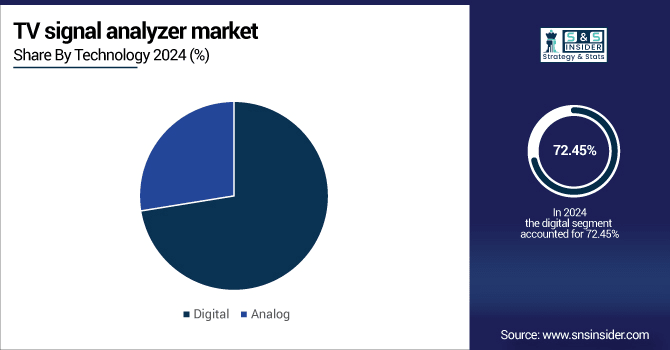
Digital technology generated around 72.45% share of revenue in 2024 and this segment is projected to witness the fastest growth rate of 7.39% over the period 2024-2032 owing to swift penetration of digital broadcasting and satellite systems. High-performance digital analyzers such as those manufactured by Keysight Technologies are used for telecommunication, broadcasting, and defense purposes. These are crucial devices that provide knowledge of advanced features, real-time diagnostics, and efficient monitoring of complex digital signals that other devices include market leadership.
By Product Type
In 2024, Benchtop Analyzers accounted for a revenue share of approximately 53.95% and dominated the TV Signal Analyzer market in the year 2024, primarily due to their high-performance measurement capabilities which are often considered as a measurement standard and the advanced features that comes with it that delivers outstanding performance. Keysight Technologies delivers benchtop analyzers in the premium segment for laboratories and other industrial applications that require high accuracy. Globally, they are unrivaled – due to their stability, wide feature set and adoption by professional broadcasters, telecomm operators, and defense sectors.
Handheld analyzers are foreseen to fuel a staggering CAGR of 8.29% during 2024-2032 attributed to the portability and user-friendliness they offer in field applications. The rugged handheld devices from Rohde & Schwarz are favored among technicians and engineers for on-site diagnostics and real-time signal monitoring. The rapid adoption of handheld test tools to speed broadband, telecommunication and satellite infrastructure projects is powered by compact size, flexibility and the capability to perform all critical tests without a laboratory.
By Application
In 2024, broadcasting segment accounted for the largest TV signal analyzer market share of 45.20% during the forecast period as broadcasters depend on real time monitoring of signal quality for providing high definition, high dwell time and high impact broadcast delivery. Tektronix SolutionsTektronix offers high-performance analyzer solutions to avoid interruption in live transmissions and lower interference. This segment is continuously leading the market owing to the increasing demand for quality content delivery and the professional network reliance on accurate monitoring.
Telecommunication segment is expected to record the fastest CAGR of 8.46% during the forecast period of 2024–2032. Telecom operators utilize Anritsu’s analyzers for accurate monitoring of signal strength, frequency allocation, and interference detection. The rising data traffic and the complex nature of the network in addition to the requirement of having a reliable high-speed connection are the factors that will boost the growth of the signal analyzers market for network management and assurance.
By End-User
Broadcasting Stations accounted for the majority of the revenue share in the market, at 50.20% in 2024 due to continuous signal monitoring and uninterrupted content delivery. Tektronix is in the business of providing analyzers that are very common in TV networks for checking quality and integrity of the signals. These ensure that high definition transmission is achieved and there is minimal interference, which is why the segment is predominantly leading in the market.
The Satellite Providers segment is projected to witness the highest growth in the region with a CAGR of 9.05% throughout the forecast period of 2024-2032 owing to continuous growth in satellite TV services and demand for direct-to-home broadcasting. Anritsu analyzers are widely used to monitor, troubleshoot and optimize satellite signals. The need for reconnaissance and surveillance applications for commercial and defense purposes will lead to a surge in sales of satellite based communication systems, enabling rapid adoption of this end-user vertical.
TV Signal Analyzer Market Regional Outlook:
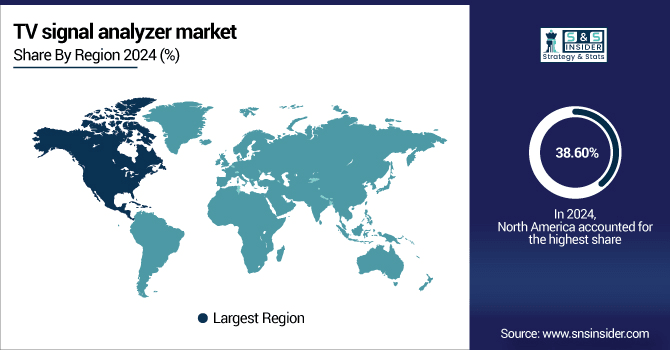
North America represented the leading sales with approximately 38.60% of the total revenue market, due in part to factors such as a number of important manufacturers, developed broadcasting and telecommunication infrastructure, and early adoption of digital signal analyzers. The application demand for the U.S. broadcast, telecommunication, and defense sectors along with the technological advancements and high R&D investments in the region have ensured dominance over the forecast period.
Get Customized Report as per Your Business Requirement - Enquiry Now
-
The U.S. dominates North America due to advanced broadcasting and telecommunication infrastructure, high adoption of digital signal analyzers, strong R&D investments, and the presence of leading manufacturers ensuring continuous innovation and high-quality content delivery across industries.
The Asia Pacific region is projected to grow at the highest CAGR of approximately 8.88% during the forecast period 2024-2032, owing to rapid urbanization, expanding telecommunication and broadcasting infrastructure, and increasing adoption of HD/4K content. China, India and Japan are spending extensively on digital signal monitoring systems. Increasing demand from developing nations along with improved satellite and broadcasting networks are key factors to drive growth of the market in the region.
-
China leads Asia Pacific owing to rapid urbanization, massive investments in telecommunication and broadcasting networks, increasing HD/4K content demand, and adoption of advanced TV signal analyzers, making it the largest market contributor in the region with accelerated technological deployment.
Europe holds a significant share in the TV Signal Analyzer market, driven by advanced broadcasting infrastructure, adoption of digital and satellite technologies, and stringent regulatory standards for signal quality. Countries including Germany, France, and the UK invest heavily in high-definition content delivery and telecommunication networks, supporting strong demand for precise signal analyzers across broadcasting, telecom, and defense sectors throughout the region.
-
Germany leads the European TV Signal Analyzer market due to advanced broadcasting infrastructure, early adoption of digital and satellite technologies, strong industrial base, and substantial R&D investments, driving high demand for accurate and high-performance signal analyzers across multiple sectors.
The Middle East & Africa and Latin America TV Signal Analyzer markets are growing due to rising investments in broadcasting and telecommunication infrastructure. Key countries such as UAE, Saudi Arabia, Brazil, and Argentina are leading adoption, expanding digital and satellite networks, and driving demand for high-quality signal monitoring and content delivery.
TV Signal Analyzer Companies are:
Major Key Players in TV Signal Analyzer Market are Rohde & Schwarz GmbH, Keysight Technologies Inc., Tektronix, Inc., Anritsu Corporation, National Instruments Corporation, Yokogawa Electric Corporation, Advantest Corporation, B&K Precision Corporation, Teledyne LeCroy, Inc., LP Technologies Inc., Stanford Research Systems, Inc., Avcom of Virginia Inc., Micronix USA, Sencore, Inc., Altinex, Inc., PROMAX Electronica, Copper Mountain Technologies, EXFO Inc., Signal Hound and RigExpert and others.
Recent Developments:
-
In August 2024, Rohde & Schwarz launched the FSWX signal and spectrum analyzer, featuring a novel architecture with multiple input ports. This advancement allows for more complex signal analysis, catering to the growing demands of modern broadcasting and telecommunications.
-
In April 2024, Tektronix unveiled SignalVu Spectrum Analyzer Software Version 5.4, enabling the analysis of up to eight simultaneous signals. This update enhances the software's capabilities, allowing engineers to perform more comprehensive signal analysis in various applications.
| Report Attributes | Details |
|---|---|
| Market Size in 2024 | USD 1.56 Billion |
| Market Size by 2032 | USD 2.76 Billion |
| CAGR | CAGR of 7.46% From 2025 to 2032 |
| Base Year | 2024 |
| Forecast Period | 2025-2032 |
| Historical Data | 2021-2023 |
| Report Scope & Coverage | Market Size, Segments Analysis, Competitive Landscape, Regional Analysis, DROC & SWOT Analysis, Forecast Outlook |
| Key Segments | • By Product Type (Handheld, Portable and Benchtop) • By Application (Broadcasting, Telecommunication, Aerospace & Defense and Others) • By Technology (Digital and Analog) • By End-User (Broadcasting Stations, Cable Operators, Satellite Providers and Others) |
| Regional Analysis/Coverage | North America (US, Canada, Mexico), Europe (Germany, France, UK, Italy, Spain, Poland, Turkey, Rest of Europe), Asia Pacific (China, India, Japan, South Korea, Singapore, Australia, Taiwan, Rest of Asia Pacific), Middle East & Africa (UAE, Saudi Arabia, Qatar, South Africa, Rest of Middle East & Africa), Latin America (Brazil, Argentina, Rest of Latin America) |
| Company Profiles | Rohde & Schwarz GmbH & Co. KG, Keysight Technologies Inc., Tektronix, Inc., Anritsu Corporation, National Instruments Corporation, Yokogawa Electric Corporation, Advantest Corporation, B&K Precision Corporation, Teledyne LeCroy, Inc., LP Technologies Inc., Stanford Research Systems, Inc., Avcom of Virginia Inc., Micronix USA, Sencore, Inc., Altinex, Inc., PROMAX Electronica, Copper Mountain Technologies, EXFO Inc., Signal Hound and RigExpert. |
Frequently Asked Questions
North America dominated the TV Signal Analyzer Market in 2024.
The Digital segment dominated the TV Signal Analyzer Market in 2024.
The major growth factor is increasing demand for high-quality digital broadcasting, 4K/HD content, and real-time signal monitoring across industries.
The TV Signal Analyzer Market size was USD 1.56 Billion in 2024 and is expected to reach USD 2.76 Billion by 2032.
The TV Signal Analyzer Market is expected to grow at a CAGR of 7.46% from 2025-2032.
Get in Touch
