Electrostatic Precipitator Market Report Scope & Overview:
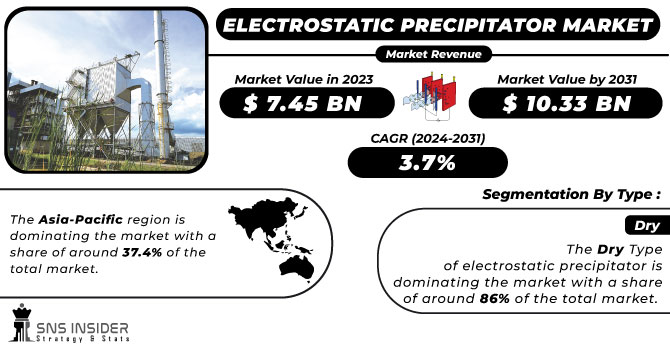
The Electrostatic Precipitator Market Size was estimated at USD 7.56 billion in 2023 and is expected to arrive at USD 11.52 billion by 2032 with a growing CAGR of 4.79% over the forecast period 2024-2032. This report offers a unique perspective on the Electrostatic Precipitator Market by analyzing installed base & capacity trends across key regions and utilization rates by industry, highlighting shifts in demand. It provides exclusive insights into maintenance & downtime metrics, helping industries optimize operational efficiency. The study examines technological adoption rates regionally, showcasing advancements like IoT-enabled ESPs and AI-driven monitoring systems. Additionally, export/import data offers a global trade outlook, revealing supply chain trends and regulatory impacts. Emerging trends, such as hybrid ESP systems and increasing adoption in biomass power plants, further differentiate this report.
Get More Information on Electrostatic Precipitator Market - Request Sample Report
Market Dynamics
Drivers
-
Stringent environmental regulations worldwide are driving demand for electrostatic precipitators as industries seek compliance with strict emission control standards.
Stringent environmental regulations are a key driver of the Electrostatic Precipitator Market, as governments globally enforce strict emission control measures to combat air pollution. The growing need for electrostatic precipitators to meet stringent standards aimed to limit particulate matter emissions in industries including power generation, cement, and steel manufacturing. Advanced air filtration technologies are mandated by regulatory frameworks such as the U.S. Clean Air Act, EU Industrial Emissions Directive, and India’s National Clean Air Program (NCAP). The growing environmental concerns and preference for smart, high-efficiency IoT-integrated electrostatic precipitators for real-time monitoring have been propelling the growth of the market. A shift towards wet electrostatic precipitators (WESP), which are better at removing fine particles, has been observed. Moreover, the upgrading and retrofitting of existing facilities as well as increasing investments in emission control across emerging economies, particularly in China and India, are also fuelling the evolution of the market while meeting the rising global air quality standards.
Restraint
-
The high initial investment and maintenance costs of electrostatic precipitators make them less accessible for small and medium-sized enterprises, limiting their adoption.
The adoption of electrostatic precipitators (ESPs) is often hindered by high initial investment and maintenance costs, making it challenging for small and medium-sized enterprises (SMEs) to implement this technology. New ESP installation involves a high CAPEX investment due to intricate equipment, engineering, and integration into existing plant infrastructure. Moreover, this creates a financial strain with the ongoing expenditures associated with upkeep, component replacement, and energy usage. For SMEs with limited financial resources to work with, such high costs are pushing them towards alternative air filtration technologies such as baghouse filters, which are nevertheless at lower efficiency levels than other competing technologies in some applications. Furthermore, ESPs must be manned by competent professionals to keep them performing properly, thereby increasing total operational costs. These economic constraints discourage industries that have variable revenues, like cement or metal processing, from investing in ESPs. This raises the need for cost-effective solutions and more government incentives to make ESP technology more widely available.
Opportunities
-
Retrofitting and upgrading electrostatic precipitators enhance efficiency, reduce emissions, and ensure compliance with stringent environmental regulations at a lower cost than new installations.
Retrofitting and upgrading existing electrostatic precipitator (ESP) systems have become essential as industries strive to meet increasingly stringent environmental regulations. Until then, because many older ESPs do not efficiently remove fine particulate matter, industries will invest in modernizing ESPs rather than replacing them entirely. Additionally, advances in high-frequency power supplies, hybrid filtration systems, and advanced control mechanisms serve to improve ESP performance, optimizing collection efficiency as well as lower emissions. Retrofitting enables industries to prolong the lifespan of existing machinery and lower the cost of compliance than at lower air quality standards than new setups. Such investment in ESP advancements is chiefly being adopted by the power generation, cement, steel, and chemical sectors for sustainable operation. Embracing automation and IoT-enabled monitoring also drive ESP performance for improved energy efficiency and lower maintenance costs. Retrofitting and upgrading ESPs, therefore, offer a cost- and time-effective means to abate pollution at the source, as nations across the world continue to place pressure on governments to reduce industrial emissions and strive for the cleaner, more sustainable processes of the future.
Challenges
-
Different industries require customized electrostatic precipitators to meet specific emission control needs, increasing design complexity and manufacturing costs.
Electrostatic precipitators (ESPs) must meet stringent industry-specific performance standards, which vary across sectors such as power generation, cement, steel, and chemicals. Different industries require different techniques to control emissions based on the pollutants they produce, operating temperatures, and gas compositions. For instance, coal-fired power plants demand high-efficiency ESPs to collect fine particulate matters, while cement industries produce high-temperature dusty gas that needs to be treated with heat resistant designs. Customization of ESP design (e.g., electrode configuration, plate spacing, and collection efficiency) makes the manufacturing process more complex and costly. Moreover, heavily regulated industries like pharmaceuticals and food processing use specialized ESPs to eliminate ultra-fine impurities while keeping their hardware hygienic. Fulfilling such a varied set of requirements requires constant evolution of technology, new material development and compliance with regulations; a real challenge for manufacturers. Because each ESP must have specific features that address the urgent needs of the different industries, the need for industry-specific ESP solutions leads to increased time-to-market, reduced scalability, and significant R&D effort, making industry-specific customization a key challenge for the ESP market.
Segmentation Analysis
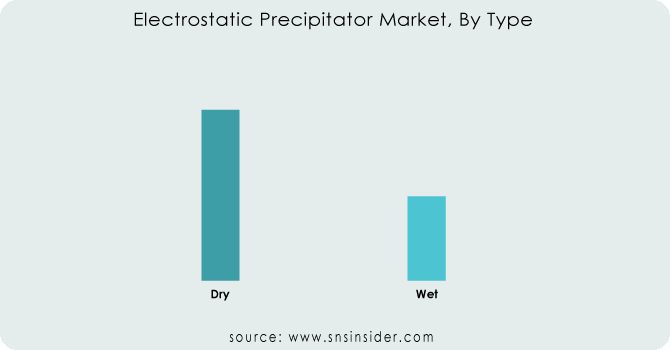
By Type
The Dry Electrostatic Precipitator (ESP) segment dominated with a market share of over 68% in 2023, due to its extensive use in industries such as power generation, cement, chemicals, and steel. Many industries need to remove particulates effectively to meet strict environmental standards. λDry ESPs effectively collect and eliminate fine dust, smoke, and other particulate matters from flue gases before they are released into the environment. Highlighted by the fact that they require very little maintenance while managing large volumes of gas, they are favored for industrial usage. Dry ESPs do not rely on site-supplied water the same way wet ESPs do, as the main essential, which addresses not only operational costs but also the challenge of wastewater issues. They also boast of long service life, high efficiency, and their adaptability to various industrial processes, which is important for steel and cement industries, adding to the dominance of global electrostatic precipitator market.
By Component
The Hardware segment dominated with a market share of over 52% in 2023, due to its essential role in air filtration systems. The discharge electrodes, collecting plates, hoppers, and power supply are key components of electrostatic precipitators. Rising industrial air pollution control in power plants, cement production, metal processing industry is also anticipated to fuel the segment growth. Furthermore, improvements in electrode design and high-voltage power supplies increase the electrostatic precipitators’ efficacy and longevity, which helps maintain the dominant hardware segment. In the current industrial milieu, redirecting towards strict emission laws, demand for hardware components functions as a bedrock for the component segment, maintaining its integrity to the market owing to their rigorous usage.
By End-User
The Power Industry segment dominated with a market share of over 34% in 2023, due to its significant role in controlling air pollution, particularly in coal-fired power plants. Owing to its substantial contribution to air pollution control across several industries, including coal-fired power plants. They are major emitters of particulates, which are known to impact air quality and degrade the environment. Strict global environmental regulations, for example, by the EPA and equivalent agencies, require effective emission controls like ESPs, to be installed to reduce particulate matter (PM) emissions. Electrostatic precipitators are extremely efficient particle capture devices, allowing widespread use in the power sector and compliance with these regulations. The power industry’s monopoly dependence on ESPs continues to be a central pillar of prevailing market domination as demand for cleaner energy and stricter environmental standards magnifies.
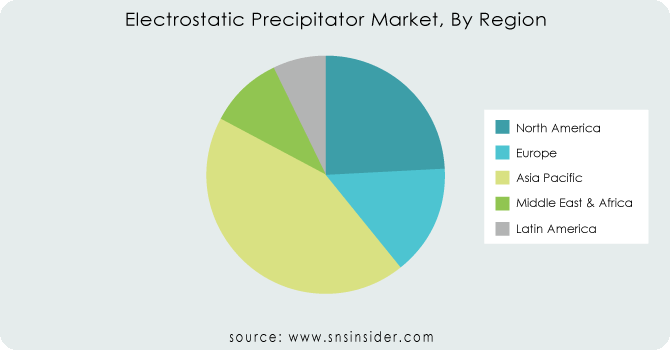
Regional Analysis
The Asia-Pacific region dominated with a market share of over 42% in 2023, owing to the large number of coal-fired power plants present in the region, especially in the countries such as China and India. These countries experience severe air pollution problems, as a result, they adopted strict environmental regulations to control emissions from industrial processes. Regulatory requirements for emission controls have become more stringent, enabling electrostatic precipitators to capture fine particulate matter with the highest efficiency. Additionally, the electricity demand has been propelled further due to rapid industrialization and insatiable energy appetite in Asia-Pacific, thereby fuelling the uptake of ESPs. However, as the region further develops and builds its industrialization, the demand for ESPs is expected to be strong, which, in turn, will maintain the position of the market leader in the global electrostatic precipitator market.
North America is the fastest-growing market for electrostatic precipitators (ESPs), primarily due to stringent environmental regulations and robust regulatory frameworks like the Clean Air Act in the United States. The most applicable are regulations limiting air pollution emissions, such as particulate matter, from power plants, cement plants, chemicals, and other industries. With growing environmental awareness and stricter emissions regulations set by governments, industries are incorporating high-end technologies such as ESPs to meet these requirements. If you tagged this as industrial activities reducing, and stopped technologies, this is because it gets of course much easier to have less environmental impact. As a result, demand for electrostatic precipitators in North America is increasing, and is projected to be the fastest-growing region in the global ESP market.
Key Players
Some of the major key players in the Electrostatic Precipitator Market
-
Siemens AG (Germany) – (ESP Control Systems, High-Voltage Power Supplies)
-
General Electric (US) – (Dry & Wet Electrostatic Precipitators, Retrofit Solutions)
-
Mitsubishi Hitachi Power Systems (Japan) – (Dry ESP, Hybrid ESP, Air Pollution Control Systems)
-
Babcock & Wilcox (US) – (Fabric Filter ESP, Wet ESP, Particulate Control Systems)
-
AMEC Foster Wheeler (UK) – (ESP for Industrial Boilers, Flue Gas Treatment)
-
Thermax (India) – (Dry ESP, Industrial Air Pollution Control)
-
Ducon Technologies (US) – (Wet & Dry ESP, Multi-Stage Precipitators)
-
Fujian Longking (China) – (Industrial ESP, Flue Gas Cleaning Systems)
-
Hamon Group (Belgium) – (Wet ESP, Electrostatic Precipitator Retrofit)
-
Trion (US) – (Commercial & Industrial ESP, Kitchen Emission Control)
-
FLSmidth (Denmark) – (Air Pollution Control ESP, Power Plant ESP)
-
KC Cottrell (South Korea) – (Industrial ESP, Air Filtration Systems)
-
Elex AG (Switzerland) – (High-Efficiency ESP, Flue Gas Cleaning)
-
Feida Group (China) – (Large-Scale ESP, Coal-Fired Power Plant ESP)
-
McGill AirClean (US) – (Wet ESP, Particulate Matter Control)
-
Scheuch GmbH (Austria) – (Dry ESP, Hybrid ESP for Industrial Applications)
-
Envitech Inc. (US) – (Wet ESP, Acid Mist Control Systems)
-
Bionomic Industries (US) – (Multi-Stage ESP, Corrosion-Resistant ESP)
-
Southern Environmental, Inc. (US) – (High-Voltage ESP, Power Industry ESP)
-
Hitachi Plant Technologies (Japan) – (ESP for Heavy Industries, Air Quality Systems)
Suppliers for the Electrostatic Precipitator Market
-
ALPHAIR
-
Blowtech Engineers
-
Pinakin Technology Solutions
-
Dongguan Ruizhaohe Environmental Protection Equipment Co., Ltd. (DR. AIRE)
-
VT CORP Pvt. Ltd.
-
GEA Group
-
Babcock & Wilcox Enterprises, Inc.
-
FLSmidth & Co. A/S
-
Hamon Group
-
Thermax Limited
Recent Development
In June 2024: Babcock & Wilcox (B&W) revealed that its B&W Environmental business segment had secured over USD 18 million in contracts to design and provide wet and dry electrostatic precipitator (ESP) rebuilds for controlling particulate emissions at utility and industrial facilities in the United States and Europe.
| Report Attributes | Details |
|---|---|
| Market Size in 2023 | USD 7.56 Billion |
| Market Size by 2032 | USD 11.52 Billion |
| CAGR | CAGR of 4.79% From 2024 to 2032 |
| Base Year | 2023 |
| Forecast Period | 2024-2032 |
| Historical Data | 2020-2022 |
| Report Scope & Coverage | Market Size, Segments Analysis, Competitive Landscape, Regional Analysis, DROC & SWOT Analysis, Forecast Outlook |
| Key Segments | • By Type (Dry, Wet) • By Component (Hardware, Software, Services) • By End-User (Power, Metals, Cement, Chemicals, Media) |
| Regional Analysis/Coverage | North America (US, Canada, Mexico), Europe (Eastern Europe [Poland, Romania, Hungary, Turkey, Rest of Eastern Europe] Western Europe] Germany, France, UK, Italy, Spain, Netherlands, Switzerland, Austria, Rest of Western Europe]), Asia Pacific (China, India, Japan, South Korea, Vietnam, Singapore, Australia, Rest of Asia Pacific), Middle East & Africa (Middle East [UAE, Egypt, Saudi Arabia, Qatar, Rest of Middle East], Africa [Nigeria, South Africa, Rest of Africa], Latin America (Brazil, Argentina, Colombia, Rest of Latin America) |
| Company Profiles | Siemens AG, General Electric, Mitsubishi Hitachi Power Systems, Babcock & Wilcox, AMEC Foster Wheeler, Thermax, Ducon Technologies, Fujian Longking, Hamon Group, Trion, FLSmidth, KC Cottrell, Elex AG, Feida Group, McGill AirClean, Scheuch GmbH, Envitech Inc., Bionomic Industries, Southern Environmental, Inc., Hitachi Plant Technologies. |
Get in Touch
