Ethyl Lactate Market Report Scope & Overview:
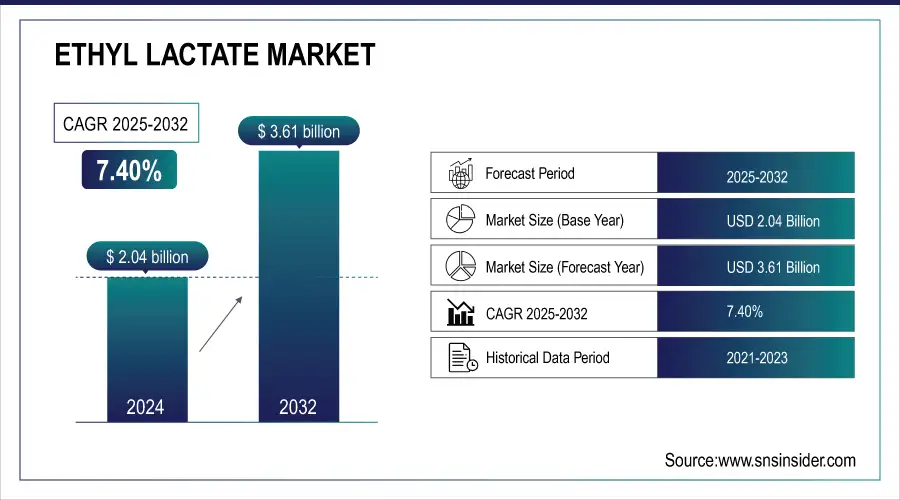
The Ethyl Lactate Market size was USD 2.04 Billion in 2024 and is expected to reach USD 3.61 Billion by 2032 and grow at a CAGR of 7.40% over the forecast period of 2025-2032. The ethyl lactate market is growing due to rising demand for green solvents as industries shift from petrochemical-based alternatives. Derived from renewable resources like corn and sugarcane, it offers biodegradability, low toxicity, and minimal VOC emissions. Widely used in paints, coatings, cleaning, and electronics, it supports environmental goals and complies with strict global regulations, including EPA and EU RoHS standards. Electronics manufacturers increasingly use it for precision cleaning of PCBs and semiconductors. Consumer preference for eco-friendly products further drives adoption. In September 2022, Stepan acquired PerformanX Specialty Chemicals’ surfactant business, strengthening sustainable solutions.
To get more information on Ethyl Lactate Market - Request Free Sample Report
Key Ethyl Lactate Market Trends
-
Rapid expansion of manufacturing facilities across Asia-Pacific is enabling local companies to strengthen supply chains and reduce import dependency.
-
Growing utilization of ethyl lactate as a food-grade solvent in flavor and fragrance industries is expanding non-industrial application opportunities.
-
Increasing vertical integration and partnerships between chemical producers and downstream formulators are fostering value-added product portfolios and stronger market positioning.
-
Rising demand for specialized ethyl lactate grades tailored for high-temperature and waterborne formulations is diversifying product development pipelines.
-
Expanding use of ethyl lactate in pharmaceutical synthesis and processing is driven by its compatibility with solvent-sensitive active ingredients.
-
Continuous innovations in catalytic and enzymatic production technologies are significantly lowering manufacturing costs and improving overall process efficiency.
-
Shift toward lignocellulosic biomass and industrial byproducts as alternative feedstocks is enhancing sustainability and reducing dependence on conventional crops.
-
Surging reliance on contract manufacturing and tolling agreements is ensuring flexible supply solutions for regional markets amid fluctuating demand.
Ethyl Lactate Market Growth Drivers
-
Increasing utilization of ethyl lactate in the pharmaceutical sector drives market growth.
The rising use of ethyl lactate in the pharmaceutical industry is one of the major factors driving market growth as it provides numerous advantages related to drug development and production processes. Due to its biodegradable and non-toxic nature, ethyl lactate is an effective solvent used for the synthesis and design of active pharmaceutical ingredients (APIs). Because of its ability to solubilize hydrophilic and hydrophobic compounds, it is suitable for varied applications, such as drug delivery systems and tablet coating. So, the compound also meets the requirements of strict safety and environmental standards, which mirrors the pharmaceutical industry’s increased commitment to sustainability and regulatory compliance. The need for environmentally friendly solvents such as ethyl lactate is increasing due to the rise in research and development for new pharmaceutical compounds, especially after new drug formulations and biopharmaceuticals. Moreover, an increase in healthcare expenditure coupled with technology advancements in pharmaceutical manufacturing will result in consistent growth in ethyl lactate application in this vital sector.
-
Growing Role of Ethyl Lactate in Eco-Friendly Paints, Coatings, and Printing Inks Applications
The paints, coatings, and printing inks industries are actively shifting toward eco-friendly solvents that reduce volatile organic compound (VOC) emissions. Ethyl lactate’s excellent solvency, low toxicity, and biodegradability make it an ideal choice for replacing petroleum-derived solvents in these applications. Its compatibility with various resins and pigments enhances performance while enabling compliance with stringent global environmental regulations. As sustainable construction and packaging industries expand, demand for low-VOC coatings and inks continues to rise. This transition significantly drives the ethyl lactate market by creating strong industrial demand across commercial printing, packaging, and architectural coatings applications worldwide.
Ethyl Lactate Market Restraints
-
High production costs of ethyl lactate may hamper the market growth.
The high cost of production of ethyl lactate has been a major hurdle for the growth of the market owing to it being more expensive than conventional petrochemical-based solvents. Ethyl lactate, on the other hand, comes from renewable resources–namely, corn or sugarcane which demand complex fermentation, distillation, and high energy consumption. Counterintuitively, these processes are environmentally friendly but entail higher production and input raw material costs. Moreover, advanced production technology required for high purity and consistent quality also makes it costly. Consequently, sectors that use large volumes of solvents, such as paints, coatings, and industrial cleaning, may find it cost-prohibitive to transition to ethyl lactate unless its market price competitiveness increases. Such difference in the prices limits its adaptation, especially in price-sensitive markets, and in territories where price control is a major and crucial factor for businesses. Despite its potential to help meet the growing demand for sustainable products, the higher production cost of ethyl lactate may prevent its widespread adoption, unless technological advances and/or economies of scale bring down the cost of production.
Ethyl Lactate Market Opportunities:
-
Expanding Applications of Ethyl Lactate in Advanced Electronics Manufacturing Processes
The growing electronics industry, particularly in the Asia-Pacific region, presents significant opportunities for ethyl lactate adoption in advanced cleaning and degreasing processes. It is highly effective in removing organic residues from sensitive components like printed circuit boards (PCBs) and semiconductor devices without damaging delicate materials. As miniaturization and high-performance device production advance, electronics manufacturers are adopting greener solvents to meet regulatory restrictions on hazardous substances. Ethyl lactate’s biodegradability, low toxicity, and high performance make it a sustainable alternative, positioning it as a solvent of choice in precision electronics manufacturing, thereby opening lucrative opportunities for producers in the coming years.
-
Rising Demand for Bio-Based Solvents in Emerging Industrial Bioprocessing Applications
The global shift toward bio-based chemical production is opening new opportunities for ethyl lactate in industrial bioprocessing. As industries such as biofuels, biopolymers, and specialty chemicals scale up production, demand for solvents compatible with enzymatic and microbial processes is rising. Ethyl lactate, derived from renewable resources, aligns perfectly with these sustainability-driven sectors. Its low environmental footprint, biodegradability, and compatibility with biological systems make it ideal for fermentation-based processes. With governments promoting circular economy practices and industries seeking eco-friendly processing aids, ethyl lactate is expected to gain traction as a key bio-based solvent in next-generation industrial applications.
Ethyl Lactate Market Segments Highlights
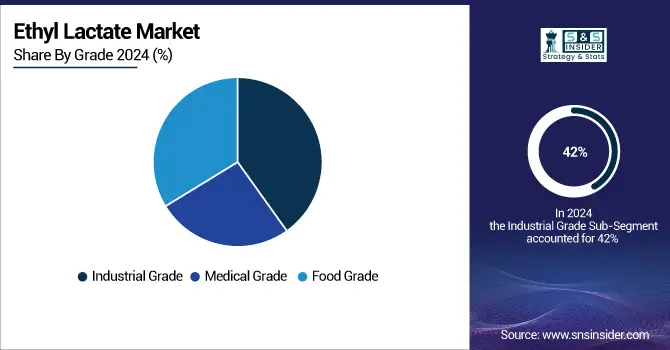
By Type, Industrial Grade held the largest market share around 42% in 2023.
It is owing to its effective versatile usage at efficient costs in varied industries. Due to its best combination of properties and environmental safety, it is extensively utilized in paint and coating, industrial cleaning, adhesives, lubricants, etc. Industrial grade ethyl lactate is pure enough for such applications and dissolves and cleans effectively without the adverse effects of conventional solvents. Since it is biodegradable and non-toxic, many companies still prefer it to meet even the stringent environmental regulations and sustainability goals. Additionally, the rising requirement for sustainable options in industrial processes is propelling manufacturers to utilize ethyl lactate as an environmentally friendly and eco-safe alternative. With sectors like automotive, manufacturing, and construction still showing trust in cleaner and better ways of producing, the demand for industrial-grade ethyl lactate is likely to remain steady, continuing to take up the lion's share of the global market.
By End-Use Industry, The pharmaceutical and healthcare sector segment held the largest market share around 38% in 2023.
It is because of the rising demand for sustainable and non-toxic solvents in drug formulation & manufacturing, and medical applications. Ethyl lactate is an environmentally friendly solvent widely used in the pharmaceutical industry because of its biodegradability, low toxicity, and ability to dissolve both hydrophilic and hydrophobic materials, which make it suitable in active pharmaceutical ingredient (API) formulation, drug delivery systems, and tablet coatings. The pharma industry is highly contaminated by the strict enforcement of environmental regulations and the provision of safety norms which makes eco-friendly solvents such as ethyl lactate a preferred solution. Maintaining the growing focus on the development of biopharmaceuticals and personalized medicines, it is important to develop sustainable solvents that will enable novel manufacturing processes.
By Application, Solvent held the largest market share around 39% in 2023.
This is owing to their wide, and essential application in various industries primarily in use as a solvent in coatings, adhesives, cleaners, and pharmaceuticals. The solvent power of ethyl lactate is an excellently efficient solubilizer with a high degree of solubilization with many different solutes, giving it a high versatility for many different processes. Its biodegradability and non-toxic properties make it an attractive alternative to conventional petrochemical-based solvents and the demand for these sustainable alternatives is steadily increasing nowadays. Where high-volume solvent usage is necessary (e.g., in the paints and coatings, adhesives, and industrial cleaning industries), ethyl lactate delivers an attractive combination of performance and regulatory compliance as an optimal solvent solution. In addition, regulatory pressure to limit high harmful emissions and use of volatile organic compounds (VOCs) has made this transition to greener solvents such as ethyl lactate happen even faster.
Ethyl Lactate Market Regional Analysis
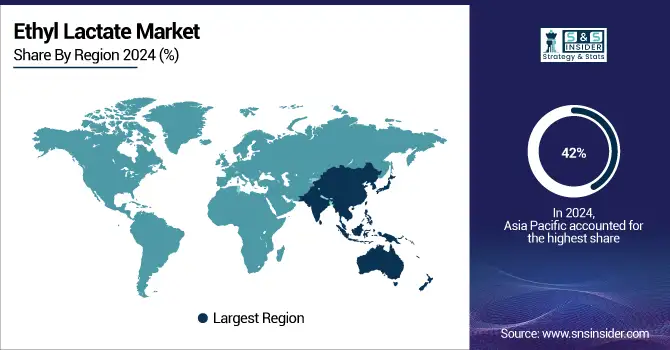
Asia Pacific Ethyl Lactate Market Insights
Asia Pacific accounted for over 42% of the ethyl lactate market in 2023, driven by rapid industrialization, robust manufacturing, and rising demand for eco-friendly products. Countries like China, India, Japan, and South Korea fuel growth through strong chemical, pharmaceutical, and automotive industries. Stringent regulations and sustainability targets further boost green solvent adoption. Expanding consumer goods sectors, including paints, coatings, adhesives, and pharmaceuticals, support demand. Additionally, government initiatives promoting green technologies, a growing middle class, and improving healthcare infrastructure strengthen ethyl lactate applications, ensuring Asia Pacific’s continued market leadership.
Get Customized Report as per your Business Requirement - Request For Customized Report
North America Ethyl Lactate Market Insights
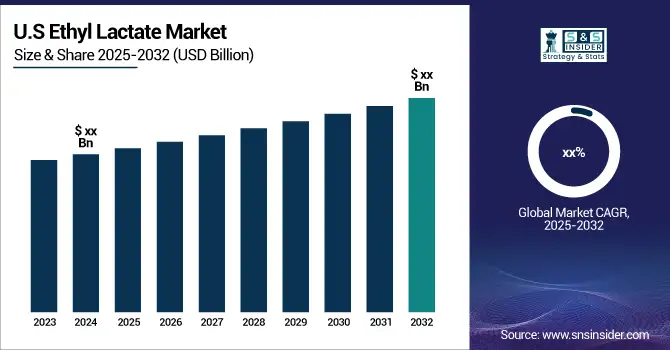
North America held around 28% of the ethyl lactate market in 2023, driven by advanced chemical, pharmaceutical, and food processing industries. The U.S. leads with strong demand from bio-based solvents in paints, coatings, and cleaning agents. Strict EPA environmental regulations and a growing shift toward green chemistry support adoption. Rising R&D investments in sustainable chemicals and demand for eco-friendly packaging strengthen market growth. Canada’s pharmaceutical and healthcare industries, coupled with Mexico’s expanding automotive and manufacturing base, further contribute. Growing consumer awareness of green products and corporate sustainability commitments ensure North America remains a key ethyl lactate market.
Europe Ethyl Lactate Market Insights
Europe captured 20% of the ethyl lactate market in 2023, supported by the EU’s strong sustainability policies and commitment to circular economy practices. Countries like Germany, France, and the UK drive demand through thriving paints, coatings, and adhesives sectors. Pharmaceutical and food-grade solvent applications are expanding with rising clean-label and organic product trends. Stringent REACH regulations encourage industries to replace toxic solvents with bio-based alternatives like ethyl lactate. Automotive coatings and packaging innovations boost usage, while rising consumer preference for eco-friendly products accelerates adoption. Strong government support for renewable chemicals ensures Europe’s steady growth in the ethyl lactate market.
Latin America Ethyl Lactate Market Insights
Latin America accounted for nearly 6% of the ethyl lactate market in 2023, led by Brazil and Mexico’s expanding chemical and automotive industries. Growing adoption of bio-based solvents in paints, coatings, and adhesives is fueled by industrialization and urban development. Rising demand for sustainable packaging and consumer goods strengthens ethyl lactate use across food and beverage sectors. Government efforts to encourage renewable resources and eco-friendly technologies support adoption. The pharmaceutical industry in Brazil and Mexico further contributes to demand, while regional investments in green industrial practices promote growth. Latin America’s market is set to expand steadily in coming years.
Middle East & Africa (MEA) Ethyl Lactate Market Insights
The Middle East & Africa represented 4% of the ethyl lactate market in 2023, with growth concentrated in South Africa, UAE, and Saudi Arabia. Rising industrial diversification, infrastructure development, and focus on sustainable technologies drive adoption. The food and beverage sector is a key consumer, while expanding healthcare and pharmaceutical industries increase solvent demand. Government sustainability programs and foreign investments in renewable chemicals strengthen market penetration. Paints, coatings, and adhesives demand is rising with ongoing construction and automotive projects. Although MEA holds a smaller share, its focus on green industrialization positions the region for moderate yet consistent growth.
Competitive Landscape for Ethyl Lactate Market:
Corbion N.V., founded in 1919 and headquartered in Amsterdam, Netherlands, Corbion N.V. focuses on sustainable ingredient solutions via its business segments: Food, Biochemicals, and Innovation Platforms. It offers PURASOLV lactate-ester solvents, including high-purity ethyl lactate, for industries like microelectronics, coatings, and personal care. These biobased solvents are derived from lactic acid and ethanol, designed for low toxicity, biodegradability, and stringent quality standards, positioning Corbion as a leader in green-solvent applications
-
In December 2023, Corbion opened a circular lactic-acid plant in Thailand, marking the start of commissioning critical systems and signaling a strategic shift toward circular-economy biobased production.
Godavari Biorefineries Ltd. was founded in 1956 and is headquartered in Mumbai, India. Godavari Biorefineries Ltd. operates under the Somaiya Group across Sugar, Power, Chemicals, and Ethanol segments. As one of India's largest producers of renewable chemicals, it manufactures high-quality ethyl lactate from sugarcane and ethanol. Its ethyl lactate serves as a biodegradable, non-toxic solvent across electronics, coatings, adhesives, inks, and cleaning applications, offering a green alternative to traditional volatile organic solvents.
-
In December 2024, Godavari secured an exclusive licensing deal with Catalyxx Inc. to manufacture biobutanol and higher alcohols in India, highlighting its push into advanced bio-chemical production.
Vertec Biosolvents Inc. was founded in the late 1990s out of a cooperative research agreement (CRADA) with Argonne National Laboratories. Vertec Biosolvents Inc. is headquartered in Illinois, USA. It specializes in developing high-performance, eco-friendly solvent blends primarily ethyl lactate, d-limonene, fatty acid methyl esters, and ethanol derived from renewable feedstocks such as corn, soybeans, citrus, and other bio-resources. The company positions these biodegradable, non-hazardous solvents as green alternatives to petroleum-based solvents across industries like coatings, cleaning, inks, adhesives, and agrochemicals.
-
In August 2024, Vertec Biosolvents entered into a collaboration agreement with Circa Group AS to promote Cyrene™, a sustainable biomass-derived industrial solvent, across the Americas via Vertec’s solvent blend expertise.
Ethyl Lactate Market Companies are:
-
Corbion N.V. (PURASOLV EL, PURASOLV ELi)
-
Musashino Chemical Laboratory (MUSASHINO EL, MUSASHINO EX)
-
Godavari Biorefineries Ltd. (GODAVARI EL, ECOBIO EL)
-
Merck KGaA (Sigma-Aldrich Ethyl Lactate, Supelco Ethyl Lactate)
-
Vertec Biosolvents Inc. (VertecGold EL, VertecClean EL)
-
Fujifilm Wako Chemicals (Wako EL, High Purity EL)
-
Cargill Inc. (Cargill EL99, BiOH EL)
-
Yancheng Hongtai Bioengineering Co., Ltd. (HT EL, Biotech EL)
-
Jungbunzlauer Suisse AG (Jungbunzlauer EL, Lactylate EL)
-
Henan Jindan Lactic Acid Technology Co., Ltd. (Jindan EL, JindanTech EL)
-
Kemin Industries (Kemin EL, Natural EL)
-
Shandong Enno New Material Co., Ltd. (Enno EL, Ultra EL)
-
Shanghai Ruizheng Chemical Technology Co., Ltd. (Ruizheng EL, RZ EL)
-
Häffner GmbH & Co. KG (Häffner Pure EL, Häffner Green EL)
-
Chengdu Weir Bio-Engineering Co., Ltd. (WeirBio EL, Eco EL)
-
ADM (ADM Ethyl Lactate, ADM EL99)
-
Penta Manufacturing Company (Penta EL, Specialty EL)
-
Green Biologics Ltd. (GreenBio EL, Advanced EL)
-
Zhejiang Yibaikang Biological Technology Co., Ltd. (Yibaikang EL, YBK Pure EL)
-
Shenzhen Esun Industrial Co., Ltd. (Esun EL, Bio EL)
| Report Attributes | Details |
|---|---|
| Market Size in 2024 | USD 2.04 Billion |
| Market Size by 2032 | USD 3.61 Billion |
| CAGR | CAGR of 7.40% From 2025 to 2032 |
| Base Year | 2024 |
| Forecast Period | 2025-2032 |
| Historical Data | 2021-2023 |
| Report Scope & Coverage | Market Size, Segments Analysis, Competitive Landscape, Regional Analysis, DROC & SWOT Analysis, Forecast Outlook |
| Key Segments | • By Grade (Food Grade, Medical Grade, Industrial Grade) • By End-use Industry (Paints and Coatings, Food and Beverage, Pharmaceutical and Healthcare, Electronics, Personal Care and Cosmetics, and Others) • By Application (Additive,APIs & Drug Carrier,Solvents, Fragrances,) |
| Regional Analysis/Coverage | North America (US, Canada, Mexico), Europe (Eastern Europe [Poland, Romania, Hungary, Turkey, Rest of Eastern Europe] Western Europe] Germany, France, UK, Italy, Spain, Netherlands, Switzerland, Austria, Rest of Western Europe]), Asia Pacific (China, India, Japan, South Korea, Vietnam, Singapore, Australia, Rest of Asia Pacific), Middle East & Africa (Middle East [UAE, Egypt, Saudi Arabia, Qatar, Rest of Middle East], Africa [Nigeria, South Africa, Rest of Africa], Latin America (Brazil, Argentina, Colombia, Rest of Latin America) |
| Company Profiles | Corbion N.V., Musashino Chemical Laboratory, Godavari Biorefineries Ltd., Merck KGaA, Vertec Biosolvents Inc., and others |
Frequently Asked Questions
Increasing utilization of ethyl lactate in the pharmaceutical sector drives ethyl lactate market growth.
Asia-Pacific region dominated the Ethyl Lactate Market.
The major key players in the ethyl lactate market are Corbion N.V., Musashino Chemical Laboratory, Godavari Biorefineries Ltd., Merck KGaA, Vertec Biosolvents Inc.
The Ethyl Lactate Market was valued at USD 2.04 Billion in 2024.
The expected CAGR of the global Ethyl Lactate Market during the forecast period is 7.4%.
Get in Touch
