Active Pharmaceutical Ingredient Market Report Scope & Overview:
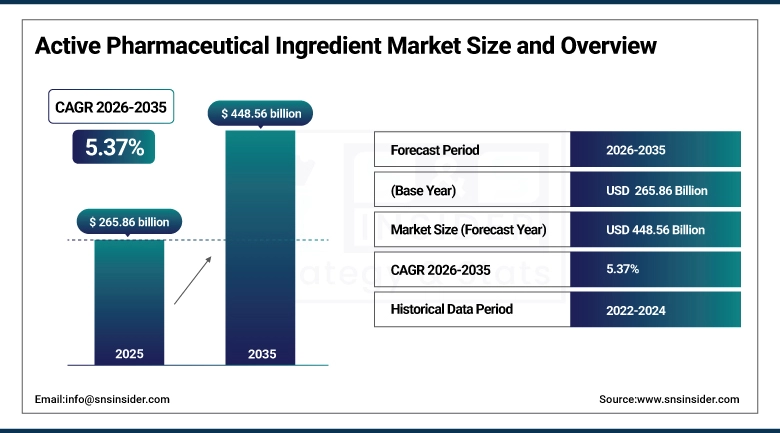
The Active Pharmaceutical Ingredient Market size was valued at USD 265.86 billion in 2025 and is expected to reach USD 448.56 billion by 2035, growing at a CAGR of 5.37% over the forecast period of 2026-2035.
The Active Pharmaceutical Ingredient Market trend is characterized by increasing demand for generic medications, biologics development, contract manufacturing services, and advanced synthesis technologies as the growth of the market is driven by rising chronic disease prevalence, aging population demographics, pharmaceutical outsourcing activities, and regulatory harmonization initiatives. This trend is also driven by growing adoption of precision medicine approaches and the expanding focus on biosimilar production as pharmaceutical companies become more focused on reducing manufacturing costs and are increasingly willing to invest in API production capabilities, resulting in growth in both synthetic and biotech API manufacturing solutions across domestic and international markets.
For instance, in January 2024, global pharmaceutical manufacturing expansion drove a 18% increase in API production capacity for cardiovascular and oncology therapeutic areas, boosting contract development and manufacturing organization (CDMO) partnerships and specialty API market growth.
Active Pharmaceutical Ingredient Market Size and Forecast:
-
Market Size in 2025: USD 265.86 Billion
-
Market Size by 2035: USD 448.56 Billion
-
CAGR: 5.37% from 2026 to 2035
-
Base Year: 2025
-
Forecast Period: 2026–2035
-
Historical Data: 2022–2024
To Get more information on Active Pharmaceutical Ingredient Market - Request Free Sample Report
Active Pharmaceutical Ingredient Market Trends
-
Active pharmaceutical ingredient manufacturing solutions are being adopted because pharmaceutical companies demand cost-effective production, quality assurance compliance, and scalable manufacturing capabilities for drug development.
-
Customized API synthesis technologies based on therapeutic categories, molecular complexity, and manufacturing process requirements to improve pharmaceutical production efficiency.
-
The development of continuous manufacturing processes, green chemistry initiatives, and advanced purification technologies to improve production sustainability and reduce environmental impact.
-
Integrated contract manufacturing services, regulatory compliance support, and supply chain optimization solutions available to ensure consistent API quality and delivery reliability.
-
Increased demand for biotech API production capabilities, recombinant protein manufacturing, and monoclonal antibody synthesis to support biologics market expansion.
-
Collaboration between pharmaceutical innovators, generic manufacturers, and CDMO providers to develop specialized API manufacturing systems and improve industry standards.
-
FDA, EMA, and ICH promoting standards for manufacturing quality, good manufacturing practices (GMP), process validation requirements, and pharmaceutical supply chain security.
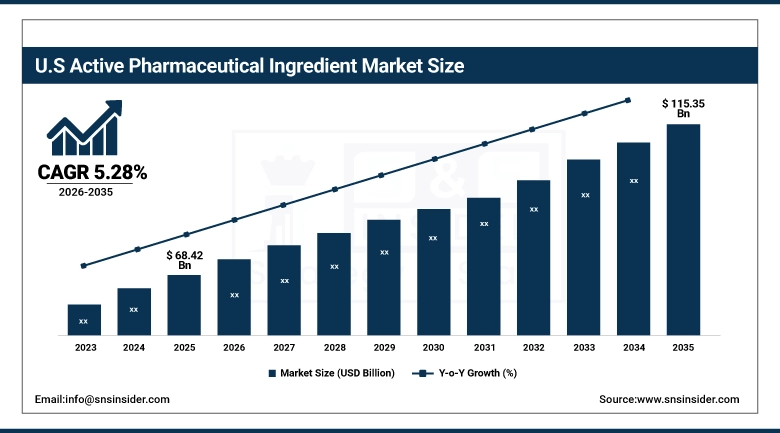
The U.S. Active Pharmaceutical Ingredient Market is estimated at USD 68.42 billion in 2025 and is expected to reach USD 115.35 billion by 2035, growing at a CAGR of 5.28% from 2026-2035. The United States is a significant market for active pharmaceutical ingredients. The market is driven mainly by strong pharmaceutical R&D activities, high compliance with pharmaceutical regulations, and well-established biopharmaceutical manufacturing infrastructure. Government initiatives in domestic active pharmaceutical ingredient manufacturing, high healthcare spending, and increasing R&D in specialty pharmaceuticals also contribute to the growth of the active pharmaceutical ingredient market in the United States. Furthermore, the United States is at the forefront in innovative active pharmaceutical ingredient manufacturing technologies, including contract pharmaceutical manufacturing services, in biopharmaceuticals.
Active Pharmaceutical Ingredient Market Growth Drivers:
-
Rising Chronic Disease Prevalence and Generic Drug Adoption is Driving the Active Pharmaceutical Ingredient Market Growth
Rising chronic disease prevalence and generic drug adoption serve as primary growth drivers for the active pharmaceutical ingredient market share, driven by increasing cardiovascular disorders, cancer incidence rates, diabetes cases, and neurological conditions requiring continuous medication therapy. These factors combined with patent expirations for blockbuster drugs and healthcare cost containment initiatives are driving demand for affordable generic API manufacturing, expanding both synthetic and biotech API market penetration, and contributing to overall pharmaceutical industry growth globally.
For instance, in March 2024, generic pharmaceutical production and biosimilar development accounted for approximately 72% of total API manufacturing volume, reflecting growing market preference for cost-effective medications and expanding global market share.
Active Pharmaceutical Ingredient Market Restraints:
-
Stringent Regulatory Requirements and Manufacturing Complexity are Hampering the Active Pharmaceutical Ingredient Market Growth
The stringent regulatory requirements and manufacturing complexity challenges hinder the growth of the active pharmaceutical ingredient market. Pharmaceutical companies have to deal with documentation requirements, compliance standards, lengthy approval procedures, and capital investment requirements for upgrading facilities. This makes the operational costs high, which hampers the entry of new players into the market. The complexity also makes it difficult for small-scale manufacturers to be flexible in production. This creates hurdles in the growth of the active pharmaceutical ingredient market.
Active Pharmaceutical Ingredient Market Opportunities:
-
Biologics Manufacturing and Biosimilar Development Drive Future Growth Opportunities for the Active Pharmaceutical Ingredient Market
The opportunity in the active pharmaceutical ingredient industry, specifically within the realm of biologics manufacturing and biosimilars, can be seen as a result of cell culture technologies, recombinant DNA manufacturing, and protein purification. Such technologies can be used for the manufacturing of monoclonal antibodies, enzymes, vaccines, and hormone-based therapies for the treatment of complex diseases. As a result of the improvement in biotech active pharmaceutical ingredients, specialized manufacturing, and the availability of cost-effective biosimilars, especially for oncology and autoimmune diseases, there are significant opportunities for growth.
For instance, in May 2024, the global pharmaceutical industry reported that biotech API production capacity increased by 24%, with monoclonal antibody and recombinant protein manufacturing driving significant expansion in contract development and biologics manufacturing services.
Active Pharmaceutical Ingredient Market Segment Analysis
-
By synthesis, synthetic APIs accounted for the largest share of 62.18% in 2025, and the biotech APIs segment is anticipated to exhibit the fastest growth, at a CAGR of 6.94%.
-
By drug type, the prescription segment has registered the highest market share of about 78.52% in 2025, followed by the OTC segment, which is anticipated to register a CAGR of 4.85%.
-
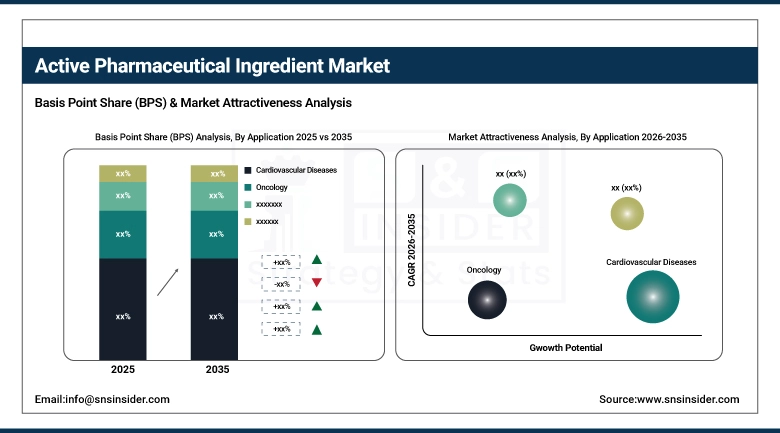
By application, cardiovascular diseases had the highest market share of about 24.67% in 2025, and the oncology segment is projected to grow at the highest rate, with a CAGR of 6.73%.
By Synthesis, Synthetic APIs Lead the Market, While Biotech APIs Register Fastest Growth
The synthetic APIs segment accounted for the highest revenue share of approximately 62.18% in 2025, owing to established chemical synthesis methodologies, cost-effective large-scale production capabilities, extensive generic drug manufacturing requirements, and widespread application across multiple therapeutic categories. Emerging trends include increasing implementation of continuous flow chemistry, green synthesis approaches, and process analytical technology for quality control. In comparison, the biotech APIs segment is anticipated to achieve the highest CAGR of nearly 6.94% during the 2026–2035 period, driven by growing demand for biologics and biosimilars, advanced recombinant protein production technologies, and increasing prevalence of chronic diseases requiring biologic therapies. Drivers include rising monoclonal antibody development, vaccine manufacturing expansion, and the preference for targeted therapeutic approaches in oncology and autoimmune conditions.
By Drug Type, the Prescription Drug Segment Dominates and Shows Rapid Growth
By 2025, the prescription drug segment contributed the largest revenue share of 78.52% due to extensive chronic disease management requirements, complex therapeutic needs, regulatory approval processes, and higher API quality standards for specialized medications. Growing adoption of innovative pharmaceutical formulations, personalized medicine approaches, and specialty drug development are driving segment expansion. From 2026 to 2035, the OTC segment is anticipated to witness a CAGR of 4.85%, specifically attributed to rising consumer preference for self-medication, increasing health awareness, and regulatory approvals for prescription-to-OTC switches. This growth is primarily driven by expanding accessibility of common medications for pain management, cold and flu treatments, and digestive health without requiring medical prescriptions.
By Application, Cardiovascular Diseases Lead, While Oncology Registers Fastest Growth
The cardiovascular diseases application accounted for the largest share of the active pharmaceutical ingredient market with about 24.67%, owing to high global prevalence of hypertension, coronary artery disease, heart failure conditions, and stroke prevention requirements demanding consistent API supply. Reasons driving the cardiovascular segment include aging population demographics, lifestyle-related risk factors, and established treatment protocols requiring multiple drug combinations. Additionally, the oncology segment is slated to grow at the fastest rate with a CAGR of around 6.73% throughout the forecast period of 2026–2035, as cancer incidence rates increase globally, targeted therapy development accelerates, and immunotherapy adoption expands across multiple cancer types. Increased focus on precision oncology medications, antibody-drug conjugates, and CAR-T cell therapy manufacturing contribute to segment adoption, while improved survival rates and combination therapy approaches drive continued API investment in cancer treatment applications.
Active Pharmaceutical Ingredient Market Regional Highlights:
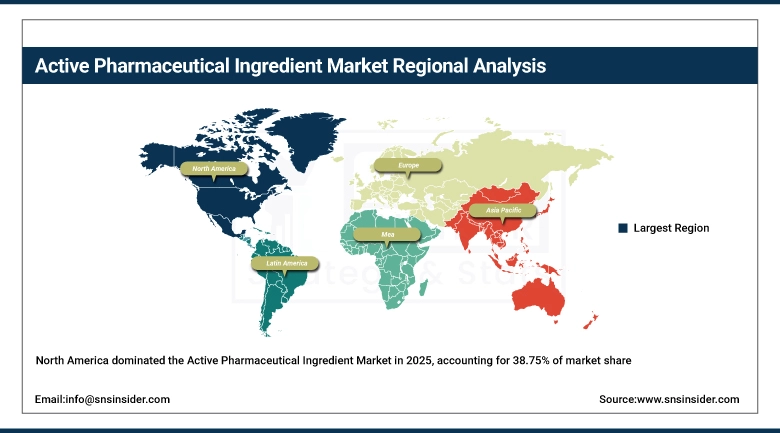
North America Active Pharmaceutical Ingredient Market Insights:
North America dominated the market in terms of revenue, with a significant revenue share of over 38.75% in 2025. This is due to the presence of an advanced pharmaceutical research infrastructure, stringent quality assurance norms, and significant presence of the biopharma industry. Factors driving the market include the widespread adoption of innovative drug development programs, stringent intellectual property protection regulations, advanced technology in implementing pharmaceutical manufacturing, and growing initiatives in pharmaceutical production within North America to address security concerns in the pharmaceutical supply chain. At the same time, incentives for pharmaceutical production reshoring in North America, significant funding for pharmaceutical and healthcare-related research, and significant investments in the production of specialty APIs from innovator companies and contract manufacturers are establishing active pharmaceutical ingredients in North America.
Get Customized Report as per Your Business Requirement - Enquiry Now
Asia Pacific Active Pharmaceutical Ingredient Market Insights:
Asia Pacific is the fastest-growing segment in the active pharmaceutical ingredient market with a CAGR of 6.12%, as awareness about cost-effective API manufacturing, government pharmaceutical industry incentives, and production infrastructure modernization in emerging economies continues growing. Factors including competitive manufacturing costs, skilled technical workforce availability, increasing pharmaceutical exports, and favorable regulatory environments are stimulating market growth. Contract manufacturing partnerships, technology transfer initiatives, and quality certification achievements have been instrumental in improving global competitiveness, especially among Indian and Chinese API manufacturers serving international markets. Public-private collaborations and strategic investments also help advance manufacturing capabilities and pharmaceutical sector development. Increased demand in Asia Pacific region owing to rising domestic pharmaceutical consumption, expanding middle-class populations with healthcare access, and growing affordability of both generic and innovative API production technologies.
Europe Active Pharmaceutical Ingredient Market Insights:
The active pharmaceutical ingredient market in Europe is the second-dominating region after North America on account of increasing generic drug production, robust pharmaceutical manufacturing heritage, comprehensive regulatory harmonization through EMA guidelines, and growing emphasis on sustainable manufacturing practices. Rising implementation of good manufacturing practice standards, advanced process automation technologies, substantial government funding for pharmaceutical innovation projects, and strategic supply chain diversification initiatives are contributing to sustained market growth across leading European pharmaceutical manufacturing hubs.
Latin America (LATAM) and Middle East & Africa (MEA) Active Pharmaceutical Ingredient Market Insights:
In Latin America and Middle East & Africa, the growing pharmaceutical industry development efforts and increases in healthcare infrastructure investments with regulatory framework improvements support the active pharmaceutical ingredient market growth. The rising adoption of technology transfer agreements, local manufacturing capacity development, and international quality certification achievements, along with government pharmaceutical sector incentives, will aid healthcare accessibility and pharmaceutical self-sufficiency. The expanding patient populations requiring chronic disease medications and improving pharmaceutical distribution networks in these regions are continuing to encourage market growth.
Active Pharmaceutical Ingredient Market Competitive Landscape:
Pfizer Inc. (est. 1849) is a leading global pharmaceutical manufacturer that focuses on innovative medicines and biosimilars across multiple therapeutic areas. It leverages its extensive API manufacturing capabilities and vertically integrated production infrastructure to produce cutting-edge pharmaceutical compounds with comprehensive quality assurance and regulatory compliance.
-
In January 2024, expanded its biologics API production capacity with new monoclonal antibody manufacturing facilities in Europe and Asia, aiming to improve biosimilar development capabilities and strengthen global pharmaceutical supply chain resilience.
Novartis AG (est. 1996) is a multinational pharmaceutical company specializing in innovative medicines, generic pharmaceuticals through Sandoz division, and advanced therapy manufacturing. It invests in specialized API synthesis technologies and continuous manufacturing processes with the goal of revolutionizing pharmaceutical production through sustainable chemistry and advanced process analytics.
-
In April 2024, launched enhanced continuous flow manufacturing technology for oncology APIs featuring real-time quality monitoring and reduced environmental impact across its global production network, improving production efficiency and sustainability standards.
Teva Pharmaceutical Industries Ltd. (est. 1901) is the world's largest generic pharmaceutical company specializing in affordable medicines and API manufacturing for global markets. The company's API production portfolio focuses on diverse therapeutic categories and manufacturing process optimization, featuring strong commitment to quality standards and continuous supply chain reliability to complement market leadership in generic pharmaceutical manufacturing.
-
In July 2024, announced strategic expansion of cardiovascular and CNS API manufacturing capacity in India and Europe, strengthening generic drug production capabilities and expanding market presence among contract manufacturing organizations serving global pharmaceutical markets.
Active Pharmaceutical Ingredient Market Key Players:
-
Pfizer Inc.
-
Novartis AG
-
Teva Pharmaceutical Industries Ltd.
-
Sun Pharmaceutical Industries Ltd.
-
Reddy's Laboratories Ltd.
-
Aurobindo Pharma Ltd.
-
Cipla Ltd.
-
Lupin Limited
-
Mylan N.V. (Viatris Inc.)
-
BASF SE
-
Lonza Group AG
-
Boehringer Ingelheim International GmbH
-
AbbVie Inc.
-
Merck KGaA
-
DSM-Firmenich (Royal DSM)
-
Siegfried Holding AG
-
Cambrex Corporation
-
Carbogen Amcis AG
-
Dishman Carbogen Amcis Ltd.
-
Zhejiang Medicine Co., Ltd.
-
North China Pharmaceutical Group Corporation
-
Shandong Xinhua Pharmaceutical Company Limited
-
Piramal Pharma Solutions
-
Laurus Labs Limited
-
Aarti Drugs Limited
| Report Attributes | Details |
|---|---|
| Market Size in 2025 | USD 265.86 Billion |
| Market Size by 2035 | USD 448.56 Billion |
| CAGR | CAGR of 5.37% From 2026 to 2035 |
| Base Year | 2025 |
| Forecast Period | 2026-2035 |
| Historical Data | 2022-2024 |
| Report Scope & Coverage | Market Size, Segments Analysis, Competitive Landscape, Regional Analysis, DROC & SWOT Analysis, Forecast Outlook |
| Key Segments | • By Synthesis [Biotech APIs (By Type {Generic APIs, Innovative APIs}, By Product {Monoclonal Antibodies, Hormones, Cytokines, Recombinant Proteins, Therapeutic Enzymes, Vaccines, Blood Factors}, Synthetic APIs (By Type {Generic APIs, Innovative APIs})] • By Drug Type [Prescription, OTC] • By Application [Cardiovascular Diseases, Oncology, CNS and Neurology, Orthopedic, Endocrinology, Pulmonology, Gastroenterology, Nephrology, Ophthalmology, Others] |
| Regional Analysis/Coverage | North America (US, Canada, Mexico), Europe (Eastern Europe [Poland, Romania, Hungary, Turkey, Rest of Eastern Europe] Western Europe] Germany, France, UK, Italy, Spain, Netherlands, Switzerland, Austria, Rest of Western Europe]), Asia Pacific (China, India, Japan, South Korea, Vietnam, Singapore, Australia, Rest of Asia Pacific), Middle East & Africa (Middle East [UAE, Egypt, Saudi Arabia, Qatar, Rest of Middle East], Africa [Nigeria, South Africa, Rest of Africa], Latin America (Brazil, Argentina, Colombia, Rest of Latin America) |
| Company Profiles | Pfizer Inc., Novartis AG, Teva Pharmaceutical Industries Ltd., Sun Pharmaceutical Industries Ltd., Dr. Reddy's Laboratories Ltd., Aurobindo Pharma Ltd., Cipla Ltd., Lupin Limited Mylan N.V. (Viatris Inc.), BASF SE, Lonza Group AG, Boehringer Ingelheim International GmbH, AbbVie Inc., Merck KGaA, DSM-Firmenich (Royal DSM), Siegfried Holding AG, Cambrex Corporation, Carbogen Amcis AG, Dishman Carbogen Amcis Ltd., Zhejiang Medicine Co., Ltd., North China Pharmaceutical Group Corporation, Shandong Xinhua Pharmaceutical Company Limited, Piramal Pharma Solutions, Laurus Labs Limited, Aarti Drugs Limited |
Get in Touch
