Everything As A Service Market Report Scope & Overview:
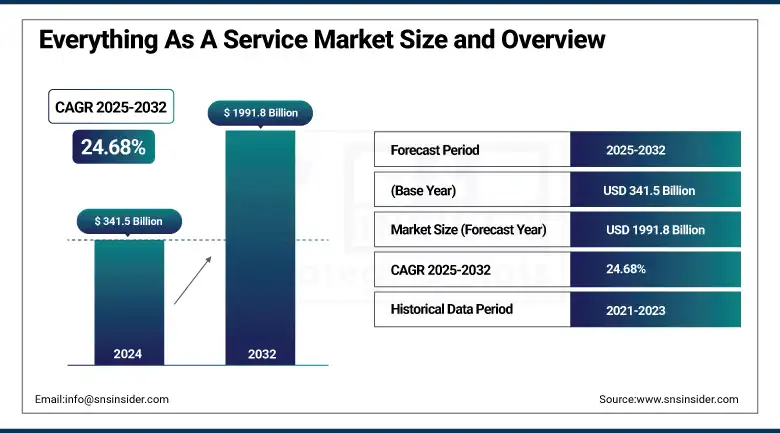
The Everything As A Service (XaaS) Market size was valued at USD 341.5 billion in 2024 and is expected to reach USD 1991.8 billion by 2032, growing at a CAGR of 24.68% during 2025-2032.
The everything as a service (XaaS) market is driven by the need for scalable, cost-effective, and cloud-based solutions within many different industries. To meet the demands for increased agility, reduced capital expenditure, and streamlined operations, organizations are quickly migrating from traditional IT infrastructure to the service model: the service model includes SaaS, IaaS, and PaaS. This trend is further propelled by the growing adoption of AI, edge computing, and hybrid cloud models.
To Get more information On Everything As A Service Market - Request Free Sample Report
Digital transformation is being embraced by businesses big and small and propelling the growth of XaaS across the globe, as per the recent everything as a service market analysis. In addition, market traction has also been accelerated by the increasing demand for accessibility and data-driven services. Everything as a Service Market Key Trends include the BFSI, Insurance, Government, and Healthcare. OMS has projected a substantial compound annual growth over 2025-2032 due to ongoing enterprise cloud investments across the board and constant innovations.
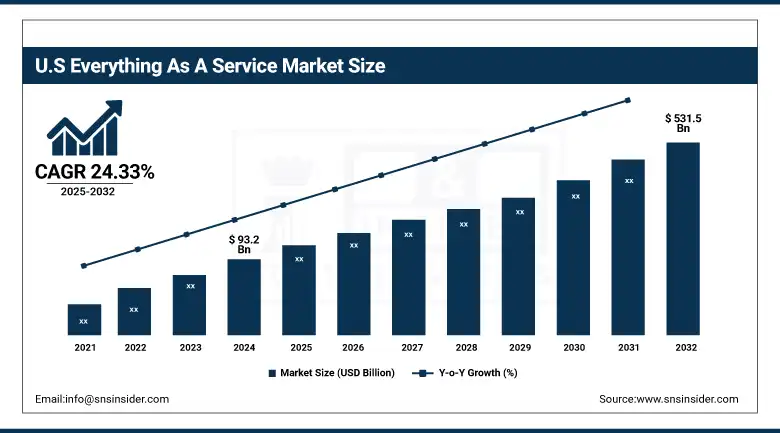
The U.S. XaaS Market Size was valued at USD 93.2 billion in 2024 and expected to grow at a CAGR of 24.33% reaching USD 531.5 billion by 2032. This is mainly owing to the rapid cloud adoption, surge in demand for scalable IT infrastructure, and continuous enterprise digital transformation. The market will be propelled by increasing adoption of AI, subscription-based model and growing adoption of SMEs.
Market Dynamics:
Drivers:
-
Rising Demand for Scalable and Cost-Efficient IT Models is Driving Mass Enterprise Shift to XaaS Platforms
Various organizations are adopting the XaaS models to lower capital expense (CapEx) and increase operational efficiency. Enterprise continues to move to subscription-based service, avoiding upfront infrastructure investment and getting access to the latest technologies. It provides the ability for businesses to scale services up or down as needed in real-time. This also works in favour of fast-moving market conditions, especially in the case of startups and SMEs in the form of a pay-as-you-go model. Also, XaaS facilitates faster deployments, smooth upgrades, and established management, making it a top-tier option amongst the faster-paced digital realities. Such benefits of cost-efficiency and agility serve as the primary growth drivers for the market.
For instance, in 2024, more than 62% of Fortune 500 companies had shifted at least half of their IT operations to XaaS environments, marking a significant transition toward service-based models.
Restraints:
-
Heightened Data Privacy and Compliance Risks are Slowing Adoption in Highly Regulated Industries
While the advantages provided by XaaS are indisputable, adoption of these models comes with challenges regarding data security, privacy, and compliance, particularly within regulated industries such as healthcare and finance. But as data has migrated to third-party cloud environments, the risk of a data breach and the risk of unauthorized access or data loss have also increased. Risk-averse organizations then slow trap as they worry about what third-party automated analytics tools should be trusted when it comes to transparency as well as control of data. However, if providers fail to maintain security frameworks conformance, and fail to maintain security and compliance, among others, and hence these challenges can stymie market growth.
According to the 2025 State of Cloud Security Report by Cybersecurity Insiders, 61% of organizations identify security and compliance concerns as the primary barriers to cloud adoption
Opportunities:
-
Integration of AI and Automation into Service Models is Unlocking Smarter and Adaptive XaaS Offerings
The convergence of AI and automation with XaaS platforms enables AI-driven analytics, intelligent automation, and machine learning capabilities that add value to the service delivery on SaaS, IaaS, and PaaS models. This has embedded intelligent features, such as automated customer support, predictive maintenance, and even intelligent resource allocation into service offerings, thereby improving their value proposition. Favorable enterprises that adapt AI-enabled XaaS platforms tend to gain actionable insights, improve operational efficiency, and reduce manual overheads. Companies will now look for ways to make smarter, adaptive services, and vendors investing in AI capabilities will command a larger chunk of the market, fuelling innovation and monetization at speed.
Challenges:
-
Dependence on Single Vendors and Interoperability Challenges is Limiting Flexibility and Increasing Switching Barriers
Vendor lock-in, one of the significant issues in the XaaS market, occurs when enterprises become too dependent on a single service provider's ecosystem. It also opens them up to less agility, increased costs when swapping, and lower negotiating leverage. When services from a variety of distributors are integrated, which is usually in hybrid or multiple cloud environments, interoperability problems arise. All of these incompatibilities among systems would lead to disruption, inefficiencies, or higher costs. Similar challenges become greatly critical to very large enterprises managing and controlling the most complex IT environments. Addressing them will take something not usually offered by vendors, standardized APIs, open platforms, and vendor transparency, to help ensure businesses are not boxed in and can maintain control and flexibility over their IT strategies.
In 2024, approximately 79% of IT leaders expressed apprehension about vendor lock-in, highlighting the risks of becoming overly dependent on a single cloud service provider.
Segmentation Analysis:
By Offerings
The Solutions segment dominated the market and accounted for 72% of the everything as a service (XaaS) market share in 2024, due to its in-depth and customizable offer to meet various enterprise needs. This leadership position is driven by increasing demand for integrated platforms and advanced analytics. Growth is expected to remain strong in the future as enterprises focus on end-to-end solutions to enable digital transformation and operational efficiency across enterprises.
In January 2024, the Queensland Parliamentary Service initiated a significant digital transformation by implementing TechnologyOne's SaaS+ model. This move, aimed to modernize and enhance services provided to stakeholders, is improving process efficiency and data-driven decision-making.
The Services segment is anticipated to experience the fastest CAGR during the forecast period due to the rising need for managed, consulting, and support services. The enterpise adoption of more complex XaaS models, however, requires expert service providers to ensure seamless implementation and maintenance; this will drive growth. Broadening cloud adoption and changing IT landscapes will continue to fuel this trend through 2032.
By Type
The SaaS segment dominated the everything as a service (XaaS) market and accounted for a significant revenue share in 2024 due to simple to use, cost-effectiveness, and ability to be deployed quickly, allowing companies to access applications without heavy infrastructure investments. The cross-industry growing demand for remote collaboration tools and cloud-based software cements its market leadership. We expect the segment to sustain stable growth amid the ongoing global digital transformation.
The DRaaS segment is estimated to grow at the fastest CAGR as the demand for business continuity and disaster recovery solutions. The segment’s expansion is driven by the increasing cyber threats and loss of data, organizations implement cloud-based disaster recovery services. The demand for compliance with regulations and building robust, reliable IT infrastructures for ever-evolving digital environments will drive future growth.
Get Customized Report as per Your Business Requirement - Enquiry Now
By Organization Size
The large enterprises segment dominated the everything as a service (XaaS) market and accounted for 84% of revenue share in 2024, owing to vast IT budgets and complicated infrastructure requirements. Market leaders are leveraging early adoption of XaaS solutions to scale faster, reduce costs, and support digital transformation. From this segment specifically, steady growth is expected as Enterprises invest in advanced technologies and integrated service models to gain a competitive advantage.
The SMEs segment is projected to record the fastest CAGR during the forecast period, due to the growing accessibility and low cost of cloud solutions. Digital adoption among SMEs is constantly increasing, which in combination with the varying nature of the XaaS models allows for quick scaling with low initial costs. This will increase as more SME organizations pursue agile IT services to improve operational efficiency and business competitiveness.
By End-Use
BFSI segment dominated the everything as a service (XaaS) market in 2024 and accounted for a significant revenue share, as increasing demand for cybersecurity solutions, regulatory compliance, and digital banking services. An early adoption of XaaS solutions in these dynamic capabilities. This underpins strong demand for scalable infrastructure and real-time data processing needs in the wider sector. This segment will experience consistent growth, supported by ongoing investments in cloud technologies and fintech innovations.
The Healthcare segment is expected to register the fastest CAGR during the forecast period, due to increased digitization and telehealth, and secure, compliant IT solutions required by the healthcare system. Outsourcing healthcare plays a vital role as most of the healthcare centers play role in their XaaS, only saving money and energy through efficiently gathering data on patients, hence explosive remote care process. Rising healthcare IT budgets coupled with the adoption of AI-enabled services stand in support of future growth.
Regional Analysis:
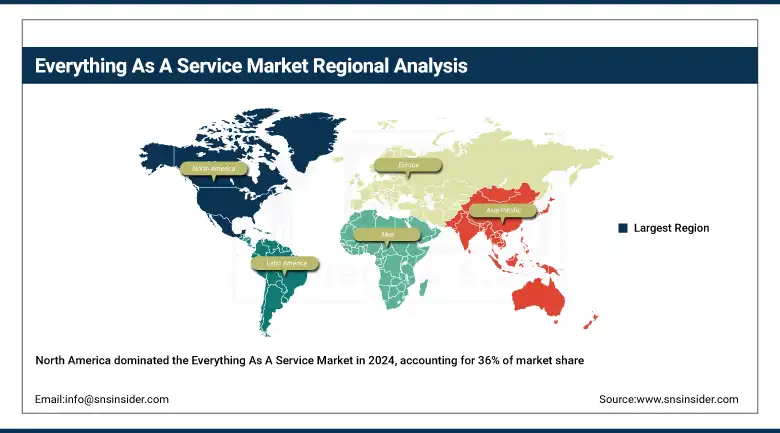
North America led the everything as a service (XaaS) market and accounted for 36% of revenue share in 2024, due to the developed IT infrastructure, higher cloud adoption rate, and various key technology providers. Ongoing digital transformation, coupled with the implementation of AI and more enterprise cloud services will keep fuelling regional growth. It will retain its leadership up to 2032 through regulatory clarity and the early adoption of technology.
The Asia Pacific is expected to register the fastest CAGR during the forecast period, which is driven by rapid digitalization, rising cloud awareness, and the growing SME sectors. Growth will be accelerated, government support for its modernization and demand for scalable IT solutions to grow at a fast clip in emerging economies such as India and Southeast Asia, as digital ecosystems continue to mature, this region is expected to experience high growth through 2032.
The strong government push towards cloud adoption, enterprise digital transformations at an unprecedented pace, and a booming tech ecosystem have made China dominate the Asia Pacific XaaS market. Continued investment in AI, 5G, and smart infrastructure will see China forge ahead with its leading position through 2032, and with double-digit growth on cloud-based service models.
The growth of XaaS market in Europe is incentivized by rising usage of cloud, data compliance (GDPR) and digital transformation programs. The region is predicted to have stable growth through 2032 as enterprises upgrade their IT systems and governments push towards better digital infrastructure and cybersecurity improvements.
Germany dominated the European everything as a service (XaaS) market, due to its demand for secure cloud solutions, combined with the leading enterprise IT spending per worker in Europe. Increased adoption in manufacturing and finance industries is estimated to propel regional growth in Germany to dominate the market through 2032 owing to investment in AI, IoT, and cloud integration technologies.
Key Players:
The major everything as a service (XaaS) market companies are Amazon Web Services, Microsoft Corporation, Google LLC, IBM Corporation, Oracle Corporation, Cisco Systems, Salesforce, Dell Technologies, VMware Inc., Alibaba Cloud, and others.
Recent Developments:
-
In November 2024, AWS announced the construction of a mega AI supercomputer in collaboration with Anthropic, utilizing its latest AI chip, Trainium 2. This initiative aims to enhance AI capabilities and support the growing demand for AI-driven services in the XaaS landscape.
-
In May 2025, At the Build 2025 conference, Microsoft unveiled significant AI advancements, including the transformation of GitHub Copilot into a comprehensive AI coding agent and the introduction of Windows AI Foundry. These developments underscore Microsoft's commitment to integrating AI across its XaaS offerings.
| Report Attributes | Details |
|---|---|
| Market Size in 2024 | US$ 341.5 Billion |
| Market Size by 2032 | US$ 1991.8 Billion |
| CAGR | CAGR of 24.68% From 2024 to 2032 |
| Base Year | 2024 |
| Forecast Period | 2024-2032 |
| Historical Data | 2021-2023 |
| Report Scope & Coverage | Market Size, Segments Analysis, Competitive Landscape, Regional Analysis, DROC & SWOT Analysis, Forecast Outlook |
| Key Segments | • By Type (IaaS, PaaS, SaaS, CaaS, DaaS, SECaaS, DRaaS, Others) • By Offerings (Solutions, Services) • By Organization Size (Large Enterprises, Small and Medium Enterprises (SMEs)) • By End-Use (BFSI, IT and Telecom, Media and Entertainment, Government, Healthcare, Manufacturing, Oil and Gas, Energy and Utilities, Others) |
| Regional Analysis/Coverage | North America (US, Canada, Mexico), Europe (Germany, France, UK, Italy, Spain, Poland, Turkey, Rest of Europe), Asia Pacific (China, India, Japan, South Korea, Singapore, Australia, Rest of Asia Pacific), Middle East & Africa (UAE, Saudi Arabia, Qatar, South Africa, Rest of Middle East & Africa), Latin America (Brazil, Argentina, Rest of Latin America) |
| Company Profiles | Amazon Web Services, Microsoft Corporation, Google LLC, IBM Corporation, Oracle Corporation, Cisco Systems, Salesforce, Dell Technologies, VMware Inc., Alibaba Cloud and others in the report |
Frequently Asked Questions
Ans- North America region dominated the Everything As A Service Market with 35% of revenue share in 2024.
Ans- The large enterprises segment dominated the everything as a service (XaaS) market and accounted for 84% of revenue share in 2024.
Ans- Rising demand for scalable and cost-efficient IT models is driving mass enterprise shift to XaaS platforms.
Ans- The Everything As A Service (XaaS) Market size was valued at USD 341.5 billion in 2024 and is expected to reach USD 1991.8 billion by 2032
Ans- The CAGR of the Everything As A Service Market during the forecast period is 24.68% from 2025-2032.
Get in Touch
