Field Service Management Market Report Scope & Overview:
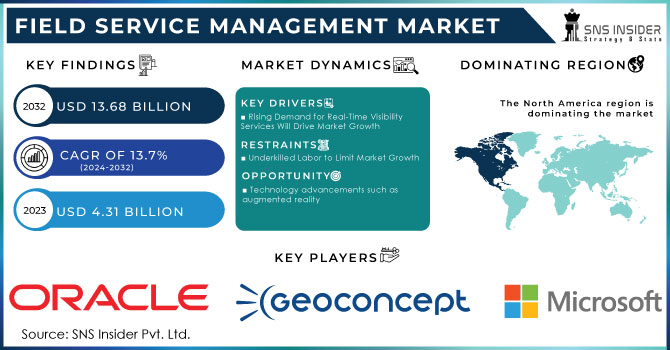
The Field Service Management (FSM) Market size was valued at USD 4.90 billion in 2024 and is expected to grow to USD 13.68 billion by 2032 and grow at a CAGR of 13.7 % over the forecast period of 2025-2032.
A major factor fuelling the growth of the field service management market is the increasing digitization of government services and initiatives towards a smart infrastructure. An example is the Latest funding by the European Union Smart Cities in 2023 with over €1.5 billion used to deploy the advanced service management technologies for urban utilities and energy projects. Such developments are fuelling the adoption of FSM platforms across multiple sectors, driving market growth.

Get more information on Field Service Management Market - Request Sample Report
Key Trends Shaping the Field Service Management Market
-
Digital Transformation & Automation: Increasing adoption of mobile and cloud-based platforms enhances workforce productivity, scheduling, and real-time task management.
-
IoT & Connected Devices: Integration of IoT enables predictive maintenance, asset tracking, and improved operational efficiency.
-
AI & Analytics: Advanced analytics and AI optimize routing, resource allocation, and decision-making for field operations.
-
Customer Experience Focus: Emphasis on improving service quality, response times, and personalized solutions to enhance client satisfaction.
-
Mobile Workforce Enablement: Mobile applications and remote access empower field technicians to manage tasks efficiently and update work orders in real time.
-
Cloud-Based Solutions: SaaS deployments offer scalability, lower upfront costs, and centralized management of field service operations.
-
Industry-Specific Solutions: Tailored FSM solutions for sectors like healthcare, utilities, telecom, and manufacturing drive adoption.
Field Service Management Market Driver:
-
The integration of AI and machine learning, enabling predictive maintenance, optimized scheduling, and real-time decision-making.
One of the latest trends driving the field service management market is the growing integration of artificial intelligence and machine learning technologies to enhance automation and predictive capabilities. AI and ML are being combined to affect FSM solutions with increasing regularity in applications; this allows for field operations to be optimized, decision-making processes to be improved, and operational efficiency to be raised. By employing AI technologies to analyze vast amounts of data collected through sensors, IoT devices, and the history of rendered services, FSM systems can predict the failure of equipment, provide routes for preventive maintenance, and plan optimal routes for field technicians. As a result, the implementation of these technologies helps companies decrease downtime and field force operational costs, raising the overall service quality. The trend is reinforced by The U.S. Department of Commerce the latest report states that investments into AI-driven instruments for field services have risen by 18% over the course of the year as current solutions utilizing the technology become more widespread. The growing popularity of AI-driven chatbots and other virtual assistants used to provide customer service or technical support is also reflected in their growth and will keep doing so as utilities, manufacturing, and telecom companies keep searching for more advanced ways to handle field operations, eliminate the needs for manual interference and boost customer satisfaction.
-
Rising Demand for Real-Time Visibility Services Will Drive Market Growth
Real-time field service solutions are in high demand across sectors to improve customer satisfaction. Real-time monitoring and control of field technicians enable organizations to resolve customer inquiries on the first try by linking them with the nearest service provider. As a result, these solutions are gaining popularity across all industries. These solutions assist organizations in promptly reacting to client concerns, hence increasing customer experience and connection. The real-time FSM system can effectively manage all field activities in order to make better business decisions.
Field Service Management Market Restraints:
-
Inexperienced Labor to Limit Market Growth
Because of the underskilled workforce, service providers and managers face a variety of issues in managing complex assets and services. Due to a shortage of skilled personnel, providers are experiencing on-the-job obstacles such as confusion regarding job requirements, increased return trips, scheduling conflicts, inability to grasp instruction, and other issues. The absence of technician training and information transfer is likely to impede on-field operations. Furthermore, due to the rising burden of on-field personnel, organizations are unable to maintain or recruit new staff. This is predicted to have a negative effect on market growth. Many businesses are employing distinct solutions, such as automation, to handle the problem.
Field Service Management Market Segmentation Analysis:
-
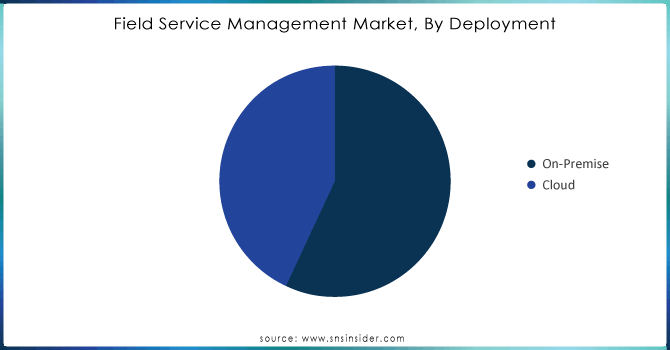
By Deployment, Cloud-Based Deployment Leads FSM Market: Scalability, Real-Time Access, and Government Digital Initiatives Drive Adoption
The cloud-based deployment model generated the highest revenue in the FSM market in 2024, accounting for a share of 66.3%. Service companies are increasingly adopting cloud solutions due to their scalability, cost-effectiveness, and easier deployment. Cloud-based FSM solutions promote real-time updates and better data access while enhancing collaboration among field teams that work across different regions. Another major factor contributing to the increasing cloud adoption rates is associated with government statistics, which indicated that the cloud expenditure of the U.S. federal government increased by 15.2% in 2024. Similar trends are observed in other developed and developing countries, where public and private sector organizations are actively using cloud-based platforms to streamline operations. The trend is not only expected to continue but also speed up because the need for remote work is increasing in the post-pandemic era, and cloud-based platforms are encouraged by the governments as part of the digital economy strategies. For instance, the Indian government has long implemented the “Digital India” initiative which integrated different cloud-based platforms to increase transparency, and accountability and minimize corruption in public service delivery. As a result, the need for large upfront investments in IT infrastructure is reducing, which makes cloud deployment a viable option for companies of all sizes.

Need any customization research on Field Service Management (FSM) Market - Enquiry Now
-
By Enterprise, Large Enterprises Dominate FSM Market: Complex Operations, Asset Management, and Real-Time Analytics Fuel Adoption
In the FSM market, large enterprises commanded the highest revenue share of 65.3% in 2024, and this is primarily because large enterprises have ample resources and their field operations are detail-oriented and complex. Large organizations such as those in the utilities, energy, and telecommunications industries have extensive field forces that require technology that handles scheduling tasks, optimizes resources, and provides real-time monitoring solutions. According to government data, in 2024, large energy-based firms increased their IT budgets by 9.8 percent to cater to more sophisticated FSM solutions. Additionally, the prevalence of assets across large enterprises that require maintenance has propelled the adoption of FSM solutions that provide real-time analytics and predictive maintenance capabilities. According to the U.K. government’s 2023 industrial strategy report, large energy and utility companies are increasingly implementing FSM software to manage their geographically dispersed assets. These organizations are prioritizing tools that can enhance productivity, minimize operational costs, and ensure compliance with strict regulatory standards. This sector-wide adoption of FSM solutions in large enterprises is further amplified by the need for robust, scalable systems that can handle the complexity of large-scale operations.
-
By End-Use, Telecommunications Industry Leads FSM Market: 5G Rollout and Expanding Network Infrastructure Drive Field Service Management Demand
The largest revenue share of the FSM market was held by telecom 31.1% in 2024. The telecommunications industry is characterized by extensive field operations for network maintenance, installation, and customer service. This major aspect has a direct impact on the high consumption of FSM solutions and is actively spurring the growth of this segment. According to data provided by the government, EMNOs raised their spending on FSM solutions by 11.5% in 2023. The objective of the industry’s considerable investment activity is network infrastructure and the operations supporting customer service improvement.
With the rollout of 5G technology and increased demand for fiber optic networks, telecom companies face rising field service demands. The U.S. government announced a new investment for the upgrading of 5G networks, which is estimated to reach $1.2 billion in 2024. This ongoing development of telecom infrastructure is the key factor behind the rising demand for FSM management that would allow effective real-time technician, equipment, and service support control.
Field Service Management (FSM) Market Regional Analysis:
-
North America Field Service Management (FSM) Market Insights
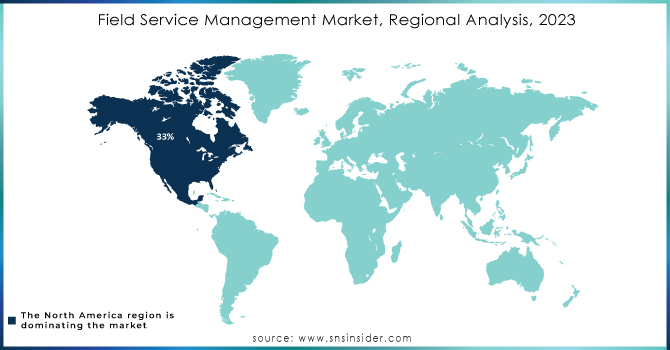
In 2024, North America dominates the Field Service Management (FSM) Market with an estimated share of 34%, driven by widespread adoption of cloud-based solutions, large-scale enterprise operations, and government digital initiatives. The region benefits from robust IT infrastructure, high enterprise IT spending, and advanced workforce management technologies, supporting efficient scheduling, real-time monitoring, and predictive maintenance across industries like utilities, energy, and telecommunications.
-
United States Leads Field Service Management (FSM) Market in North America
The U.S. dominates with the largest market share, supported by extensive field operations, increasing IT budgets, and government-backed digital transformation programs. Enterprises leverage FSM solutions to optimize geographically dispersed teams, enhance productivity, and implement predictive maintenance. Integration of mobile, AI, and cloud platforms enables real-time monitoring and efficient resource management, reinforcing the U.S. leadership position in North America’s FSM market.
-
Asia Pacific Field Service Management (FSM) Market Insights
Asia Pacific is the fastest-growing region with an estimated CAGR in 2024, driven by rapid urbanization, telecom expansion, and rising adoption of cloud and mobile FSM solutions. Government initiatives promoting digitalization, along with growing enterprise investments in infrastructure and service efficiency, accelerate market growth across emerging economies.
-
China Leads Field Service Management (FSM) Market Growth in Asia Pacific
China dominates the regional market due to massive investments in energy, utilities, and telecom sectors, coupled with strong government policies supporting digital adoption. Companies leverage FSM platforms to manage large, geographically dispersed field teams, optimize maintenance schedules, and improve operational efficiency. Smart city initiatives, combined with cloud and mobile integration, further strengthen China’s leadership in Asia.
-
Europe Field Service Management (FSM) Market Insights
In 2024, Europe holds a significant share in the Field Service Management (FSM) Market, driven by digital transformation in utilities, energy, and telecom sectors. Adoption of cloud-based FSM platforms and government-backed smart city initiatives enhances operational efficiency, reduces costs, and ensures compliance with stringent regulations.
-
Germany Dominates Europe’s Field Service Management (FSM) Market
Germany leads the European market due to high industrial digitization, robust regulatory frameworks, and strong investments in smart infrastructure. Enterprises deploy FSM solutions to optimize field operations, improve predictive maintenance, and enhance service quality, reinforcing Germany’s leadership in Europe.
-
Latin America and Middle East & Africa Field Service Management (FSM) Market Insights
The FSM Market in Latin America and MEA is witnessing steady growth, driven by telecom expansion, infrastructure development, and digital transformation initiatives. Adoption of cloud and mobile FSM platforms enables efficient resource management, real-time monitoring, and improved service delivery.
-
Regional Leaders in Latin America and MEA
Brazil leads Latin America due to telecom network investments and enterprise digitalization. In MEA, the UAE dominates, supported by smart city projects, government digital initiatives, and growing adoption of cloud-based FSM platforms.

Competitive Landscape Field Service Management (FCM) Market:
ServicePower
ServicePower is a leading provider of intelligent field service management solutions, enabling organizations to optimize service delivery and workforce performance. The company specializes in automating field service operations, including scheduling, dispatch, work order management, and real-time technician tracking. Its FSM platform uses AI-driven optimization and predictive analytics to ensure faster response times, increased productivity, and improved customer satisfaction. By integrating mobile tools and real-time reporting, ServicePower empowers businesses to manage complex field operations efficiently, reduce operational costs, and maintain high service quality across industries such as telecom, utilities, and home services.
-
In January 2024, ServicePower partnered with Encompass Simply Parts, an OEM supplier, to offer simplified and streamlined capabilities for parts ordering to all service providers utilizing the ServicePower platform and ServicePower HUB.
Telco Service
Telco Service provides specialized solutions for telecommunications service providers, focusing on the efficient management of field operations and network maintenance. Its field service management tools enable scheduling, dispatching, asset tracking, and service performance monitoring, allowing telecom operators to respond swiftly to service requests and network issues. By leveraging FSM technology, Telco Service improves operational efficiency, minimizes downtime, and enhances customer satisfaction. The platform supports mobile workforce management, real-time reporting, and predictive maintenance, helping organizations in the telecom sector streamline operations, optimize resource utilization, and ensure consistent, high-quality service delivery.
-
In December 2023, Future Connections, a managed telco service provider, integrated the Comarch FSM tool to serve its customers in B2B and B2C domains by helping resolve client inquiries, schedule meetings, and dispatch engineers to the field.
Microsoft
Microsoft is a global technology leader offering a comprehensive suite of cloud-based and on-premises solutions that support field service management. Through its Dynamics 365 Field Service platform, Microsoft enables organizations to schedule, dispatch, and track field technicians efficiently. The platform integrates AI, IoT, and predictive maintenance tools to optimize workflows, reduce service costs, and improve customer experiences. Mobile apps and real-time dashboards empower teams with critical information on assets, work orders, and service performance. Microsoft’s FSM solutions are widely adopted across industries like utilities, healthcare, and telecom, enhancing operational efficiency and ensuring high-quality field service delivery.
-
In June 2023, Microsoft announced that the release of field service software would enhance field service operations for service managers. Dispatchers can streamline the triage and assignment of work orders by prioritizing those in proximity. The updated schedule board experience is accessible to all users, and improvements for frontline workers for their mobile applications.
Field Service Management Market Companies:
-
Microsoft
-
SAP
-
IFS
-
ServiceMax
-
Infor
-
Trimble
-
Comarch
-
ServicePower
-
ServiceNow
-
OverIT
-
FieldAware
-
Zinier
-
Accruent
-
FieldEZ
-
FieldEdge
-
Jobber
-
ServiceTitan
| Report Attributes | Details |
| Market Size in 2024 | USD 4.90 Billion |
| Market Size by 2032 | USD 13.68 Billion |
| CAGR | CAGR of 13.7% From 2025 to 2032 |
| Base Year | 2024 |
| Forecast Period | 2025-2032 |
| Historical Data | 2021-2023 |
| Report Scope & Coverage | Market Size, Segments Analysis, Competitive Landscape, Regional Analysis, DROC & SWOT Analysis, Forecast Outlook |
| Key Segments | • By Component (Solution {Mobile field execution, Service contract management, Warranty management, Workforce management, Customer management, Inventory management, Others}, Services {Implementation, Training & support, Consulting & advisory}) • By Deployment (On-Premise, Cloud) • By Enterprise (Large enterprises, SMEs) • By End-use (Energy & utilities, Telecom, Manufacturing, Healthcare, BFSI, Construction & real estate, Transportation & logistics, Retail & wholesale, Others) |
| Regional Analysis/Coverage | North America (US, Canada), Europe (Germany, UK, France, Italy, Spain, Russia, Poland, Rest of Europe), Asia Pacific (China, India, Japan, South Korea, Australia, ASEAN Countries, Rest of Asia Pacific), Middle East & Africa (UAE, Saudi Arabia, Qatar, South Africa, Rest of Middle East & Africa), Latin America (Brazil, Argentina, Mexico, Colombia, Rest of Latin America). |
| Company Profiles | Oracle Corporation, Microsoft, SAP, IFS, ServiceMax, Salesforce, Infor, Trimble, Comarch, ServicePower, ServiceNow, OverIT, FieldAware, Zinier, Accruent, Praxedo, FieldEZ, FieldEdge, Jobber, ServiceTitan |

