Smart Cities Market Size & Overview:
Get more information on Smart Cities Market - Request Free Sample Report
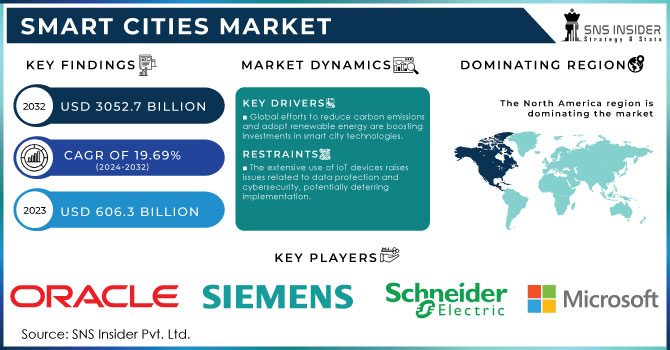
Smart Cities Market was valued at USD 606.3 billion in 2023 and is expected to reach USD 3052.7 billion by 2032, growing at a CAGR of 19.69% from 2024-2032.
The Smart Cities market is constantly growing in proportion to the steady rise of the IoT, AI, and cloud computing technologies in modern urban infrastructure. There are a number of well-established components of Smart Cities, which include energy management, intelligent transportation, digital governance, public safety systems, and sustainability initiatives. Governments all around the globe invest in these technologies to enhance their efficiency, reduce emissions, and improve the lives of their citizens. For instance, smart grids manage energy use, while AI-based traffic systems ameliorate congestion and pollution levels. The market is also nurtured by the worldwide tendency towards sustainability and environmental care. Cities become more and more urban, placing a higher demand for reduced environmental footprint. For instance, according to report, 55% of the global population currently lives in urban areas, a figure expected to reach 68% by 2050, leading to increased demand for smart infrastructure to minimize environmental impact. Furthermore, the Smart Cities market is nurtured by the increased levels of demand for public safety and security. COVID-19 has also forced cities to switch to more sustainable solutions, and the Smart Cities market has responded with the development of smart healthcare, contactless payment, and autonomous home monitoring barrier approach.
The market is connected with powerful levels of government support. For example, the Horizon Europe program proposed by the European Union contains a substantial amount of funds for the development of smart city research and innovation. Meanwhile, there is a Smart Cities Mission in India, which includes over 100 prerequisite projects. There are also land-based growth points in North America, such as New York and Toronto. At the same time, the public private partnership model helps drive the market expansion, as it fosters innovations in the field of smart technology development and implementation. Major tech corporations, such as IBM, Cisco, and Siemens, are concerned with the development of new solutions.
Smart Cities Market Dynamics
Drivers
-
Global efforts to reduce carbon emissions and adopt renewable energy are boosting investments in smart city technologies.
-
The rise of IoT, AI, and 5G technologies is enabling more efficient urban systems and services.
-
Collaborations between governments and tech companies are facilitating innovation and large-scale implementation of smart city solutions.
Governments’ partnership with technology companies is critical to advance the Smart Cities sector. Public-private partnerships combine governments’ supervision and budget with the private sector’s innovative thinking and technology. Due to limited budget, the efforts of the government by itself are typically unable to create large-scale programs associated with smart cities. Therefore, governments rely on technology giants, such as IBM, Cisco, Siemens, and Microsoft, which supply varying technologies and platforms required to build smart infrastructure, including IoT systems, AI-based traffic management, smart grids, and public safety solutions. For example, Cisco’s Smart+Connected Communities is a partnership with various cities across the world, allowing to deliver tailor-made solutions, which enhance energy savings, security, and transportation. As a result, cities’ governments are able to improve urban services and meet the cities’ sustainability targets, while the technology giants expand their technologies across the globe. Typically, the governments provide regulatory support and funding, whereas tech companies provide technology.
One of the examples is the Smart London Plan, which is a partnership between the city and multiple tech businesses that allow the city to implement data analytics, IoT, and AI in its urban infrastructure. Such partnerships are key to ensure the cities’ swift responses to the constantly growing challenges of urbanization and the need to adopt new technologies.
The development of IoT, AI, 5G technologies is leading to the transformation of the existing urban systems, and they are becoming more efficient and responsive. First, IoT technology implies the connection of different devices and sensors within the urban landscape, thus providing the opportunity to collect data in real-time about the state buildings and infrastructure, transportation, and other urban environment aspects. Moreover, such integration helps to manage the resources of cities efficiently, for instance, enabling smart grids to optimize the consumption of energy. Finally, IoT solutions contribute to the elaboration of sustainable smart waste management technologies and systems.
Second, AI is required to work with the enormous amount of data coming from different connected devices, and machine learning-based algorithms help identify patterns and processes, predict traffic jams, minimize the time of rush hours, and even optimize routes of various kinds of public transportation, using transport more evenly and even minimizing the emissions. Moreover, AI can be used to improve public safety providing sophisticated solutions for video surveillance and emergency response. Third, 5G technology is essential for such a seamless functioning of IoT and AI systems and is used to facilitate high-speed connectivity to ensure minimal latency that is necessary for the effective usage of smart solutions, such as autonomous vehicles on-board video streaming or instant transfer of the critical information concerning the road and other conditions to the central traffic management system.
Restraints
-
The extensive use of IoT devices raises issues related to data protection and cybersecurity, potentially deterring implementation.
-
A lack of skilled personnel in technology and data analysis can hinder the effective deployment and management of smart city projects.
-
Existing infrastructure may not be compatible with advanced smart technologies, requiring significant upgrades or replacements.
In the Smart Cities industry, one of the most critical problems concerning advanced smart technologies is the compatibility of the existing infrastructure. Many urban areas have been designed and built long before IOT technologies, artificial intelligence, and other modern innovations have been developed. As such, their current infrastructure, which includes transportation systems, energy grids, and communication networks, among other essential components, cannot be used to integrate the modern advanced technologies without heavy modification. For instance, traffic lights and road sensors in an ancient city may simply not be able to connect to the IOT-based traffic management solutions using AI due to technological limitations. Therefore, it will be impossible for a city to use such a system to optimize their traffic in real time. Similarly, the current energy grid in such a city may be too outdated to help accommodate smart meters or alternative energy solutions.
Replacing or updating such infrastructure is often prohibitively expensive and involves substantial logistical challenges, making many cities unwilling to employ the smart city initiative. Such projects also require extensive planning and coordination of various agents ranging from government agencies and private corporations to community organizations. Furthermore, even with extensive infrastructure modification, other issues related to the incompatibility between the implemented smart technologies and the facilities they are intended to control could arise. Such difficulties ultimately lead to negative consequences for cities, who are unable to use new technologies to improve urban life and urban sustainability.
Smart Cities Market Segment Analysis
By Application
In 2023, the smart utility segment dominated the market and represented over 30.3 % of the revenue share. Given the importance of this segment to urban infrastructure, such as water treatment, integrated data management, energy distribution, civil infrastructure management, among others, the key factor that will contribute to segment’s deployment is smart grids. Further, leading providers are striving to take advantage of advanced data analytics and cloud technologies. Owing to the growing energy demand, there is a need for companies and governments to design and implement strategies that will enhance the contribution of renewable sources to total energy production.
The environmental solution segment is anticipated to register the highest CAGR during the forecast period. Indeed, this growth will be aided by the increasing number of government initiatives aimed at pollution reduction, efficient renewable energy utilization, and creation of a business-friendly sustainable environment. Moreover, such vendors as Johnson Controls, Siemens AG, and Honeywell International are working to expand their environmental solution portfolios to improve their market revenues.
By Smart Utilities
In 2023, the energy management segment dominated the market, accounting for over 55.85% of the total revenue. It can be explained by the increasing demand for energy, which leads to the broad adoption of virtual power plants that apply AI, machine learning, and IoT to enhance security and facilitate efficient management. Top market players seek to conduct continuous efforts to build robust R&D infrastructure to expand the development of sophisticated means of energy management as well as to design various analytic solutions, which reflect the integration of state-of-the-art technologies such as blockchain.
The waste management segment is expected to achieve the considerable CAGR throughout the forecast period. It is possible because many governments enter partnerships with system integrators, distributors, and OEMs to apply smart trash bins across multiple cities. Notably, the principal actors involved in the introduction of waste management on the level of cities include local government, providers of technology solutions, distributors, and system integrators. Finally, it is essential to note that several mobile apps are being created to monitor the level of filed bins, and it is expected to multiply the level of convenience for ordinary people.
By Smart Governance
In 2023, the smart infrastructure segment dominated the market and represented over 28.3% of the overall share. The increasing importance of digitalizing modular operations among various governments will create a positive outlook for the smart infrastructure segment across BFSI, healthcare, retail, manufacturing, and food and beverage. Furthermore, the increasing investment by the U.K., Australia, India, Canada, the U.A.E, and the U.S. among others for smart infrastructure due to development in economic digitalization.
The smart lighting segment is expected to register the highest CAGR throughout the forecast period. Smart lighting is a key segment for smart cities due to its ability to drive energy efficiency that can reduce energy and maintenance costs. Furthermore, smart lighting is used in several key smart city applications such as traffic management, public safety, environmental monitoring, smart parking, and enhanced Wi-Fi and cellular communications. Additionally, the adoption of human-centric lighting methods such as light-emitting diodes will propel the expansion of the smart lighting segment.
By Smart Transportation
The Intelligent Transportation System (ITS) segment accounted for the largest revenue share in 2023. The growing number of vehicles on the road and the urgent need to reduce traffic congestion are major factors driving the implementation of advanced traffic management systems. These systems help minimize delays and air pollution, enhance traffic management by shortening travel times, and allow authorities and public safety agencies to respond swiftly and effectively to accidents and emergencies. Furthermore, many governments are adopting intelligent transportation systems to boost road safety, improve the performance of transport systems, and lessen the environmental impact of transportation. As a result, the transportation segment within the smart cities market is experiencing significant growth.
The parking management segment is projected to see a substantial compound annual growth rate (CAGR) over the forecast period. This growth is fueled by the demand for efficient management of parking spaces, environmental sustainability, cost savings, improved convenience for users, and enhanced safety and security in parking facilities. The increasing number of vehicles in urban areas poses challenges for traffic departments in effectively managing congestion.
Regional Analysis
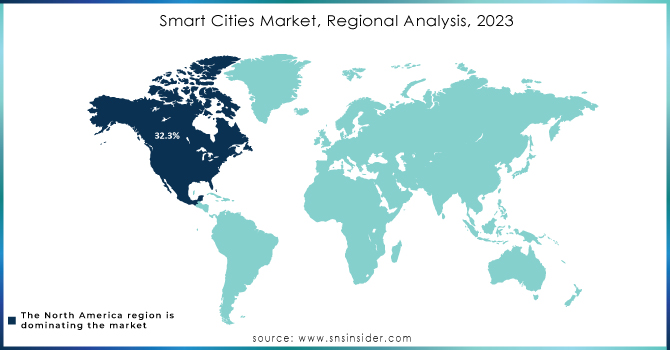
The North America dominated the market and represented over 32.3% of revenue share in 2023. The increasing expansion rate is due to a shift towards continued digitalization in such domains as government, telecommunications, and banking. Factors contributing to the region’s development include a well- established information and communication technology infrastructure, effective cooperation between the federal and local administrations, and ICT vendors, as well as the presence of global corporations focusing on technology.
The market in the U.K. held 25.1% of the European market’s revenue in 2023. Increased implementation of smart solutions in such domains as buildings, transportation, and infrastructure has been an impetus to greater numbers of global industry players to establish businesses in the recipient country, which results in market growth.
Need any customization research on Smart Cities Market - Enquiry Now
Key Players
The major key players are
-
IBM - (Intelligent Operations Center, Smart Grid)
-
Cisco Systems - (Smart+Connected Communities, IoT Control Center)
-
Siemens - (Smart Infrastructure Solutions, Traffic Management Systems)
-
Microsoft - (Azure IoT Suite, Smart City Solutions)
-
General Electric - (Digital Wind Farm, Grid Solutions)
-
Schneider Electric - (EcoStruxure, Smart Cities Solutions)
-
Honeywell - (Building Management Solutions, Smart City Solutions)
-
Oracle - (Cloud Applications for Smart Cities, Urban Planning Solutions)
-
Samsung - (Smart Lighting, Smart Home Technology)
-
Philips Lighting - (Connected Lighting Solutions, Smart Street Lighting)
-
Accenture - (Smart Cities Strategy Consulting, Digital Solutions)
-
Cisco Meraki - (Smart Cameras, Wireless Access Points)
-
Hitachi - (Social Innovation Solutions, Urban Mobility Solutions)
-
Toshiba - (Smart Community Solutions, Energy Management Systems)
-
Qualcomm - (Smart City Solutions, IoT Platforms)
-
AWS - (Amazon Web Services) (AWS IoT Core, Smart City Analytics)
-
NEC Corporation - (Smart City Solutions, Public Safety Solutions)
-
Fujitsu - (Smart City Services, Urban Infrastructure Solutions)
-
Veolia - (Smart Water Management, Waste Management Solutions)
-
Deloitte - (Smart City Advisory Services, Digital Transformation Solutions)
Key Clients
-
IBM - (City of San Francisco, City of Dubuque)
-
Cisco Systems - (Barcelona, Amsterdam)
-
Siemens - (Los Angeles, Singapore)
-
Microsoft - (Seattle, Toronto)
-
General Electric - (New York City, Dubai)
-
Schneider Electric - (Copenhagen, Sydney)
-
Honeywell - (Chicago, San Diego)
-
Oracle - (Rio de Janeiro, Singapore)
-
Samsung - (Seoul, San Francisco)
-
Philips Lighting - (New York City, Paris)
-
Accenture - (City of Chicago, City of Melbourne)
-
Cisco Meraki - (Washington D.C., City of Miami)
-
Hitachi - (Tokyo, Los Angeles)
-
Toshiba - (Fukuoka City, New York)
-
Qualcomm - (San Diego, City of San Jose)
-
AWS - (Amazon Web Services) (City of Los Angeles, City of Philadelphia)
-
NEC Corporation - (Tokyo, City of Birmingham)
-
Fujitsu - (Kawasaki City, Tokyo)
-
Veolia - (City of Paris, City of London)
-
Deloitte - (City of Melbourne, City of Baltimore)
Recent Developments
In December 2023, Msheireb Properties (MP) signed a Memorandum of Understanding with Microsoft to create a 'Smart Experience' project for visitors and residents at Msheireb Downtown Doha, enhancing urban interaction and quality of life. Meanwhile, the Smart City Expo World Congress (SCEWC) took place
In November 2023, showcasing innovative urban solutions aimed at transforming cities into sustainable and efficient environments. The congress featured eight key themes, including energy, mobility, housing, and infrastructure, highlighting strategies for improved urban living.
| Report Attributes | Details |
| Market Size in 2023 | USD 606.3 billion |
| Market Size by 2032 | USD 3052.7 billion |
| CAGR | CAGR of 19.69% From 2024 to 2032 |
| Base Year | 2023 |
| Forecast Period | 2024-2032 |
| Historical Data | 2020-2022 |
| Report Scope & Coverage | Market Size, Segments Analysis, Competitive Landscape, Regional Analysis, DROC & SWOT Analysis, Forecast Outlook |
| Key Segments | • By Application (Smart Governance, Smart Building, Environmental Solution, Smart Utilities, Smart Transportation, Smart Healthcare, Smart Public Safety, Smart Security, and Smart Education) |
| Regional Analysis/Coverage | North America (US, Canada, Mexico), Europe (Eastern Europe [Poland, Romania, Hungary, Turkey, Rest of Eastern Europe] Western Europe] Germany, France, UK, Italy, Spain, Netherlands, Switzerland, Austria, Rest of Western Europe]). Asia Pacific (China, India, Japan, South Korea, Vietnam, Singapore, Australia, Rest of Asia Pacific), Middle East & Africa (Middle East [UAE, Egypt, Saudi Arabia, Qatar, Rest of Middle East], Africa [Nigeria, South Africa, Rest of Africa], Latin America (Brazil, Argentina, Colombia Rest of Latin America) |
| Company Profiles |
IBM, Cisco Systems, Siemens, Microsoft, General Electric, Schneider Electric, Honeywell, Oracle, Samsung, Philips Lighting. |
| Key Drivers | •Global efforts to reduce carbon emissions and adopt renewable energy are boosting investments in smart city technologies. •The rise of IoT, AI, and 5G technologies is enabling more efficient urban systems and services. •Collaborations between governments and tech companies are facilitating innovation and large-scale implementation of smart city solutions. |
| Market Restraints | •The extensive use of IoT devices raises issues related to data protection and cybersecurity, potentially deterring implementation. •A lack of skilled personnel in technology and data analysis can hinder the effective deployment and management of smart city projects. •Existing infrastructure may not be compatible with advanced smart technologies, requiring significant upgrades or replacements |
Frequently Asked Questions
Challenges in Smart Cities Market are
- The extensive use of IoT devices raises issues related to data protection and cybersecurity, potentially deterring implementation.
- A lack of skilled personnel in technology and data analysis can hinder the effective deployment and management of smart city projects.
One main growth factor for Smart Cities Market is
- Global efforts to reduce carbon emissions and adopt renewable energy are boosting investments in smart city technologies.
In 2023, North America led the Smart Cities Market, capturing a significant revenue share of 32.3%.
The CAGR of Smart Cities Market during the forecast period is of 19.69% from 2024-2032.
Smart Cities Market was valued at USD 606.3 billion in 2023 and is expected to reach USD 3052.7 billion by 2032, growing at a CAGR of 19.69% from 2024-2032.
Get in Touch
