HD Map for Autonomous Vehicles Market Report Scope & Overview:

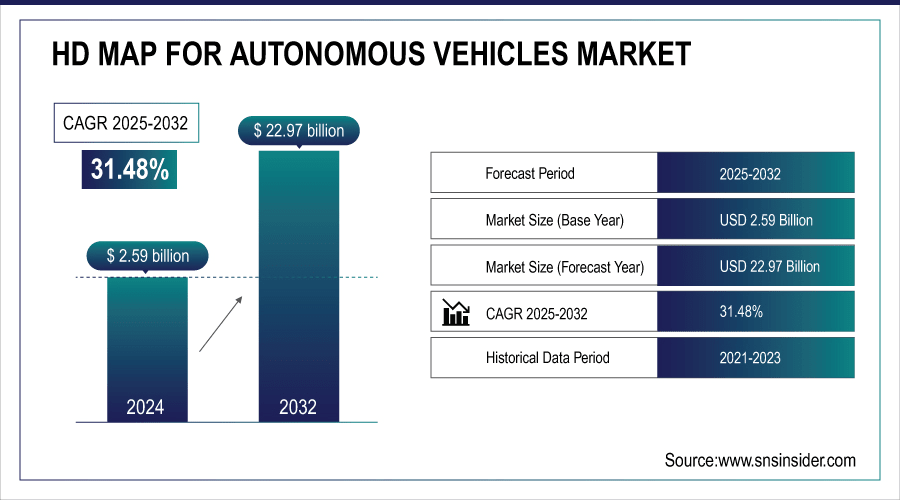
HD Map for Autonomous Vehicles Market was valued at USD 2.59 billion in 2024 and is expected to reach USD 22.97 billion by 2032, growing at a CAGR of 31.48% from 2025-2032. 

The HD Map for Autonomous Vehicles Market is rapidly growing due to increasing adoption of advanced driver-assistance systems (ADAS), the push for fully autonomous vehicles, and rising demand for precise, real-time mapping. Enhanced navigation accuracy, improved safety, and regulatory support for autonomous driving technologies are driving investments, fueling market expansion, and accelerating the adoption of high-definition mapping solutions globally.

A project by the Pennsylvania Department of Transportation demonstrated that HD maps, combined with work zone-specific reflectivity and connectivity tools like Cellular Vehicle-to-Everything (C-V2X), significantly improved object detection and Automated Driving Systems (ADS) recognition of work zone boundaries, enhancing safety and traffic flow.

The California Department of Transportation (Caltrans) highlights the role of HD maps in enabling predictive and vehicle environment data, improving automated driving performance.

Key HD Map for Autonomous Vehicles Market Trends

  • Rising adoption of autonomous and semi-autonomous vehicles is driving demand for high-definition (HD) maps.

  • Real-time localization and navigation needs are boosting investment in precise mapping technologies.

  • Integration with AI, LiDAR, and sensor fusion is enhancing map accuracy and dynamic updates.

  • Increasing vehicle-to-everything (V2X) communication is improving route planning and safety.

  • Expansion of autonomous mobility services and smart city initiatives is fueling market growth.

  • Cloud-based map updates and multi-layered map architectures are enabling scalable, real-time solutions.

  • Collaborations between automotive OEMs, tech companies, and mapping providers are accelerating HD map adoption.

U.S. HD Map for Autonomous Vehicles Market was valued at USD 0.73 billion in 2024 and is expected to reach USD 6.38 billion by 2032, growing at a CAGR of 31.23% from 2025-2032. 

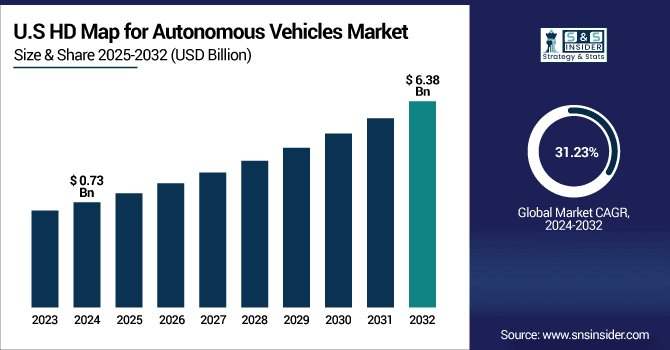
The U.S. HD Map for Autonomous Vehicles Market growth is driven by rising autonomous vehicle deployment, advanced driver-assistance system adoption, and increasing investment in smart transportation infrastructure. Demand for precise, real-time mapping and regulatory support further accelerate market expansion and technological integration.

HD Map for Autonomous Vehicles Market Growth Drivers:

  • Increasing demand for precise real-time navigation and localization to improve autonomous vehicle safety and reliability in diverse driving conditions

Growing demand for precise real-time navigation fuels the adoption of HD maps in autonomous vehicles. Standard maps are insufficient for lane-level decision-making, but HD maps provide centimeter-level accuracy, essential for safe vehicle maneuvering in urban and highway environments. With rising concerns about passenger safety and collision prevention, automakers and technology providers are increasingly integrating HD mapping solutions. These maps support predictive modeling, object detection, and adaptive routing, improving decision-making in complex traffic environments. The shift toward fully automated driving systems significantly boosts the relevance of HD mapping in ensuring both safety and navigation efficiency.

  • The Ohio Rural Automated Driving Systems (ADS) Project demonstrated that AVs equipped with HD maps operated safely without any incidents on the three designated public road routes. This underscores the critical role of HD maps in ensuring the safe operation of AVs in real-world conditions.

  • The Federal Geographic Data Committee (FGDC) highlights that HD maps support strategic goals such as safety, economic strength, equity, climate change, sustainability, and transformation. These maps enable precise vehicle positioning and coordination, enhancing safety and efficiency on the road.

HD Map for Autonomous Vehicles Market Restraints:

  • High cost of creating, updating, and maintaining detailed HD maps limiting scalability and adoption for autonomous vehicle manufacturers

The creation and maintenance of HD maps demand significant investment in sensors, data processing, and cloud infrastructure. Continuous updates are essential to capture dynamic changes such as road construction, weather conditions, or updated traffic rules. This makes the process costly and resource-intensive, posing challenges for large-scale deployment across diverse geographies. Smaller automotive manufacturers or mobility providers often face budget constraints in adopting these solutions. The financial burden associated with building and sustaining HD maps can hinder widespread adoption, particularly in developing regions where infrastructure and funding for advanced mapping technologies remain limited.

  • Creating and updating HD maps can cost up to $1,000 per kilometer, requiring frequent updates to reflect road changes, construction, and traffic conditions, posing high costs for widespread autonomous vehicle adoption.

HD Map for Autonomous Vehicles Market Opportunities:

  • Rising government initiatives for smart transportation infrastructure supporting adoption of HD maps in autonomous and connected mobility ecosystems

Governments are increasingly investing in intelligent transportation systems, smart roads, and vehicle-to-infrastructure (V2I) technologies. These initiatives create strong opportunities for HD map adoption in autonomous vehicles. Policies supporting road digitization, advanced traffic management, and sustainable mobility encourage collaboration between public authorities and private sector providers. By promoting safety, reducing congestion, and improving urban mobility, governments play a central role in accelerating HD mapping deployment. Subsidies, regulatory frameworks, and public-private partnerships further support innovation. As autonomous vehicle trials expand across major cities worldwide, demand for robust HD mapping solutions aligned with government-backed smart mobility programs will increase rapidly.

HD Map for Autonomous Vehicles Market Segment Highlights

  • By Usage Type, Personal Mobility dominated with ~55% share in 2024; Commercial Mobility fastest growing (CAGR 32.62%).

  • By Vehicle Type, Passenger Car dominated with ~64% share in 2024; Commercial Vehicles fastest growing (CAGR 32.75%).

  • By Service Type, Mapping dominated with ~35% share in 2024; Updates and Maintenance fastest growing (CAGR 33.71%).

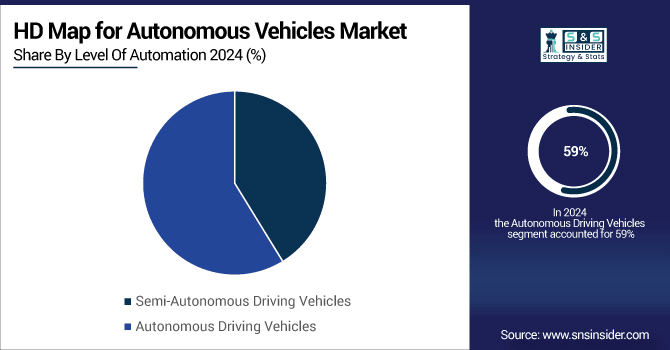
  • By Level of Automation, Autonomous Driving Vehicles dominated with ~59% share in 2024; Autonomous Driving Vehicles fastest growing (CAGR 32.56%).

HD Map for Autonomous Vehicles Market Segment Analysis

  • By Usage Type, Personal Mobility dominated while Commercial Mobility is expected to grow fastest

Personal mobility segment accounted for the largest share in 2024 due to rising adoption of autonomous ride-hailing, shared mobility platforms, and consumer demand for convenience-driven navigation. Increasing urbanization, supportive infrastructure, and the need for real-time, precise lane-level mapping further strengthened the segment’s dominance in the HD map for autonomous vehicles market.

Commercial mobility segment is expected to expand rapidly during the forecast period 2025–2032 as logistics, delivery services, and fleet operators increasingly adopt autonomous vehicles to enhance operational efficiency. The need for accurate HD mapping in freight optimization, route planning, and cost reduction will drive growth, supported by e-commerce expansion and smart logistics infrastructure investments.

  • By Vehicle Type, Passenger Cars led while Commercial Vehicles are projected to expand fastest

Passenger car segment dominated in 2024, driven by the growing integration of advanced driver-assistance systems (ADAS) and autonomous features in personal vehicles. Increasing consumer demand for safer, more efficient travel experiences and government-backed initiatives promoting smart mobility enhanced passenger vehicle reliance on HD maps, reinforcing this segment’s strong market leadership.

Commercial vehicles segment is projected to grow fastest during 2025–2032, supported by rising adoption of autonomous trucks, buses, and delivery fleets. The demand for high-precision navigation in long-haul freight, last-mile logistics, and urban delivery solutions will accelerate reliance on HD maps, making commercial vehicles the fastest-growing segment in autonomous mobility ecosystems.

  • By Service Type, Mapping dominated while Updates and Maintenance are expected to grow fastest

Mapping segment led in 2024 due to its foundational role in enabling autonomous driving, offering precise road geometry, lane markings, and infrastructure details. Automakers and technology providers prioritize high-quality mapping to ensure vehicle safety, predictive modeling, and seamless navigation, solidifying mapping as the largest revenue contributor in the HD map market.

Updates and maintenance segment is expected to see the fastest growth during 2025–2032 as autonomous vehicles require continuous real-time map adjustments for changing traffic, construction, and weather conditions. Crowdsourced data, 5G connectivity, and AI-driven updates will fuel demand, making constant maintenance crucial for safe, accurate, and scalable autonomous driving operations globally.

  • By Level of Automation, Autonomous Driving Vehicles led and are projected to grow fastest

Autonomous driving vehicles segment led the HD map for autonomous vehicles market in 2024 and is also expected to witness the fastest growth during 2025–2032. Its dominance stems from increasing deployment of self-driving technologies, growing demand for precise lane-level navigation, and enhanced safety requirements. Strong investments by automakers, technology developers, and governments in smart mobility infrastructure further accelerate growth. Expanding applications across passenger mobility, logistics, and ride-hailing strengthen reliance on HD maps, ensuring this segment remains both the largest and the fastest growing.

HD Map for Autonomous Vehicles Market Regional Highlights

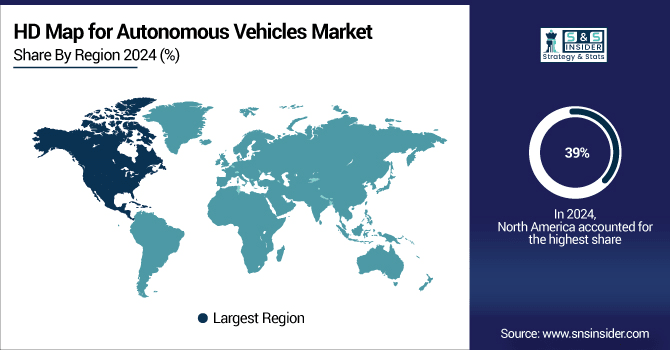
  • By Region, North America dominated with ~39% share in 2024; Asia Pacific fastest growing (CAGR 33.81%).

HD Map for Autonomous Vehicles Market Regional Analysis

North America HD Map for Autonomous Vehicles Market Insights

North America dominated the HD map for autonomous vehicles market in 2024 due to strong presence of leading automakers, technology providers, and mapping companies. Early adoption of autonomous driving technologies, advanced infrastructure, and favorable regulatory support have driven growth. High investments in R&D, robust 5G networks, and widespread testing programs further reinforced the region’s leading market position.

Asia Pacific HD Map for Autonomous Vehicles Market Insights

Asia Pacific is anticipated to witness the fastest growth during 2025–2032, driven by rapid urbanization, rising vehicle adoption, and government-backed smart mobility initiatives. Strong investments in autonomous driving, expansion of 5G networks, and growing e-commerce logistics demand are fueling adoption of HD maps. Increasing collaborations between global technology firms and regional automakers further accelerate market growth.

Europe HD Map for Autonomous Vehicles Market Insights

Europe holds a significant position in the HD map for autonomous vehicles market, supported by stringent safety regulations, strong automotive manufacturing presence, and rapid adoption of advanced driver-assistance systems. Government initiatives promoting sustainable and smart mobility, coupled with investments in intelligent transportation infrastructure, strengthen market growth. Collaboration between automakers, technology firms, and mapping providers further enhances Europe’s role in autonomous driving development.

Middle East & Africa and Latin America HD Map for Autonomous Vehicles Market Insights

Middle East & Africa and Latin America are emerging markets for HD maps in autonomous vehicles, driven by gradual adoption of smart city projects, growing urbanization, and investments in digital infrastructure. Although adoption remains limited compared to developed regions, rising interest in connected mobility, government initiatives, and collaborations with global technology providers are expected to support future market expansion.

HD Map for Autonomous Vehicles Market Competitive Landscape:

TomTom

TomTom, a leading player in the HD Map for Autonomous Vehicles Market, provides high-precision mapping and real-time navigation solutions essential for autonomous driving. Leveraging advanced sensor data, AI, and cloud-based platforms, TomTom enhances vehicle localization, safety, and route optimization. The company’s continuous investment in autonomous vehicle partnerships and map updates strengthens its market position, enabling automakers and mobility providers to deploy reliable, scalable, and accurate HD mapping solutions globally.

  • In 2024, TomTom Collaborates with Mitsubishi Electric to combine its ADAS HD-Map with Mitsubishi’s High-Definition Locator, delivering a high-precision, integrated mapping solution for next-generation autonomous vehicles.

Waymo

Waymo, a pioneer in autonomous driving, plays a key role in the HD Map for Autonomous Vehicles Market by developing highly detailed, real-time maps for self-driving vehicles. Utilizing advanced LiDAR, AI, and sensor technologies, Waymo ensures precise vehicle localization and safe navigation. Its extensive autonomous fleet and continuous map updates support reliable route planning and traffic management, solidifying its leadership in delivering scalable, accurate, and innovative HD mapping solutions for global autonomous mobility.

  • In 2025, Waymo Began mapping Tokyo’s city streets through manually driven Waymo vehicles, creating 3D maps to support simulation and adaptation of its autonomous technology for the Japanese urban environment.

HERE Technologies

HERE Technologies, a major player in the HD Map for Autonomous Vehicles Market, offers high-definition maps and location-based services critical for autonomous driving. Utilizing AI, LiDAR, and real-time data, HERE enhances vehicle localization, navigation accuracy, and safety. Strategic partnerships with automakers and technology providers, along with continuous map updates and cloud-based platforms, strengthen its market presence, enabling scalable, precise, and reliable HD mapping solutions for autonomous mobility worldwide.

  • In 2025, HERE Technologies, Extended partnership with BMW, integrating standard and HD map data into new models to deliver lane-level positioning, ADAS enhancements, and safer automated driving capabilities globally.

Key Players

Some of the HD Map for Autonomous Vehicles Market Companies

  • Waymo

  • TomTom

  • NVIDIA

  • HERE Technologies

  • Baidu

  • NavInfo

  • Civil Maps

  • Dynamic Map Platform

  • Zenrin

  • Mapbox

  • Momenta

  • Esri

  • CE Info Systems (MapmyIndia)

  • RMSI

  • The Sanborn Map Company

  • Voxelmaps

  • Wipro

  • SK Telecom

  • Hyundai MnSoft

  • Autonavi

HD Map for Autonomous Vehicles Market Report Scope:

Report Attributes Details
Market Size in 2024 USD 2.59 Billion 
Market Size by 2032 USD 22.97 Billion 
CAGR CAGR of 31.48% From 2025 to 2032
Base Year 2024
Forecast Period 2025-2032
Historical Data 2021-2023
Report Scope & Coverage Market Size, Segments Analysis, Competitive Landscape, Regional Analysis, DROC & SWOT Analysis, Forecast Outlook
Key Segments • By Service Type (Mapping, Localization, Updates and Maintenance, Advertisement)
• By Level of Automation (Semi-Autonomous Driving Vehicles, Autonomous Driving Vehicles)
• By Usage Type (Personal Mobility, Commercial Mobility)
• By Vehicle Type (Passenger Car, Commercial Vehicles)
Regional Analysis/Coverage North America (US, Canada), Europe (Germany, UK, France, Italy, Spain, Russia, Poland, Rest of Europe), Asia Pacific (China, India, Japan, South Korea, Australia, ASEAN Countries, Rest of Asia Pacific), Middle East & Africa (UAE, Saudi Arabia, Qatar, South Africa, Rest of Middle East & Africa), Latin America (Brazil, Argentina, Mexico, Colombia, Rest of Latin America).
Company Profiles Waymo, TomTom, NVIDIA, HERE Technologies, Baidu, NavInfo, Civil Maps, Dynamic Map Platform, Zenrin, Mapbox, Momenta, Esri, CE Info Systems (MapmyIndia), RMSI, The Sanborn Map Company, Voxelmaps, Wipro, SK Telecom, Hyundai MnSoft, Autonavi

Table Of Contents

1. Introduction

1.1 Market Definition & Scope

 1.2 Research Assumptions & Abbreviations

 1.3 Research Methodology

2. Executive Summary

2.1 Market Snapshot

 2.2 Market Absolute $ Opportunity Assessment & Y-o-Y Analysis, 2021–2032

 2.3 Market Size & Forecast, By Segmentation, 2021–2032

  2.3.1 Market Size By Service Type

  2.3.2 Market Size By Level Of Automation

  2.3.3 Market Size By Usage Type

  2.3.4 Market Size By Vehicle Type

 2.4 Market Share & Bps Analysis By Region, 2024

 2.5 Industry Growth Scenarios – Conservative, Likely & Optimistic

 2.6 Industry CxO’s Perspective

3. Market Overview

3.1 Market Dynamics

  3.1.1 Drivers

  3.1.2 Restraints

  3.1.3 Opportunities

  3.1.4 Key Market Trends

 3.2 Industry PESTLE Analysis

 3.3 Key Industry Forces (Porter’s) Impacting Market Growth

 3.4 Industry Supply Chain Analysis

  3.4.1 Raw Material Suppliers

  3.4.2 Manufacturers

  3.4.3 Distributors/Suppliers

  3.4.4 Customers/End-Users

 3.5 Industry Life Cycle Assessment

 3.6 Parent Market Overview

 3.7 Market Risk Assessment

4. Statistical Insights & Trends Reporting

4.1 Pricing & Cost Structure Analysis

  4.1.1 Average Pricing of HD Maps by Map Type

  4.1.2 Cost Breakdown (Data Acquisition, Processing, Cloud Storage, Maintenance)

  4.1.3 Price Trends by Vehicle Level (L2, L3, L4, L5)

  4.1.4 Regional Pricing Variations

  4.1.5 Forecasted Cost Adjustments with Real-Time Map Updates and OTA Deployment

4.2 Data & Mapping Accuracy Metrics

  4.2.1 Average Map Resolution (cm per Pixel)

  4.2.2 Map Coverage per Region (Km²)

  4.2.3 Update Frequency of HD Maps (Daily, Weekly, Monthly)

  4.2.4 Positional Accuracy (Deviation in cm)

  4.2.5 % of Roads Covered with Lane-Level Precision

4.3 Autonomous Vehicle Integration Metrics

  4.3.1 % Autonomous Vehicles Using HD Maps by Level of Automation

  4.3.2 Number of Vehicle-to-Map Connections per Fleet

  4.3.3 % Vehicles Supporting Real-Time Map Updates via OTA

  4.3.4 Integration Rate with LiDAR, Radar, and Camera Sensors (%)

  4.3.5 Average Data Consumption per Vehicle for Map Updates (GB/month)

4.4 Regulatory & Compliance Metrics

  4.4.1 % HD Map Providers Compliant with Regional AV Mapping Standards

  4.4.2 Number of Regulatory Approvals for Map Data Use in Autonomous Vehicles

  4.4.3 Legal Restrictions on Real-Time Map Sharing

  4.4.4 Regional Differences in Data Privacy & Geolocation Regulations

  4.4.5 Impact of Regulatory Changes on Map Data Costs and Update Frequency

4.5 Technology & Innovation Metrics

  4.5.1 % HD Maps Generated Using LiDAR vs. Camera vs. Radar Data

  4.5.2 AI/ML Usage for Map Feature Detection and Lane Classification (%)

  4.5.3 Cloud-Based vs. On-Board Map Processing Share (%)

  4.5.4 % HD Maps Supporting V2X Communication Integration

  4.5.5 Average Latency for Real-Time Map Updates (ms)

5. HD Map for Autonomous Vehicles Market Segmental Analysis & Forecast, By Service Type, 2021 – 2032, Value (Usd Billion)

5.1 Introduction

 5.2 Mapping

  5.2.1 Key Trends

  5.2.2 Market Size & Forecast, 2021 – 2032

 5.3 Localization

  5.3.1 Key Trends

  5.3.2 Market Size & Forecast, 2021 – 2032

 5.4 Updates and Maintenance

  5.4.1 Key Trends

  5.4.2 Market Size & Forecast, 2021 – 2032

 5.5 Advertisement

  5.5.1 Key Trends

  5.5.2 Market Size & Forecast, 2021 – 2032

6. HD Map for Autonomous Vehicles Market Segmental Analysis & Forecast, By Level Of Automation, 2021 – 2032, Value (Usd Billion)

    6.1 Introduction

 6.2 Semi-Autonomous Driving Vehicles

  6.2.1 Key Trends

  6.2.2 Market Size & Forecast, 2021 – 2032

 6.3 Autonomous Driving Vehicles

  6.3.1 Key Trends

  6.3.2 Market Size & Forecast, 2021 – 2032

7. HD Map for Autonomous Vehicles Market Segmental Analysis & Forecast, By Usage Type, 2021 – 2032, Value (Usd Billion)

    7.1 Introduction

 7.2 Personal Mobility

  7.2.1 Key Trends

  7.2.2 Market Size & Forecast, 2021 – 2032

 7.3 Commercial Mobility

  7.3.1 Key Trends

  7.3.2 Market Size & Forecast, 2021 – 2032

8. HD Map for Autonomous Vehicles Market Segmental Analysis & Forecast, By Vehicle Type, 2021 – 2032, Value (Usd Billion)

    8.1 Introduction

 8.2 Passenger Car

  8.2.1 Key Trends

  8.2.2 Market Size & Forecast, 2021 – 2032

 8.3 Commercial Vehicles

  8.3.1 Key Trends

  8.3.2 Market Size & Forecast, 2021 – 2032

9. HD Map for Autonomous Vehicles Market Segmental Analysis & Forecast By Region, 2021 – 2025, Value (Usd Billion)

9.1 Introduction

9.2 North America

 9.2.1 Key Trends

 9.2.2 HD Map for Autonomous Vehicles Market Size & Forecast, By Service Type, 2021 – 2032

 9.2.3 HD Map for Autonomous Vehicles Market Size & Forecast, By Level Of Automation, 2021 – 2032

 9.2.4 HD Map for Autonomous Vehicles Market Size & Forecast, By Usage Type, 2021 – 2032

 9.2.5 HD Map for Autonomous Vehicles Market Size & Forecast, By Vehicle Type, 2021 – 2032

 9.2.6 HD Map for Autonomous Vehicles Market Size & Forecast, By Country, 2021 – 2032

  9.2.6.1 USA

   9.2.6.1.1 HD Map for Autonomous Vehicles Market Size & Forecast, By Service Type, 2021 – 2032

   9.2.6.1.2 HD Map for Autonomous Vehicles Market Size & Forecast, By Level Of Automation, 2021 – 2032

   9.2.6.1.3 HD Map for Autonomous Vehicles Market Size & Forecast, By Usage Type, 2021 – 2032

   9.2.6.1.4 HD Map for Autonomous Vehicles Market Size & Forecast, By Vehicle Type, 2021 – 2032

  9.2.6.2 Canada

   9.2.6.2.1 HD Map for Autonomous Vehicles Market Size & Forecast, By Service Type, 2021 – 2032

   9.2.6.2.2 HD Map for Autonomous Vehicles Market Size & Forecast, By Level Of Automation, 2021 – 2032

   9.2.6.2.3 HD Map for Autonomous Vehicles Market Size & Forecast, By Usage Type, 2021 – 2032

   9.2.6.2.4 HD Map for Autonomous Vehicles Market Size & Forecast, By Vehicle Type, 2021 – 2032

9.3 Europe

 9.3.1 Key Trends

 9.3.2 HD Map for Autonomous Vehicles Market Size & Forecast, By Service Type, 2021 – 2032

 9.3.3 HD Map for Autonomous Vehicles Market Size & Forecast, By Level Of Automation, 2021 – 2032

 9.3.4 HD Map for Autonomous Vehicles Market Size & Forecast, By Usage Type, 2021 – 2032

 9.3.5 HD Map for Autonomous Vehicles Market Size & Forecast, By Vehicle Type, 2021 – 2032

 9.3.6 HD Map for Autonomous Vehicles Market Size & Forecast, By Country, 2021 – 2032

  9.3.6.1 Germany

   9.3.6.1.1 HD Map for Autonomous Vehicles Market Size & Forecast, By Service Type, 2021 – 2032

   9.3.6.1.2 HD Map for Autonomous Vehicles Market Size & Forecast, By Level Of Automation, 2021 – 2032

   9.3.6.1.3 HD Map for Autonomous Vehicles Market Size & Forecast, By Usage Type, 2021 – 2032

   9.3.6.1.4 HD Map for Autonomous Vehicles Market Size & Forecast, By Vehicle Type, 2021 – 2032

  9.3.6.2 UK

   9.3.6.2.1 HD Map for Autonomous Vehicles Market Size & Forecast, By Service Type, 2021 – 2032

   9.3.6.2.2 HD Map for Autonomous Vehicles Market Size & Forecast, By Level Of Automation, 2021 – 2032

   9.3.6.2.3 HD Map for Autonomous Vehicles Market Size & Forecast, By Usage Type, 2021 – 2032

   9.3.6.2.4 HD Map for Autonomous Vehicles Market Size & Forecast, By Vehicle Type, 2021 – 2032

  9.3.6.3 France

   9.3.6.3.1 HD Map for Autonomous Vehicles Market Size & Forecast, By Service Type, 2021 – 2032

   9.3.6.3.2 HD Map for Autonomous Vehicles Market Size & Forecast, By Level Of Automation, 2021 – 2032

   9.3.6.3.3 HD Map for Autonomous Vehicles Market Size & Forecast, By Usage Type, 2021 – 2032

   9.3.6.3.4 HD Map for Autonomous Vehicles Market Size & Forecast, By Vehicle Type, 2021 – 2032

  9.3.6.4 Italy

   9.3.6.4.1 HD Map for Autonomous Vehicles Market Size & Forecast, By Service Type, 2021 – 2032

   9.3.6.4.2 HD Map for Autonomous Vehicles Market Size & Forecast, By Level Of Automation, 2021 – 2032

   9.3.6.4.3 HD Map for Autonomous Vehicles Market Size & Forecast, By Usage Type, 2021 – 2032

   9.3.6.4.4 HD Map for Autonomous Vehicles Market Size & Forecast, By Vehicle Type, 2021 – 2032

  9.3.6.5 Spain

   9.3.6.5.1 HD Map for Autonomous Vehicles Market Size & Forecast, By Service Type, 2021 – 2032

   9.3.6.5.2 HD Map for Autonomous Vehicles Market Size & Forecast, By Level Of Automation, 2021 – 2032

   9.3.6.5.3 HD Map for Autonomous Vehicles Market Size & Forecast, By Usage Type, 2021 – 2032

   9.3.6.5.4 HD Map for Autonomous Vehicles Market Size & Forecast, By Vehicle Type, 2021 – 2032

  9.3.6.6 Russia

   9.3.6.6.1 HD Map for Autonomous Vehicles Market Size & Forecast, By Service Type, 2021 – 2032

   9.3.6.6.2 HD Map for Autonomous Vehicles Market Size & Forecast, By Level Of Automation, 2021 – 2032

   9.3.6.6.3 HD Map for Autonomous Vehicles Market Size & Forecast, By Usage Type, 2021 – 2032

   9.3.6.6.4 HD Map for Autonomous Vehicles Market Size & Forecast, By Vehicle Type, 2021 – 2032

  9.3.6.7 Poland

   9.3.6.7.1 HD Map for Autonomous Vehicles Market Size & Forecast, By Service Type, 2021 – 2032

   9.3.6.7.2 HD Map for Autonomous Vehicles Market Size & Forecast, By Level Of Automation, 2021 – 2032

   9.3.6.7.3 HD Map for Autonomous Vehicles Market Size & Forecast, By Usage Type, 2021 – 2032

   9.3.6.7.4 HD Map for Autonomous Vehicles Market Size & Forecast, By Vehicle Type, 2021 – 2032

  9.3.6.8 Rest of Europe

   9.3.6.8.1 HD Map for Autonomous Vehicles Market Size & Forecast, By Service Type, 2021 – 2032

   9.3.6.8.2 HD Map for Autonomous Vehicles Market Size & Forecast, By Level Of Automation, 2021 – 2032

   9.3.6.8.3 HD Map for Autonomous Vehicles Market Size & Forecast, By Usage Type, 2021 – 2032

   9.3.6.8.4 HD Map for Autonomous Vehicles Market Size & Forecast, By Vehicle Type, 2021 – 2032   

9.4 Asia-Pacific

 9.4.1 Key Trends

 9.4.2 HD Map for Autonomous Vehicles Market Size & Forecast, By Service Type, 2021 – 2032

 9.4.3 HD Map for Autonomous Vehicles Market Size & Forecast, By Level Of Automation, 2021 – 2032

 9.4.4 HD Map for Autonomous Vehicles Market Size & Forecast, By Usage Type, 2021 – 2032

 9.4.5 HD Map for Autonomous Vehicles Market Size & Forecast, By Vehicle Type, 2021 – 2032

 9.4.6 HD Map for Autonomous Vehicles Market Size & Forecast, By Country, 2021 – 2032

  9.4.6.1 China

   9.4.6.1.1 HD Map for Autonomous Vehicles Market Size & Forecast, By Service Type, 2021 – 2032

   9.4.6.1.2 HD Map for Autonomous Vehicles Market Size & Forecast, By Level Of Automation, 2021 – 2032

   9.4.6.1.3 HD Map for Autonomous Vehicles Market Size & Forecast, By Usage Type, 2021 – 2032

   9.4.6.1.4 HD Map for Autonomous Vehicles Market Size & Forecast, By Vehicle Type, 2021 – 2032

  9.4.6.2 India

   9.4.6.2.1 HD Map for Autonomous Vehicles Market Size & Forecast, By Service Type, 2021 – 2032

   9.4.6.2.2 HD Map for Autonomous Vehicles Market Size & Forecast, By Level Of Automation, 2021 – 2032

   9.4.6.2.3 HD Map for Autonomous Vehicles Market Size & Forecast, By Usage Type, 2021 – 2032

   9.4.6.2.4 HD Map for Autonomous Vehicles Market Size & Forecast, By Vehicle Type, 2021 – 2032

  9.4.6.3 Japan

   9.4.6.3.1 HD Map for Autonomous Vehicles Market Size & Forecast, By Service Type, 2021 – 2032

   9.4.6.3.2 HD Map for Autonomous Vehicles Market Size & Forecast, By Level Of Automation, 2021 – 2032

   9.4.6.3.3 HD Map for Autonomous Vehicles Market Size & Forecast, By Usage Type, 2021 – 2032

   9.4.6.3.4 HD Map for Autonomous Vehicles Market Size & Forecast, By Vehicle Type, 2021 – 2032

  9.4.6.4 South Korea

   9.4.6.4.1 HD Map for Autonomous Vehicles Market Size & Forecast, By Service Type, 2021 – 2032

   9.4.6.4.2 HD Map for Autonomous Vehicles Market Size & Forecast, By Level Of Automation, 2021 – 2032

   9.4.6.4.3 HD Map for Autonomous Vehicles Market Size & Forecast, By Usage Type, 2021 – 2032

   9.4.6.4.4 HD Map for Autonomous Vehicles Market Size & Forecast, By Vehicle Type, 2021 – 2032

  9.4.6.5 Australia

   9.4.6.5.1 HD Map for Autonomous Vehicles Market Size & Forecast, By Service Type, 2021 – 2032

   9.4.6.5.2 HD Map for Autonomous Vehicles Market Size & Forecast, By Level Of Automation, 2021 – 2032

   9.4.6.5.3 HD Map for Autonomous Vehicles Market Size & Forecast, By Usage Type, 2021 – 2032

   9.4.6.5.4 HD Map for Autonomous Vehicles Market Size & Forecast, By Vehicle Type, 2021 – 2032

  9.4.6.6 ASEAN Countries

   9.4.6.6.1 HD Map for Autonomous Vehicles Market Size & Forecast, By Service Type, 2021 – 2032

   9.4.6.6.2 HD Map for Autonomous Vehicles Market Size & Forecast, By Level Of Automation, 2021 – 2032

   9.4.6.6.3 HD Map for Autonomous Vehicles Market Size & Forecast, By Usage Type, 2021 – 2032

   9.4.6.6.4 HD Map for Autonomous Vehicles Market Size & Forecast, By Vehicle Type, 2021 – 2032

  9.4.6.7 Rest of Asia-Pacific

   9.4.6.7.1 HD Map for Autonomous Vehicles Market Size & Forecast, By Service Type, 2021 – 2032

   9.4.6.7.2 HD Map for Autonomous Vehicles Market Size & Forecast, By Level Of Automation, 2021 – 2032

   9.4.6.7.3 HD Map for Autonomous Vehicles Market Size & Forecast, By Usage Type, 2021 – 2032

   9.4.6.7.4 HD Map for Autonomous Vehicles Market Size & Forecast, By Vehicle Type, 2021 – 2032

9.5 Latin America

 9.5.1 Key Trends

 9.5.2 HD Map for Autonomous Vehicles Market Size & Forecast, By Service Type, 2021 – 2032

 9.5.3 HD Map for Autonomous Vehicles Market Size & Forecast, By Level Of Automation, 2021 – 2032

 9.5.4 HD Map for Autonomous Vehicles Market Size & Forecast, By Usage Type, 2021 – 2032

 9.5.5 HD Map for Autonomous Vehicles Market Size & Forecast, By Vehicle Type, 2021 – 2032

 9.5.6 HD Map for Autonomous Vehicles Market Size & Forecast, By Country, 2021 – 2032

  9.5.6.1 Brazil

   9.5.6.1.1 HD Map for Autonomous Vehicles Market Size & Forecast, By Service Type, 2021 – 2032

   9.5.6.1.2 HD Map for Autonomous Vehicles Market Size & Forecast, By Level Of Automation, 2021 – 2032

   9.5.6.1.3 HD Map for Autonomous Vehicles Market Size & Forecast, By Usage Type, 2021 – 2032

   9.5.6.1.4 HD Map for Autonomous Vehicles Market Size & Forecast, By Vehicle Type, 2021 – 2032

  9.5.6.2 Argentina

   9.5.6.2.1 HD Map for Autonomous Vehicles Market Size & Forecast, By Service Type, 2021 – 2032

   9.5.6.2.2 HD Map for Autonomous Vehicles Market Size & Forecast, By Level Of Automation, 2021 – 2032

   9.5.6.2.3 HD Map for Autonomous Vehicles Market Size & Forecast, By Usage Type, 2021 – 2032

   9.5.6.2.4 HD Map for Autonomous Vehicles Market Size & Forecast, By Vehicle Type, 2021 – 2032

  9.5.6.3 Mexico

   9.5.6.3.1 HD Map for Autonomous Vehicles Market Size & Forecast, By Service Type, 2021 – 2032

   9.5.6.3.2 HD Map for Autonomous Vehicles Market Size & Forecast, By Level Of Automation, 2021 – 2032

   9.5.6.3.3 HD Map for Autonomous Vehicles Market Size & Forecast, By Usage Type, 2021 – 2032

   9.5.6.3.4 HD Map for Autonomous Vehicles Market Size & Forecast, By Vehicle Type, 2021 – 2032

  9.5.6.4 Colombia

   9.5.6.4.1 HD Map for Autonomous Vehicles Market Size & Forecast, By Service Type, 2021 – 2032

   9.5.6.4.2 HD Map for Autonomous Vehicles Market Size & Forecast, By Level Of Automation, 2021 – 2032

   9.5.6.4.3 HD Map for Autonomous Vehicles Market Size & Forecast, By Usage Type, 2021 – 2032

   9.5.6.4.4 HD Map for Autonomous Vehicles Market Size & Forecast, By Vehicle Type, 2021 – 2032

  9.5.6.5 Rest of Latin America

   9.5.6.5.1 HD Map for Autonomous Vehicles Market Size & Forecast, By Service Type, 2021 – 2032

   9.5.6.5.2 HD Map for Autonomous Vehicles Market Size & Forecast, By Level Of Automation, 2021 – 2032

   9.5.6.5.3 HD Map for Autonomous Vehicles Market Size & Forecast, By Usage Type, 2021 – 2032

   9.5.6.5.4 HD Map for Autonomous Vehicles Market Size & Forecast, By Vehicle Type, 2021 – 2032

9.6 Middle East & Africa

 9.6.1 Key Trends

 9.6.2 HD Map for Autonomous Vehicles Market Size & Forecast, By Service Type, 2021 – 2032

 9.6.3 HD Map for Autonomous Vehicles Market Size & Forecast, By Level Of Automation, 2021 – 2032

 9.6.4 HD Map for Autonomous Vehicles Market Size & Forecast, By Usage Type, 2021 – 2032

 9.6.5 HD Map for Autonomous Vehicles Market Size & Forecast, By Vehicle Type, 2021 – 2032

 9.6.6 HD Map for Autonomous Vehicles Market Size & Forecast, By Country, 2021 – 2032

  9.6.6.1 UAE

   9.6.6.1.1 HD Map for Autonomous Vehicles Market Size & Forecast, By Service Type, 2021 – 2032

   9.6.6.1.2 HD Map for Autonomous Vehicles Market Size & Forecast, By Level Of Automation, 2021 – 2032

   9.6.6.1.3 HD Map for Autonomous Vehicles Market Size & Forecast, By Usage Type, 2021 – 2032

   9.6.6.1.4 HD Map for Autonomous Vehicles Market Size & Forecast, By Vehicle Type, 2021 – 2032

  9.6.6.2 Saudi Arabia

   9.6.6.2.1 HD Map for Autonomous Vehicles Market Size & Forecast, By Service Type, 2021 – 2032

   9.6.6.2.2 HD Map for Autonomous Vehicles Market Size & Forecast, By Level Of Automation, 2021 – 2032

   9.6.6.2.3 HD Map for Autonomous Vehicles Market Size & Forecast, By Usage Type, 2021 – 2032

   9.6.6.2.4 HD Map for Autonomous Vehicles Market Size & Forecast, By Vehicle Type, 2021 – 2032

  9.6.6.3 Qatar

   9.6.6.3.1 HD Map for Autonomous Vehicles Market Size & Forecast, By Service Type, 2021 – 2032

   9.6.6.3.2 HD Map for Autonomous Vehicles Market Size & Forecast, By Level Of Automation, 2021 – 2032

   9.6.6.3.3 HD Map for Autonomous Vehicles Market Size & Forecast, By Usage Type, 2021 – 2032

   9.6.6.3.4 HD Map for Autonomous Vehicles Market Size & Forecast, By Vehicle Type, 2021 – 2032

  9.6.6.4 Egypt

   9.6.6.4.1 HD Map for Autonomous Vehicles Market Size & Forecast, By Service Type, 2021 – 2032

   9.6.6.4.2 HD Map for Autonomous Vehicles Market Size & Forecast, By Level Of Automation, 2021 – 2032

   9.6.6.4.3 HD Map for Autonomous Vehicles Market Size & Forecast, By Usage Type, 2021 – 2032

   9.6.6.4.4 HD Map for Autonomous Vehicles Market Size & Forecast, By Vehicle Type, 2021 – 2032

  9.6.6.5 South Africa

   9.6.6.5.1 HD Map for Autonomous Vehicles Market Size & Forecast, By Service Type, 2021 – 2032

   9.6.6.5.2 HD Map for Autonomous Vehicles Market Size & Forecast, By Level Of Automation, 2021 – 2032

   9.6.6.5.3 HD Map for Autonomous Vehicles Market Size & Forecast, By Usage Type, 2021 – 2032

   9.6.6.5.4 HD Map for Autonomous Vehicles Market Size & Forecast, By Vehicle Type, 2021 – 2032

  9.6.6.6 Rest of Middle East & Africa

   9.6.6.6.1 HD Map for Autonomous Vehicles Market Size & Forecast, By Service Type, 2021 – 2032

   9.6.6.6.2 HD Map for Autonomous Vehicles Market Size & Forecast, By Level Of Automation, 2021 – 2032

   9.6.6.6.3 HD Map for Autonomous Vehicles Market Size & Forecast, By Usage Type, 2021 – 2032

   9.6.6.6.4 HD Map for Autonomous Vehicles Market Size & Forecast, By Vehicle Type, 2021 – 2032

10. Competitive Landscape

 10.1 Key Players' Positioning

 10.2 Competitive Developments

  10.2.1 Key Strategies Adopted (%), By Key Players, 2024

  10.2.2 Year-Wise Strategies & Development, 2021 – 2025

  10.2.3 Number Of Strategies Adopted By Key Players, 2024

 10.3 Market Share Analysis, 2024

 10.4 Product/Service & Application Benchmarking

  10.4.1 Product/Service Specifications & Features By Key Players

  10.4.2 Product/Service Heatmap By Key Players

  10.4.3 Application Heatmap By Key Players

 10.5 Industry Start-Up & Innovation Landscape

10.6 Key Company Profiles

 10.6.1 Waymo

  10.6.1.1 Company Overview & Snapshot

  10.6.1.2 Product/Service Portfolio

  10.6.1.3 Key Company Financials

  10.6.1.4 SWOT Analysis

 10.6.2 TomTom

  10.6.2.1 Company Overview & Snapshot

  10.6.2.2 Product/Service Portfolio

  10.6.2.3 Key Company Financials

  10.6.2.4 SWOT Analysis

 10.6.3 NVIDIA

  10.6.3.1 Company Overview & Snapshot

  10.6.3.2 Product/Service Portfolio

  10.6.3.3 Key Company Financials

  10.6.3.4 SWOT Analysis

 10.6.4 HERE Technologies

  10.6.4.1 Company Overview & Snapshot

  10.6.4.2 Product/Service Portfolio

  10.6.4.3 Key Company Financials

  10.6.4.4 SWOT Analysis

 10.6.5 Baidu

  10.6.5.1 Company Overview & Snapshot

  10.6.5.2 Product/Service Portfolio

  10.6.5.3 Key Company Financials

  10.6.5.4 SWOT Analysis

 10.6.6 NavInfo

  10.6.6.1 Company Overview & Snapshot

  10.6.6.2 Product/Service Portfolio

  10.6.6.3 Key Company Financials

  10.6.6.4 SWOT Analysis

 10.6.7 Civil Maps

  10.6.7.1 Company Overview & Snapshot

  10.6.7.2 Product/Service Portfolio

  10.6.7.3 Key Company Financials

  10.6.7.4 SWOT Analysis

 10.6.8 Dynamic Map Platform

  10.6.8.1 Company Overview & Snapshot

  10.6.8.2 Product/Service Portfolio

  10.6.8.3 Key Company Financials

  10.6.8.4 SWOT Analysis

 10.6.9 Zenrin

  10.6.9.1 Company Overview & Snapshot

  10.6.9.2 Product/Service Portfolio

  10.6.9.3 Key Company Financials

  10.6.9.4 SWOT Analysis

 10.6.10 Mapbox

  10.6.10.1 Company Overview & Snapshot

  10.6.10.2 Product/Service Portfolio

  10.6.10.3 Key Company Financials

  10.6.10.4 SWOT Analysis

 10.6.11 Momenta

  10.6.11.1 Company Overview & Snapshot

  10.6.11.2 Product/Service Portfolio

  10.6.11.3 Key Company Financials

  10.6.11.4 SWOT Analysis

 10.6.12 Esri

  10.6.12.1 Company Overview & Snapshot

  10.6.12.2 Product/Service Portfolio

  10.6.12.3 Key Company Financials

  10.6.12.4 SWOT Analysis

 10.6.13 CE Info Systems (MapmyIndia)

  10.6.13.1 Company Overview & Snapshot

  10.6.13.2 Product/Service Portfolio

  10.6.13.3 Key Company Financials

  10.6.13.4 SWOT Analysis

 10.6.14 RMSI

 10.6.14.1 Company Overview & Snapshot

  10.6.14.2 Product/Service Portfolio

  10.6.14.3 Key Company Financials

  10.6.14.4 SWOT Analysis

 10.6.15 The Sanborn Map Company

  10.6.15.1 Company Overview & Snapshot

  10.6.15.2 Product/Service Portfolio

  10.6.15.3 Key Company Financials

  10.6.15.4 SWOT Analysis

 10.6.16 Voxelmaps

  10.6.16.1 Company Overview & Snapshot

  10.6.16.2 Product/Service Portfolio

  10.6.16.3 Key Company Financials

  10.6.16.4 SWOT Analysis

 10.6.17 Wipro

  10.6.17.1 Company Overview & Snapshot

  10.6.17.2 Product/Service Portfolio

  10.6.17.3 Key Company Financials

  10.6.17.4 SWOT Analysis

 10.6.18 SK Telecom

  10.6.18.1 Company Overview & Snapshot

  10.6.18.2 Product/Service Portfolio

  10.6.18.3 Key Company Financials

  10.6.18.4 SWOT Analysis

 10.6.19 Hyundai MnSoft

  10.6.19.1 Company Overview & Snapshot

  10.6.19.2 Product/Service Portfolio

  10.6.19.3 Key Company Financials

  10.6.19.4 SWOT Analysis

 10.6.20 Autonavi

  10.6.20.1 Company Overview & Snapshot

  10.6.20.2 Product/Service Portfolio

  10.6.20.3 Key Company Financials

  10.6.20.4 SWOT Analysis

11. Analyst Recommendations

 11.1 SNS Insider Opportunity Map

 11.2 Industry Low-Hanging Fruit Assessment

 11.3 Market Entry & Growth Strategy

 11.4 Analyst Viewpoint & Suggestions On Market Growth

12. Assumptions

13. Disclaimer

14. Appendix

 14.1 List Of Tables

 14.2 List Of Figures

Key Segments: 

By Product Type

  • Ready-To-Deploy Agents

  • Build-Your-Own Agents

By Organization Size

  • Small and Medium Enterprises (SMEs)

  • Large Enterprises

By Agent System

  • Single Agent

  • Multi Agent

By Agent Role

  • Customer Service and Virtual Assistants

  • Sales and Marketing

  • Human Resources

  • Legal and Compliance

  • Financial Services

  • Other Applications

By End Users

  • Healthcare

  • BFSI

  • IT & Telecom

  • Manufacturing

  • Government & Public Sector

  • Automotive

  • Others


Request for Segment Customization as per your Business Requirement: Segment Customization Request

Regional Coverage: 

North America

  • US

  • Canada

Europe

  • Germany

  • France

  • UK

  • Italy

  • Spain

  • Poland

  • Russia

  • Rest of Europe

Asia Pacific

  • China

  • India

  • Japan

  • South Korea

  • Australia

  • ASEAN Countries

  • Rest of Asia Pacific

Middle East & Africa

  • UAE

  • Saudi Arabia

  • Qatar

  • South Africa

  • Rest of Middle East & Africa

Latin America

  • Brazil

  • Argentina

  • Mexico

  • Colombia

  • Rest of Latin America

Request for Country Level Research Report: Country Level Customization Request

Available Customization 

With the given market data, SNS Insider offers customization as per the company’s specific needs. The following customization options are available for the report: 

  • Detailed Volume Analysis 

  • Criss-Cross segment analysis (e.g. Product X Application) 

  • Competitive Product Benchmarking 

  • Geographic Analysis 

  • Additional countries in any of the regions 

  • Customized Data Representation 

  • Detailed analysis and profiling of additional market players

An accurate research report requires proper strategizing as well as implementation. There are multiple factors involved in the completion of good and accurate research report and selecting the best methodology to compete the research is the toughest part. Since the research reports we provide play a crucial role in any company’s decision-making process, therefore we at SNS Insider always believe that we should choose the best method which gives us results closer to reality. This allows us to reach at a stage wherein we can provide our clients best and accurate investment to output ratio.

Each report that we prepare takes a timeframe of 350-400 business hours for production. Starting from the selection of titles through a couple of in-depth brain storming session to the final QC process before uploading our titles on our website we dedicate around 350 working hours. The titles are selected based on their current market cap and the foreseen CAGR and growth.


The 5 steps process:

Step 1: Secondary Research:

Secondary Research or Desk Research is as the name suggests is a research process wherein, we collect data through the readily available information. In this process we use various paid and unpaid databases which our team has access to and gather data through the same. This includes examining of listed companies’ annual reports, Journals, SEC filling etc. Apart from this our team has access to various associations across the globe across different industries. Lastly, we have exchange relationships with various university as well as individual libraries.

Secondary Research

Step 2: Primary Research

When we talk about primary research, it is a type of study in which the researchers collect relevant data samples directly, rather than relying on previously collected data.  This type of research is focused on gaining content specific facts that can be sued to solve specific problems. Since the collected data is fresh and first hand therefore it makes the study more accurate and genuine.

We at SNS Insider have divided Primary Research into 2 parts.

Part 1 wherein we interview the KOLs of major players as well as the upcoming ones across various geographic regions. This allows us to have their view over the market scenario and acts as an important tool to come closer to the accurate market numbers. As many as 45 paid and unpaid primary interviews are taken from both the demand and supply side of the industry to make sure we land at an accurate judgement and analysis of the market.

This step involves the triangulation of data wherein our team analyses the interview transcripts, online survey responses and observation of on filed participants. The below mentioned chart should give a better understanding of the part 1 of the primary interview.

Primary Research

Part 2: In this part of primary research the data collected via secondary research and the part 1 of the primary research is validated with the interviews from individual consultants and subject matter experts.

Consultants are those set of people who have at least 12 years of experience and expertise within the industry whereas Subject Matter Experts are those with at least 15 years of experience behind their back within the same space. The data with the help of two main processes i.e., FGDs (Focused Group Discussions) and IDs (Individual Discussions). This gives us a 3rd party nonbiased primary view of the market scenario making it a more dependable one while collation of the data pointers.

Step 3: Data Bank Validation

Once all the information is collected via primary and secondary sources, we run that information for data validation. At our intelligence centre our research heads track a lot of information related to the market which includes the quarterly reports, the daily stock prices, and other relevant information. Our data bank server gets updated every fortnight and that is how the information which we collected using our primary and secondary information is revalidated in real time.

Data Bank Validation

Step 4: QA/QC Process

After all the data collection and validation our team does a final level of quality check and quality assurance to get rid of any unwanted or undesired mistakes. This might include but not limited to getting rid of the any typos, duplication of numbers or missing of any important information. The people involved in this process include technical content writers, research heads and graphics people. Once this process is completed the title gets uploader on our platform for our clients to read it.

Step 5: Final QC/QA Process:

This is the last process and comes when the client has ordered the study. In this process a final QA/QC is done before the study is emailed to the client. Since we believe in giving our clients a good experience of our research studies, therefore, to make sure that we do not lack at our end in any way humanly possible we do a final round of quality check and then dispatch the study to the client.