Workspace as a Service (WaaS) Market Size & Overview:
To Get More Information on Workspace as a Service (WaaS) Market - Request Sample Report
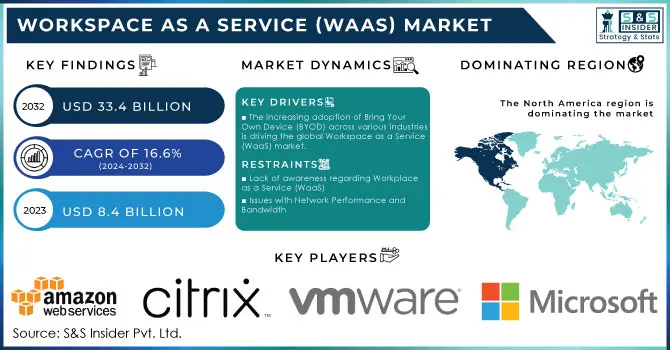
Workspace as a Service (WaaS) Market Size was valued at USD 8.4 Billion in 2023 and is expected to reach USD 33.4 Billion by 2032 and grow at a CAGR of 16.6% by 2024-2032
The Workspace as a Service (WaaS) market is driven by rising demand for flexible, cost-effective remote work solutions. Across the globe, governments support digital transformation in workplaces to meet changing labor requirements and technology changes. The BLS states that around 25% of jobs could be performed remotely as of 2023, resulting in greater public and private sector investments in WaaS solutions. Similarly, the European Union's Digital Decade Policy aims to have at least 90% of small and medium-sized enterprises (SMEs) adopt digital technologies by 2030, which is incentivizing businesses across member states to adopt WaaS solutions. Cybersecurity also is an essential aspect of the WaaS, due to imposing strict regulations from governments. The General Data Protection Regulation (GDPR) of the European Union, has increased demand for privacy and compliance-oriented secure WaaS solutions. The global push for remote and hybrid work models is thus a significant driver for the WaaS market, which is projected to grow as businesses adopt advanced, scalable solutions in line with governmental digital mandates and security regulations.
The increasing digitization in industries such as banking, financial services and insurance (BFSI), retail, manufacturing, healthcare, and education is also driving the growth of the workspace as a service market. These industries are embracing digital transformation, and WaaS systems provide the necessary infrastructure to support this transition. The market expansion is fuelled by the rising demand for cost-effective virtual desktop virtualization and automation solutions. Businesses can log in many users to a virtual server using WaaS systems, which also offer efficient resource provisioning, load balancing, and network management capabilities.
Technological improvements, such as the integration of linked devices with the Internet of Things (IoT) and cloud computing platforms, are expected to further fuel the expansion of the overall market. These advancements enhance the capabilities of WaaS systems and enable organizations to leverage the benefits of a connected and scalable workspace. Additionally, businesses are using digital business channels more frequently to provide mobile employees with scalable workplace solutions. This approach improves overall operational efficiency and allows for seamless collaboration and communication. Intensive research and development activities, along with considerable advancements in information technology (IT) infrastructure, are expected to boost the market during the forecast period. These efforts contribute to the continuous improvement and innovation of WaaS systems, making them more efficient and secure.
Market Dynamics
Drivers
- The increasing adoption of Bring Your Own Device (BYOD) across various industries is driving the global Workspace as a Service (WaaS) market.
The global workspace as a service market is experiencing significant growth due to a growing adoption of Bring Your Own Device (BYOD) policies across various industries. This trend allows employees to use their personal devices for work purposes, increasing flexibility and productivity. There is a surging demand for affordable desktop virtualization solutions. This technology enables users to access their desktops and applications from any device, reducing the need for expensive hardware upgrades.
This trend has become increasingly popular due to its ease of deployment, scalability, and quick availability. Additionally, there is a rising need for affordable virtual desktop virtualization. Major corporations, including Intel, SAP, and Blackstone, have recognized the benefits of BYOD and have started investing in these efforts. For instance, SAP has effectively utilized BYOD to increase employee flexibility while decreasing capital expenditures (CAPEX). The company has developed a unique mobile platform that comes pre-loaded with critical applications, enabling employees to work from anywhere as long as they have their mobile devices. Enterprises with multiple users registered on the same virtual Windows server can greatly benefit from WaaS solutions. By outsourcing resource provisioning, load balancing, and network difficulties to WaaS providers, organizations can reduce the additional maintenance tasks and expenses associated with virtual desktop environments. Consequently, WaaS has emerged as a cost-effective option that fulfills organizations' desktop virtualization needs.
Restrains
- Lack of awareness regarding Workplace as a Service (WaaS)
- Issues with Network Performance and Bandwidth
The global workspace as a service (WaaS) market is poised for tremendous growth, but there are significant hurdles that must be overcome. One of the most pressing challenges is network performance and bandwidth issues. These obstacles can create difficulties for users attempting to access their workspace from remote locations. While the WaaS provider may have access to high-speed internet at their office, the user's home internet connection may not possess the same capacity to handle large amounts of data. Consequently, this can result in a subpar user experience and is projected to impede the expansion of the global workspace as a service market during the analysis period.
Opportunities
- Technological improvements, such as the integration of linked devices with the Internet of Things (IoT) and cloud computing platforms, are expected to further fuel the expansion of the overall market.
Segment analysis
By Organizational Size
The Large Enterprises accounted for the largest revenue share about 72% in 2023, owing to their ability to invest in digital infrastructure. According to government data in 2023, more than 65% of all corporate investments in WaaS are made by enterprises with more than 500 employees. WaaS is becoming a growing priority for large national and multinational businesses focused on expanding operational efficiency in geographically diverse teams. Digital workspace solutions certainly scale to keep your people productive, secure, and compliant wherever they work and this aligns with the European Commission’s recommendations for strengthening the digital resilience of large enterprises. Moreover, big enterprises are adopting WaaS to minimize their IT management in one place and reduce operational expenditures concerning traditional office infrastructure. Growing adoption of WaaS in large organizations is driven not only by ease of use but also from the perspective of broader economic resilience strategies the government is progressively focusing on enterprise digitalization which has augmented the demand for Workspaces-as-a-Service (WaaS).
By Component
In 2023, the Solution segment accounted 64% share of the WaaS market as more businesses adopted software platforms that offer an integrated digital workspace. According to government data, digital solutions which range from connected devices through comprehensive software platforms composed of various integrated applications accounted for 65% of total WaaS spending in 2023 as enterprises sought out end-to-end apps rather than siloed services. This segment is set to experience a significant rise owing to the growing demand for packaged solutions that procure virtual desktops, application access, cybersecurity, and cloud at a single resolution. Cybersecurity regulations established by several government bodies such as the National Institute of Standards and Technology (NIST) in the U.S. are compelling businesses to adopt secure end-to-end WaaS solutions. Consequently, the Solution segment continues to dominate due to the regulatory emphasis on data protection and the appeal of consolidated, manageable digital workspace ecosystems.
By Industry Vertical
In 2023, the WaaS market led by the Telecom and IT sector accounted for a 25% market share. This leadership is due to the sector's requirement for uninterrupted connectivity, security, and scalable solutions for remote and hybrid work models. According to the U.S. Department of Labor, remote work is most common in IT and telecommunications companies with a remarkable 62% of employees working remotely at least partially. This is a global trend, but especially true in tech-forward regions such as North America and Western Europe. Growth in cloud services Within IT and Telecom industries, there is an increased reliance on cloud services that sync with the model of WaaS to offer access such as desktop virtualization for more ease as well resulting in virtual desktops, software applications, and also security tools for remote workforces. In addition, government mandates like the U.S. Federal Information Security Management Act (FISMA) have also led telecom companies to opt for secure, compliant WaaS solutions, further driving market growth within this sector.
Regional Analysis
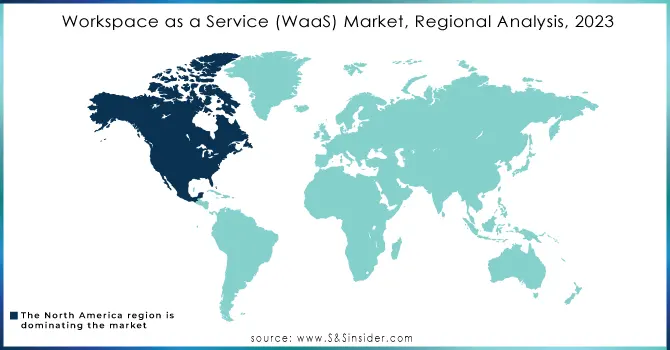
North America led the market in 2023, owing to the rapid rate of digital infrastructure adoption, supportive government policies, and tech-oriented corporate culture. The market share in the region was estimated to be around 38%, supported by various initiatives such as the Federal Government’s Modernizing Government Technology (MGT) Act and others, which promote cloud solutions, including WaaS among federal agencies to provide them with improved efficiency and security. The significant increase in the adoption rates of the Bring Your Own Device (BYOD) trend. This can be attributed to the growing need for securing enterprise data and finding cost-efficient ways to manage IT deployment in the region. As a result, the North American Workspace as a Service (WaaS) Market is being driven forward. The economic development in North America is expected to lead to an expansion of enterprises across the region. This presents a great opportunity for vendors in the market to capitalize on the growing trend of adopting WaaS and the subsequent enterprise growth. One of the key advantages of WaaS models is the ability to provide remote access, allowing employees to remain productive even in the face of technological challenges. With WaaS, users have the flexibility to switch to a different device if they encounter technical issues, without losing any valuable time waiting for repairs. This is made possible by the option to log on to their desktop from any device, ensuring uninterrupted workflow.
Asia-Pacific is witnessing the highest growth rate in terms of CAGR, where countries such as India, China, and Singapore are adopting Wheeled Authorized Shopping (WaaS) solutions at a rapid pace. The Asia Pacific region has witnessed an unprecedented adoption of mobile devices, with a substantial portion of the population relying on smartphones and tablets for their daily activities. However, this surge in mobile usage also brings forth concerns regarding system security. To address these apprehensions, businesses are increasingly turning to WaaS solutions, which offer robust security measures to safeguard sensitive data and protect against cyber threats.
Do You Need any Customization Research on Workspace as a Service (WaaS) Market - Enquire Now
Key Players
Key Service Providers/Manufacturers:
-
Amazon Web Services (AWS) (Amazon WorkSpaces, Amazon AppStream 2.0)
-
Citrix Systems, Inc. (Citrix Workspace, Citrix Virtual Apps and Desktops)
-
VMware, Inc. (VMware Horizon, VMware Workspace ONE)
-
Microsoft Corporation (Microsoft Azure Virtual Desktop, Microsoft 365)
-
Google LLC (Google Workspace, Google Cloud Virtual Desktops)
-
Cisco Systems, Inc. (Cisco Webex, Cisco Virtual Desktops)
-
Dell Technologies (Dell Cloud Client Workspace, Wyse Thin Clients)
-
IBM Corporation (IBM Cloud Virtual Server for VDI, IBM MaaS360)
-
Oracle Corporation (Oracle Virtual Desktop Infrastructure, Oracle Workspace Cloud)
- Nutanix, Inc. (Nutanix Frame, Nutanix Xi Frame)
Key Users of WaaS Services and Products
-
Deloitte
-
JPMorgan Chase & Co.
-
Accenture
-
Pfizer Inc.
-
Walmart Inc.
-
General Electric (GE)
-
Ford Motor Company
-
Siemens AG
-
Unilever
-
Ernst & Young (EY)
Recent Developments in the WaaS Market
-
In March 2023, The U.S. General Services Administration (GSA) released new directives on the adoption of cloud-based workspaces as part of its modernization efforts that triggered increased interest in WaaS from federal agencies.
-
Salesforce expanded its partnership with Google in September 2023, integrating generative AI assistants to allow secure collaboration between platforms. It enables users to create personalized content in Google Workspace, update records, and automate workflows from Salesforce. Through these integrations, they fortify the alliance between Salesforce Data Cloud and Google Cloud with connected generative AI experiences across Salesforce Customer 360 and Google Workspace.
-
In July 2023, India's Ministry of Electronics and Information Technology (MeitY) announced increased funding for SMEs adopting digital workspace solutions, bolstering the WaaS market in the country.
| Report Attributes | Details |
|---|---|
| Market Size in 2023 |
USD 8.4 Billion |
| Market Size by 2032 |
USD 33.4 Billion |
| CAGR | CAGR of 16.6% From 2024 to 2032 |
| Base Year | 2023 |
| Forecast Period | 2024-2032 |
| Historical Data | 2020-2022 |
| Report Scope & Coverage | Market Size, Segments Analysis, Competitive Landscape, Regional Analysis, DROC & SWOT Analysis, Forecast Outlook |
| Key Segments | • By Component (Solution, Services) • By Organizational Size (Large Enterprises, Small and Medium Enterprises) • By Deployment Mode (Public Cloud, Private Cloud, Hybrid Cloud) • By Industry Vertical (BFSI, IT and Telecom, Retail, Healthcare, Manufacturing, Government, Travel and Hospitality, Education, Others) |
| Regional Analysis/Coverage | North America (US, Canada, Mexico), Europe (Eastern Europe [Poland, Romania, Hungary, Turkey, Rest of Eastern Europe] Western Europe] Germany, France, UK, Italy, Spain, Netherlands, Switzerland, Austria, Rest of Western Europe]), Asia Pacific (China, India, Japan, South Korea, Vietnam, Singapore, Australia, Rest of Asia Pacific), Middle East & Africa (Middle East [UAE, Egypt, Saudi Arabia, Qatar, Rest of Middle East], Africa [Nigeria, South Africa, Rest of Africa], Latin America (Brazil, Argentina, Colombia, Rest of Latin America) |
| Company Profiles |
Amazon Web Services (AWS), Citrix Systems, Inc., VMware, Inc., Microsoft Corporation, Google LLC, Cisco Systems, Inc., Dell Technologies, IBM Corporation, Oracle Corporation, Nutanix, Inc. |
| Key Drivers | •The increasing adoption of Bring Your Own Device (BYOD) across various industries is driving the global Workspace as a Service (WaaS) market. |
| RESTRAINTS | •Lack of awareness regarding Workplace as a Service (WaaS) •Issues with Network Performance and Bandwidth |
Frequently Asked Questions
Ans- Workspace as a Service (WaaS) Market Size was valued at USD 8.4 Billion in 2023 and is expected to reach USD 33.4 Billion by 2032 and grow at a CAGR of 16.6% by 2024-2032
Ans- the CAGR of the Workspace as a Service (WaaS) Market during the forecast period is of 16.6% from 2024-2032.
Ans- In 2023, North America dominated the market and held a significant revenue share.
Ans: The solutions component segment dominated the Workspace as a Service (WaaS) Market.
Ans- Challenges in the Workplace as a Service (WaaS) Market are
- Increased use of remote access raises data security risks, deterring adoption for sensitive industries.
- Effective WaaS usage requires stable, high-speed internet, which may be lacking in some regions.
Get in Touch
