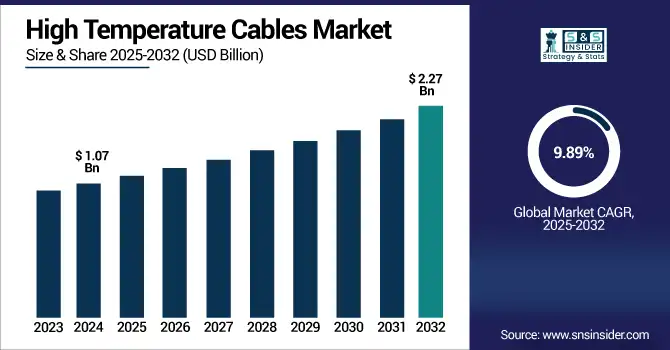
The High Temperature Cables Market Size was valued at USD 1.07 billion in 2024 and is expected to reach USD 2.27 billion by 2032 and grow at a CAGR of 9.89% over the forecast period 2025-2032.
Global Market Insights provides detailed analysis on segmentation, trends, dynamics, competitive landscape and opportunities available in the market. Expanded due to the increasing demand from power generation, automotive, aerospace, and industrial industries. Cable performance is being improved by technology advances in insulation and conductor materials, and growing investments in heat-resistant infrastructure. High Temperature Cables Market analysis reveals evolving applications across harsh environments. Such factors render high-temperature cables indispensable for reliable operation under extreme environmental conditions in modern global electrical and energy-intensive technology frameworks.
For instance, over 65% of industrial automation systems now rely on heat-resistant cables for mission-critical control and power delivery.
The U.S. High Temperature Cables Market size was USD 0.20 billion in 2024 and is expected to reach USD 0.41 billion by 2032, growing at a CAGR of 9.61% over the forecast period of 2025–2032.
U.S. market is well positioned and robust growth is attributed to increase in renewable energy installations, infrastructure upgrades, and growth in aerospace and defense sectors. A rise in need for heat-resistant wiring in harsh industrial environments also supports adoption. In addition, strong R&D investments in advanced materials and insulation technologies are improving the performance and reliability of the cables. All these factors are cumulatively contributing to the continuous usage of the high temperature cable in multiple high demand high performance applications across the country.
For instance, over 85% of high-temperature cables used in U.S. aerospace and defense sectors meet MIL-DTL-25038 or UL 5128 standards.
Key Drivers:
Rapid Industrialization and Electrification of Automotive and Aerospace Manufacturing
The rapid growth of the automotive and aerospace industries is further accelerating the demand for high-temperature cable and therefore the high-temperature cable market. They are used in electric vehicle (EV) battery packs, aircraft engines, and control systems and have an important role that requires their ability to withstand heat while maintaining electrical integrity. High-performance, thermal capable cables are essential for both EVs and compact next-gen aircraft. In addition, manufacturing is becoming increasingly automated and integrated with AI for fast decision-making, which in turn makes the need for continuous power reliability crystal clear, creating strong demand for premium high-temperature wiring solutions in such industries.
For instance, new-generation aerospace cables are being engineered with lightweight high-temp materials—reducing up to 20% cable weight for fuel efficiency.
Restraints:
High Cost of Advanced Materials and Complex Manufacturing Processes
Production costs jump considerably with nickel-alloys, silver-plated copper, and high-grade insulation materials. Just as other high-quality cables, these cables are individually manufactured and extensively tested, resulting in higher price point as compared to traditional cables. This price sensitivity is more pronounced among SMEs with more limited capital budgets. Change in prices of raw materials, particularly copper and specialty polymers, also brings uncertainty in the markets. High Temperature Cables Market trends highlight rising concerns over material cost volatility. We said that the significant initial investment required might act as a deterrent to adoption, especially in price-sensitive sectors and in the developing regions, where budgets are strained.
Opportunities:
Rising Demand for Heat-Resistant Cables in Electric Vehicle Infrastructure and Battery Systems
The mainstreaming of electric vehicles is driving up demand for high-temperature cables used in BMS, charging infrastructure, and powertrains. These parts function under situations of high load and temperature and need uncompromising thermal performance. EV charging stations, especially fast chargers, also need to ensure thermally stable connections. This has developed a huge prospect for cable players to supply their customized solution in line with this developing interface specification. High Temperature Cables Market growth is accelerating through EV sector innovation. The shift to more affordable mid-market EV models combined with government incentives to encourage adoption and infrastructure rollout is propelling demand and expanding this segment as a growth opportunity for future cable development and innovation.
For instance, heat-related wear is responsible for over 40% of failures in high-power EV charging stations, highlighting the need for thermally optimized cabling.
Challenges:
Technological Limitations in Achieving Both Flexibility and Thermal Resistance Simultaneously
The key technical challenge for this market is the tradeoff between thermal tolerance and mechanical flexibility. There are materials with better heat resistance such as ceramic fiber and mica, but these do not allow flex and can crack when repeatedly bent. However, more pliable materials may not be able to handle the highest temperature thresholds. This approach ties the flexibility of cables into a complicated, yet static assembly that is unable to work in-the-loop for the dynamic or mobile applications such as in robotics and aerospace systems. Tackling this challenge needs advanced R&D on composite materials, which can be costly and lengthy.
By Type
In the year 2024, fiberglass led the market with a 25.7% share due to its affordability and high thermal resistance in addition to the availability of fiberglass. This is widely used in industrial equipment, power plants, and automotive wiring in applications that require durable and high-temperature insulation. Thermal Wire and Cable, LLC excels in providing durable, fiberglass-based solutions optimized for its end-use in acclaimed high-heat environments, which makes it ideal for bred industrial usage and long-living presence, further sustaining its share in the high-temperature cables space.
Mica-based cables are expected to have the highest CAGR of 11.83% from 2024–2032 due to their outstanding flame resistance and dielectric strength. They are, however, beginning to see use in critical applications such as nuclear power plants, and in aerospace and defense systems. One of the primary suppliers of mica insulated cables, RSCC Wire & Cable, supplies high quality wiring under fire and high heat conditions, driving the mica insulated cables market growth in safety-critical and challenging environments.
By Voltage
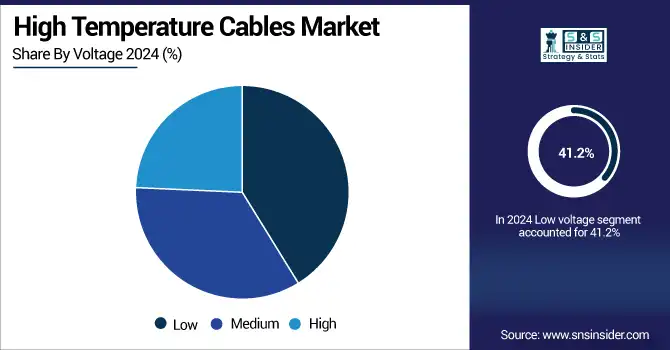
Low voltage cables held a significant market share in terms of revenue, accounting for 41.2% in 2024, owing to their wide-scale usage in consumer electronics, household appliances, and automotive systems. Lucid's market sovereignty can largely be attributed to their cheaper price point, relative ease of installation, and capability of meeting the thermal requirements of low-load circuits. General Cable (member of Prysmian Group) has been offering a robust variety of low-voltage high-temperature cables for several sectors that enhance their adoption in end-user and industrial-grade applications quickly.
High voltage cables are anticipated to witness the highest growth at a market growth rate of 10.51% from 2024 to 2032 owing to their high accessibility whenever there is a need for power transmission in juiced up power supply and booming heavy industrial applications during the projected period. This resistance to high voltage and thermal stress makes them essential for infrastructure such as wind farms and utility-scale grids. Nexans S.A., a global leader in the cable industry's development and supply of advanced energy cable solutions, has sustained its investment in high-voltage high-temperature cable innovation as an enduring effort to improve energy safety and efficiency in the world's most demanding energy environments, particularly for renewable and smart grid projects.
By Conductor Material
In 2024, Copper accounted for the largest share of 38.6% as a conductor material. Copper is the most popular conductor due to its excellent thermal conductivity, strength, and electrical performance. Well-suited for most high temperature applications due to its long history of reliability and compatibility with numerous insulation types. Various industrial and infrastructural applications of copper enable companies such Southwire Company, LLC to be prominent players in the business of producing copper-based thermal cables, or cables designed to meet electrical requirements with copper’s long-lasting durability and conductivity across market segments.
Nickel-Alloy is expected to witness the highest growth rate of 11.34% from 2024–2032 attributable to excellent resistance to extreme heat and corrosion. Aerospace engines, refiners, and high-performance industrial settings are all ideal locations for these cables. Okonite Company specializes in high-grade nickel-alloy conductor cables for hot, aggressive environments. They are a leader for non-corrosive cables for critical infrastructure and defense-related applications.
By Application
In 2024, Energy segment dominated the High Temperature Cables market share on account of increasing adoption of high-temperature cables in thermal power plant and renewable energy systems & electrical substations, contributing to 24.5% share of the market. Critical in the operation of turbines, generators and transmission systems for high heat loads. Through capability in providing custom cable solutions to energy sector clients to ensure performance and safety at extreme temperatures, TPC Wire & Cable Corp further strengthens energy as a key application segment.
Aerospace & defense applications are expected to grow with the highest CAGR of 11.99% from 2024–2032 due to increasing defense budgets and space exploration efforts. Cables operating under high temperatures are important in aerospace engines, military jets and satellites. TE Connectivity - a leader supplier for high-performance cable assemblies specifically for thermal extremes for aerospace/military use designed for the rising demand for this segment in the defense and commercial aviation market.
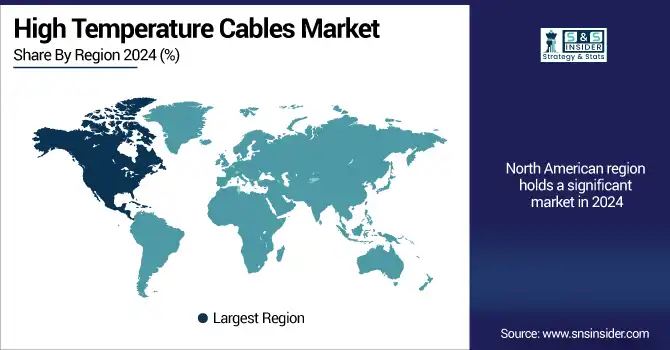
North America benefits from high industrial automation, an increasing aerospace and defense sector, and an ever-increasing energy infrastructure upgrade process. The region is characterized with competitive R&D capabilities, stringent safety regulations and adoption of renewable energy technologies. The U.S. has a significant market share due to the increasing need for heat and durable cables for mission-critical uses in industrial and harsh environments.
The U.S. dominates the North American high temperature cables industry due to its advanced aerospace and defense sectors, extensive industrial infrastructure, and strong investments in power grid modernization, renewable energy projects, and high-performance electrical systems requiring heat-resistant cabling.
Asia Pacific was driven by rapid industrialization and energy demand along with burgeoning manufacturing in China, India, and Japan which captured the largest revenue share of 30.6% in 2024. Due to investments in renewable energy, electric vehicles, smart grids, and industrial automation, the region is anticipated to grow at the highest CAGR of 10.69% during the period of 2024 to 2032, as local production and technology advances.
China leads the Asia Pacific market owing to its massive manufacturing base, rapid urbanization, and large-scale investments in renewable energy, EV infrastructure, and industrial automation—driving significant demand for high-performance, heat-resistant cables across critical infrastructure and export-oriented industries.
In Europe, the high temperature cables market is significantly driven by the demand from automotive, aerospace and energy sectors due to stringent safety standard regulations and environmental considerations. Germany, France and the UK are ahead in terms of preparedness for building more advanced cabling solutions of the EVs, industrial automation, and renewable energy systems. Moreover, the market in the region is also being driven by technological innovation and sustainability initiatives.
Germany dominates the European high temperature cables market due to its strong industrial base, advanced automotive manufacturing, and leadership in renewable energy. Its strict safety standards and focus on technological innovation drive high demand for durable, heat-resistant cable solutions.
Middle East & Africa is dominated by Saudi Arabia, owing to the huge oil, gas, and power infrastructure in the country. Brazil is the largest market in Latin America, benefiting greatly from the trends of industrialization, increasing renewable energy generation projects and rising automotive production—creating increased demand for protective, heat-resistant cabling solutions within both regions.
Major Key Players in High Temperature Cables companies are Nexans S.A., Prysmian Group, Leoni AG, TE Connectivity Ltd., Belden Inc., Sumitomo Electric Industries, Ltd., Southwire Company, LLC, TPC Wire & Cable Corp., Okonite Company, RSCC Wire & Cable, Thermo Electric Company, Inc, Cable USA, Axon’ Cable, General Cable, Eland Cables, HELUKABEL GmbH, Lapp Group, Bhuwal Cables Ltd., Anixter International Inc. and Thermal Wire and Cable, LLC and others.
In June 2025, Nexans showcased high-temperature superconducting (HTS) cables at the CIRED conference, highlighting their potential to revolutionize energy grids—such as Chicago’s REG project and Paris’s SuperRail rail system.
In February 2025, TE Connectivity announced its planned acquisition of Richards Manufacturing for around USD 2.3 billion to enhance its underground/overhead electrical and gas distribution offerings—areas tied closely to high-performance, heat-resistant cable systems.
Report Attributes | Details |
---|---|
Market Size in 2024 | USD 1.07 Billion |
Market Size by 2032 | USD 2.27 Billion |
CAGR | CAGR of 9.89% From 2025 to 2032 |
Base Year | 2024 |
Forecast Period | 2025-2032 |
Historical Data | 2021-2023 |
Report Scope & Coverage | Market Size, Segments Analysis, Competitive Landscape, Regional Analysis, DROC & SWOT Analysis, Forecast Outlook |
Key Segments | • By Type (Fluoroplastic, Silicone rubber, Fiberglass, Ceramic fiber, Mica-based and Others) • By Voltage (Low, Medium and High) • By Conductor Material (Copper, Aluminum, Nickel-Alloy, Silver-Plated Copper and Tinned Copper) • By Application (Energy, Electric Appliances, Industrial Machinery, Aerospace & Defense, Automotive and Others. |
Regional Analysis/Coverage | North America (US, Canada, Mexico), Europe (Germany, France, UK, Italy, Spain, Poland, Turkey, Rest of Europe), Asia Pacific (China, India, Japan, South Korea, Singapore, Australia,Taiwan, Rest of Asia Pacific), Middle East & Africa (UAE, Saudi Arabia, Qatar, South Africa, Rest of Middle East & Africa), Latin America (Brazil, Argentina, Rest of Latin America) |
Company Profiles | Nexans S.A., Prysmian Group, Leoni AG, TE Connectivity Ltd., Belden Inc., Sumitomo Electric Industries, Ltd., Southwire Company, LLC, TPC Wire & Cable Corp., Okonite Company, RSCC Wire & Cable, Thermo Electric Company, Inc. , Cable USA , Axon’ Cable , General Cable, Eland Cables, HELUKABEL GmbH, Lapp Group, Bhuwal Cables Ltd., Anixter International Inc. and Thermal Wire and Cable, LLC. |
Ans: The High Temperature Cables Market is expected to grow at a CAGR of 9.89% from 2025-2032.
Ans: The High Temperature Cables Market size was USD 1.07 Billion in 2024 and is expected to reach USD 2.27 Billion by 2032.
Ans: Rising demand for fast-charging, high-power energy storage in electric vehicles, industrial systems, and renewable grids drives market growth.
Ans: The Energy segment dominated the High Temperature Cables Market in 2024.
Ans: Asia Pacific dominated the High Temperature Cables Market in 2024.
Table Of Contents
1. Introduction
1.1 Market Definition & Scope
1.2 Research Assumptions & Abbreviations
1.3 Research Methodology
2. Executive Summary
2.1 Market Snapshot
2.2 Market Absolute $ Opportunity Assessment & Y-o-Y Analysis, 2021–2032
2.3 Market Size & Forecast, By Segmentation, 2021–2032
2.3.1 Market Size By Type
2.3.2 Market Size By Voltage
2.4 Market Share & Bps Analysis By Region, 2024
2.5 Industry Growth Scenarios – Conservative, Likely & Optimistic
2.6 Industry CxO’s Perspective
3. Market Overview
3.1 Market Dynamics
3.1.1 Drivers
3.1.2 Restraints
3.1.3 Opportunities
3.1.4 Key Market Trends
3.2 Industry PESTLE Analysis
3.3 Key Industry Forces (Porter’s) Impacting Market Growth
3.4 Industry Supply Chain Analysis
3.4.1 Raw Material Suppliers
3.4.2 Manufacturers
3.4.3 Distributors/Suppliers
3.4.4 Customers/End-Users
3.5 Industry Life Cycle Assessment
3.6 Parent Market Overview
3.7 Market Risk Assessment
4. Statistical Insights & Trends Reporting
4.1.1 Overview
4.1.1.1 Average selling price (ASP) trends globally and regionally
4.1.1.2 Factors influencing price shifts: component costs, design complexity, brand value
4.1.1.3 Cost vs. retail markup analysis across product categories
4.1.1.4 Seasonal discounting trends (Black Friday, Singles’ Day, etc.)
4.1.1.5 Price tier breakdown: Entry-level, mid-tier, premium
4.1.2 Pricing Analysis & Forecast By Type, 2021–2032
4.1.2.1 Forecast of pricing erosion By Type type due to commoditization
4.1.2.2 Subscription-based pricing forecasts (e.g., Whoop, Fitbit Premium)
4.1.2.3 Bundled pricing trends (e.g., with health insurance, telecom plans)
4.1.2.4 Shifts in average pricing due to sensor upgrades (ECG, SpO2, etc.)
4.1.3 Price Benchmarking By Key Players, 2024
4.1.3.1 Price vs. feature benchmarking of leading brands (e.g., Apple, Fitbit, Huawei, Amazfit)
4.1.3.2 Strategic pricing: penetration pricing (e.g., Xiaomi), skimming (e.g., Garmin)
4.1.3.3 Pricing dispersion across regions for same models
4.1.3.4 Benchmarking of hardware-only vs. device + subscription models
4.2 Regulatory Landscape
4.2.1 Overview
4.2.1.1 Global regulatory maturity level by region
4.2.1.2 Timeline of key regulatory developments affecting wearables
4.2.1.3 Emerging standards for accuracy, safety, and data transmission
4.2.1.4 Ethical concerns in wearable health data collection
4.2.2 Regulatory Trends By Key Countries
4.2.2.1 USA: FDA’s evolving digital health framework, RPM guidelines
4.2.2.2 EU: GDPR compliance in wearable apps; MDR device classification
4.2.2.3 China: Cybersecurity Law implications for cloud-based wearable platforms
4.2.2.4 India: Digital Personal Data Protection Act (DPDP), BIS certification
4.2.2.5 Brazil, Australia, Japan: Health & consumer tech policy landscape
4.2.3 Regulatory Outlook By Type Type
4.2.3.1 Medical-grade smartwatches vs. wellness wearables: classification differences
4.2.3.2 Hearables and data recording/privacy mandates
4.2.3.3 Smart glasses: face capture/AR compliance with privacy laws
4.2.3.4 Cross-border compliance challenges for global brands
4.3 Trade Analysis
4.3.1 Overview
4.3.1.1 Global trade volume and growth trends in wearable electronics
4.3.1.2 Shifts in global supply chains: China+1 strategies
4.3.1.3 Impact of geopolitical tensions (US–China, EU–China) on trade
4.3.1.4 Import/export cost inflation due to semiconductor shortages
4.3.2 Import Analysis (Value & Volume), By Country, 2021–2024
4.3.2.1 Top importing countries By Type segment (e.g., smartwatches vs. smart rings)
4.3.2.2 Import dependency analysis: % domestic vs. foreign procurement
4.3.2.3 Role of Free Trade Agreements (FTAs) in wearable imports
4.3.2.4 Change in importer profiles post-pandemic (e.g., rise in India, LATAM)
4.3.3 Export Analysis (Value & Volume), By Country, 2021–2024
4.3.3.1 Key exporting countries and their share of global exports
4.3.3.2 Exports by ODM/OEMs vs. branded exports
4.3.3.3 Growth in export volume for health-focused vs. fitness-focused devices
4.3.3.4 Decline/growth in component vs. finished goods exports
4.3.4 Major Importing Countries
4.3.4.1 Consumer demographics and spending behavior
4.3.4.2 Tariff analysis for key importing countries
4.3.4.3 Logistics performance and supply chain reliability
4.3.4.4 Government procurement trends (public healthcare or military wearables)
4.3.5 Major Exporting Countries
4.3.5.1 Share of global manufacturing located in China, Vietnam, Taiwan
4.3.5.2 Government support for exports (e.g., tax incentives, subsidies)
4.3.5.3 Export value per unit and profitability by country
4.3.5.4 Export-led innovation hubs and clusters (e.g., Shenzhen, Seoul)
5. High Temperature Cables Market Segmental Analysis & Forecast, By Type, 2021 – 2032, Value (Usd Billion) & Volume (Litre)
5.1 Introduction
5.2 Fluoroplastic
5.2.1 Key Trends
5.2.2 Market Size & Forecast, 2021 – 2032
5.3 Silicone rubber
5.3.1 Key Trends
5.3.2 Market Size & Forecast, 2021 – 2032
5.4 Fiberglass
5.4.1 Key Trends
5.4.2 Market Size & Forecast, 2021 – 2032
5.5 Ceramic fiber
5.5.1 Key Trends
5.5.2 Market Size & Forecast, 2021 – 2032
5.6 Mica-based
5.6.1 Key Trends
5.6.2 Market Size & Forecast, 2021 – 2032
5.7 Others
5.7.1 Key Trends
5.7.2 Market Size & Forecast, 2021 – 2032
6. High Temperature Cables Market Segmental Analysis & Forecast, By Voltage, 2021 – 2032, Value (Usd Billion) & Volume (Litre)
6.1 Introduction
6.2 Low
6.2.1 Key Trends
6.2.2 Market Size & Forecast, 2021 – 2032
6.3 Medium
6.3.1 Key Trends
6.3.2 Market Size & Forecast, 2021 – 2032
6.4 High
6.4.1 Key Trends
6.4.2 Market Size & Forecast, 2021 – 2032
7. High Temperature Cables Market Segmental Analysis & Forecast, By Conductor Material, 2021 – 2032, Value (Usd Billion) & Volume (Litre)
7.1 Introduction
7.2 Copper
7.2.1 Key Trends
7.2.2 Market Size & Forecast, 2021 – 2032
7.3 Aluminum
7.3.1 Key Trends
7.3.2 Market Size & Forecast, 2021 – 2032
7.4 Nickel-Alloy
7.4.1 Key Trends
7.4.2 Market Size & Forecast, 2021 – 2032
7.5 Silver Plated Copper
7.5.1 Key Trends
7.5.2 Market Size & Forecast, 2021 – 2032
7.6 Tinned Copper
7.6.1 Key Trends
7.6.2 Market Size & Forecast, 2021 – 2032
8. High Temperature Cables Market Segmental Analysis & Forecast, By Application, 2021 – 2032, Value (Usd Billion) & Volume (Litre)
8.1 Introduction
8.2 Energy
8.2.1 Key Trends
8.2.2 Market Size & Forecast, 2021 – 2032
8.3 Electric Appliances
8.3.1 Key Trends
8.3.2 Market Size & Forecast, 2021 – 2032
8.4 Industrial Machinery
8.4.1 Key Trends
8.4.2 Market Size & Forecast, 2021 – 2032
8.5 Aerospace & Defense
8.5.1 Key Trends
8.5.2 Market Size & Forecast, 2021 – 2032
8.6 Automotive
8.6.1 Key Trends
8.6.2 Market Size & Forecast, 2021 – 2032
8.7 Others
8.7.1 Key Trends
8.7.2 Market Size & Forecast, 2021 – 2032
9. High Temperature Cables Market Segmental Analysis & Forecast By Region, 2021 – 2025, Value (Usd Billion) & Volume (Litre)
9.1 Introduction
9.2 North America
9.2.1 Key Trends
9.2.2 High Temperature Cables Market Size & Forecast, By Type, 2021 – 2032
9.2.3 High Temperature Cables Market Size & Forecast, By Voltage, 2021 – 2032
9.2.4 High Temperature Cables Market Size & Forecast, By Conductor Material, 2021 – 2032
9.2.5 High Temperature Cables Market Size & Forecast, By Application, 2021 – 2032
9.2.6 High Temperature Cables Market Size & Forecast, By Country, 2021 – 2032
9.2.6.1 USA
9.2.6.1.1 High Temperature Cables Market Size & Forecast, By Type, 2021 – 2032
9.2.6.1.2 High Temperature Cables Market Size & Forecast, By Voltage, 2021 – 2032
9.2.6.1.3 High Temperature Cables Market Size & Forecast, By Conductor Material, 2021 – 2032
9.2.6.1.4 High Temperature Cables Market Size & Forecast, By Application, 2021 – 2032
9.2.6.2 Canada
9.2.6.2.1 High Temperature Cables Market Size & Forecast, By Type, 2021 – 2032
9.2.6.2.2 High Temperature Cables Market Size & Forecast, By Voltage, 2021 – 2032
9.2.6.2.3 High Temperature Cables Market Size & Forecast, By Conductor Material, 2021 – 2032
9.2.6.2.4 High Temperature Cables Market Size & Forecast, By Application, 2021 – 2032
9.3 Europe
9.3.1 Key Trends
9.3.2 High Temperature Cables Market Size & Forecast, By Type, 2021 – 2032
9.3.3 High Temperature Cables Market Size & Forecast, By Voltage, 2021 – 2032
9.3.4 High Temperature Cables Market Size & Forecast, By Conductor Material, 2021 – 2032
9.3.5 High Temperature Cables Market Size & Forecast, By Application, 2021 – 2032
9.3.6 High Temperature Cables Market Size & Forecast, By Country, 2021 – 2032
9.3.6.1 Germany
9.3.6.1.1 High Temperature Cables Market Size & Forecast, By Type, 2021 – 2032
9.3.6.1.2 High Temperature Cables Market Size & Forecast, By Voltage, 2021 – 2032
9.3.6.1.3 High Temperature Cables Market Size & Forecast, By Conductor Material, 2021 – 2032
9.3.6.1.4 High Temperature Cables Market Size & Forecast, By Application, 2021 – 2032
9.3.6.2 UK
9.3.6.2.1 High Temperature Cables Market Size & Forecast, By Type, 2021 – 2032
9.3.6.2.2 High Temperature Cables Market Size & Forecast, By Voltage, 2021 – 2032
9.3.6.2.3 High Temperature Cables Market Size & Forecast, By Conductor Material, 2021 – 2032
9.3.6.2.4 High Temperature Cables Market Size & Forecast, By Application, 2021 – 2032
9.3.6.3 France
9.3.6.3.1 High Temperature Cables Market Size & Forecast, By Type, 2021 – 2032
9.3.6.3.2 High Temperature Cables Market Size & Forecast, By Voltage, 2021 – 2032
9.3.6.3.3 High Temperature Cables Market Size & Forecast, By Conductor Material, 2021 – 2032
9.3.6.3.4 High Temperature Cables Market Size & Forecast, By Application, 2021 – 2032
9.3.6.4 Italy
9.3.6.4.1 High Temperature Cables Market Size & Forecast, By Type, 2021 – 2032
9.3.6.4.2 High Temperature Cables Market Size & Forecast, By Voltage, 2021 – 2032
9.3.6.4.3 High Temperature Cables Market Size & Forecast, By Conductor Material, 2021 – 2032
9.3.6.4.4 High Temperature Cables Market Size & Forecast, By Application, 2021 – 2032
9.3.6.5 Spain
9.3.6.5.1 High Temperature Cables Market Size & Forecast, By Type, 2021 – 2032
9.3.6.5.2 High Temperature Cables Market Size & Forecast, By Voltage, 2021 – 2032
9.3.6.5.3 High Temperature Cables Market Size & Forecast, By Conductor Material, 2021 – 2032
9.3.6.5.4 High Temperature Cables Market Size & Forecast, By Application, 2021 – 2032
9.3.6.6 Russia
9.3.6.6.1 High Temperature Cables Market Size & Forecast, By Type, 2021 – 2032
9.3.6.6.2 High Temperature Cables Market Size & Forecast, By Voltage, 2021 – 2032
9.3.6.6.3 High Temperature Cables Market Size & Forecast, By Conductor Material, 2021 – 2032
9.3.6.6.4 High Temperature Cables Market Size & Forecast, By Application, 2021 – 2032
9.3.6.7 Poland
9.3.6.7.1 High Temperature Cables Market Size & Forecast, By Type, 2021 – 2032
9.3.6.7.2 High Temperature Cables Market Size & Forecast, By Voltage, 2021 – 2032
9.3.6.7.3 High Temperature Cables Market Size & Forecast, By Conductor Material, 2021 – 2032
9.3.6.7.4 High Temperature Cables Market Size & Forecast, By Application, 2021 – 2032
9.3.6.8 Rest of Europe
9.3.6.8.1 High Temperature Cables Market Size & Forecast, By Type, 2021 – 2032
9.3.6.8.2 High Temperature Cables Market Size & Forecast, By Voltage, 2021 – 2032
9.3.6.8.3 High Temperature Cables Market Size & Forecast, By Conductor Material, 2021 – 2032
9.3.6.8.4 High Temperature Cables Market Size & Forecast, By Application, 2021 – 2032
9.4 Asia-Pacific
9.4.1 Key Trends
9.4.2 High Temperature Cables Market Size & Forecast, By Type, 2021 – 2032
9.4.3 High Temperature Cables Market Size & Forecast, By Voltage, 2021 – 2032
9.4.4 High Temperature Cables Market Size & Forecast, By Conductor Material, 2021 – 2032
9.4.5 High Temperature Cables Market Size & Forecast, By Application, 2021 – 2032
9.4.6 High Temperature Cables Market Size & Forecast, By Country, 2021 – 2032
9.4.6.1 China
9.4.6.1.1 High Temperature Cables Market Size & Forecast, By Type, 2021 – 2032
9.4.6.1.2 High Temperature Cables Market Size & Forecast, By Voltage, 2021 – 2032
9.4.6.1.3 High Temperature Cables Market Size & Forecast, By Conductor Material, 2021 – 2032
9.4.6.1.4 High Temperature Cables Market Size & Forecast, By Application, 2021 – 2032
9.4.6.2 India
9.4.6.2.1 High Temperature Cables Market Size & Forecast, By Type, 2021 – 2032
9.4.6.2.2 High Temperature Cables Market Size & Forecast, By Voltage, 2021 – 2032
9.4.6.2.3 High Temperature Cables Market Size & Forecast, By Conductor Material, 2021 – 2032
9.4.6.2.4 High Temperature Cables Market Size & Forecast, By Application, 2021 – 2032
9.4.6.3 Japan
9.4.6.3.1 High Temperature Cables Market Size & Forecast, By Type, 2021 – 2032
9.4.6.3.2 High Temperature Cables Market Size & Forecast, By Voltage, 2021 – 2032
9.4.6.3.3 High Temperature Cables Market Size & Forecast, By Conductor Material, 2021 – 2032
9.4.6.3.4 High Temperature Cables Market Size & Forecast, By Application, 2021 – 2032
9.4.6.4 South Korea
9.4.6.4.1 High Temperature Cables Market Size & Forecast, By Type, 2021 – 2032
9.4.6.4.2 High Temperature Cables Market Size & Forecast, By Voltage, 2021 – 2032
9.4.6.4.3 High Temperature Cables Market Size & Forecast, By Conductor Material, 2021 – 2032
9.4.6.4.4 High Temperature Cables Market Size & Forecast, By Application, 2021 – 2032
9.4.6.5 Australia
9.4.6.5.1 High Temperature Cables Market Size & Forecast, By Type, 2021 – 2032
9.4.6.5.2 High Temperature Cables Market Size & Forecast, By Voltage, 2021 – 2032
9.4.6.5.3 High Temperature Cables Market Size & Forecast, By Conductor Material, 2021 – 2032
9.4.6.5.4 High Temperature Cables Market Size & Forecast, By Application, 2021 – 2032
9.4.6.6 ASEAN Countries
9.4.6.6.1 High Temperature Cables Market Size & Forecast, By Type, 2021 – 2032
9.4.6.6.2 High Temperature Cables Market Size & Forecast, By Voltage, 2021 – 2032
9.4.6.6.3 High Temperature Cables Market Size & Forecast, By Conductor Material, 2021 – 2032
9.4.6.6.4 High Temperature Cables Market Size & Forecast, By Application, 2021 – 2032
9.4.6.7 Rest of Asia-Pacific
9.4.6.7.1 High Temperature Cables Market Size & Forecast, By Type, 2021 – 2032
9.4.6.7.2 High Temperature Cables Market Size & Forecast, By Voltage, 2021 – 2032
9.4.6.7.3 High Temperature Cables Market Size & Forecast, By Conductor Material, 2021 – 2032
9.4.6.7.4 High Temperature Cables Market Size & Forecast, By Application, 2021 – 2032
9.5 Latin America
9.5.1 Key Trends
9.5.2 High Temperature Cables Market Size & Forecast, By Type, 2021 – 2032
9.5.3 High Temperature Cables Market Size & Forecast, By Voltage, 2021 – 2032
9.5.4 High Temperature Cables Market Size & Forecast, By Conductor Material, 2021 – 2032
9.5.5 High Temperature Cables Market Size & Forecast, By Application, 2021 – 2032
9.5.6 High Temperature Cables Market Size & Forecast, By Country, 2021 – 2032
9.5.6.1 Brazil
9.5.6.1.1 High Temperature Cables Market Size & Forecast, By Type, 2021 – 2032
9.5.6.1.2 High Temperature Cables Market Size & Forecast, By Voltage, 2021 – 2032
9.5.6.1.3 High Temperature Cables Market Size & Forecast, By Conductor Material, 2021 – 2032
9.5.6.1.4 High Temperature Cables Market Size & Forecast, By Application, 2021 – 2032
9.5.6.2 Argentina
9.5.6.2.1 High Temperature Cables Market Size & Forecast, By Type, 2021 – 2032
9.5.6.2.2 High Temperature Cables Market Size & Forecast, By Voltage, 2021 – 2032
9.5.6.2.3 High Temperature Cables Market Size & Forecast, By Conductor Material, 2021 – 2032
9.5.6.2.4 High Temperature Cables Market Size & Forecast, By Application, 2021 – 2032
9.5.6.3 Mexico
9.5.6.3.1 High Temperature Cables Market Size & Forecast, By Type, 2021 – 2032
9.5.6.3.2 High Temperature Cables Market Size & Forecast, By Voltage, 2021 – 2032
9.5.6.3.3 High Temperature Cables Market Size & Forecast, By Conductor Material, 2021 – 2032
9.5.6.3.4 High Temperature Cables Market Size & Forecast, By Application, 2021 – 2032
9.5.6.4 Colombia
9.5.6.4.1 High Temperature Cables Market Size & Forecast, By Type, 2021 – 2032
9.5.6.4.2 High Temperature Cables Market Size & Forecast, By Voltage, 2021 – 2032
9.5.6.4.3 High Temperature Cables Market Size & Forecast, By Conductor Material, 2021 – 2032
9.5.6.4.4 High Temperature Cables Market Size & Forecast, By Application, 2021 – 2032
9.5.6.5 Rest of Latin America
9.5.6.5.1 High Temperature Cables Market Size & Forecast, By Type, 2021 – 2032
9.5.6.5.2 High Temperature Cables Market Size & Forecast, By Voltage, 2021 – 2032
9.5.6.5.3 High Temperature Cables Market Size & Forecast, By Conductor Material, 2021 – 2032
9.5.6.5.4 High Temperature Cables Market Size & Forecast, By Application, 2021 – 2032
9.6 Middle East & Africa
9.6.1 Key Trends
9.6.2 High Temperature Cables Market Size & Forecast, By Type, 2021 – 2032
9.6.3 High Temperature Cables Market Size & Forecast, By Voltage, 2021 – 2032
9.6.4 High Temperature Cables Market Size & Forecast, By Conductor Material, 2021 – 2032
9.6.5 High Temperature Cables Market Size & Forecast, By Application, 2021 – 2032
9.6.6 High Temperature Cables Market Size & Forecast, By Country, 2021 – 2032
9.6.6.1 UAE
9.6.6.1.1 High Temperature Cables Market Size & Forecast, By Type, 2021 – 2032
9.6.6.1.2 High Temperature Cables Market Size & Forecast, By Voltage, 2021 – 2032
9.6.6.1.3 High Temperature Cables Market Size & Forecast, By Conductor Material, 2021 – 2032
9.6.6.1.4 High Temperature Cables Market Size & Forecast, By Application, 2021 – 2032
9.6.6.2 Saudi Arabia
9.6.6.2.1 High Temperature Cables Market Size & Forecast, By Type, 2021 – 2032
9.6.6.2.2 High Temperature Cables Market Size & Forecast, By Voltage, 2021 – 2032
9.6.6.2.3 High Temperature Cables Market Size & Forecast, By Conductor Material, 2021 – 2032
9.6.6.2.4 High Temperature Cables Market Size & Forecast, By Application, 2021 – 2032
9.6.6.3 Qatar
9.6.6.3.1 High Temperature Cables Market Size & Forecast, By Type, 2021 – 2032
9.6.6.3.2 High Temperature Cables Market Size & Forecast, By Voltage, 2021 – 2032
9.6.6.3.3 High Temperature Cables Market Size & Forecast, By Conductor Material, 2021 – 2032
9.6.6.3.4 High Temperature Cables Market Size & Forecast, By Application, 2021 – 2032
9.6.6.4 Egypt
9.6.6.4.1 High Temperature Cables Market Size & Forecast, By Type, 2021 – 2032
9.6.6.4.2 High Temperature Cables Market Size & Forecast, By Voltage, 2021 – 2032
9.6.6.4.3 High Temperature Cables Market Size & Forecast, By Conductor Material, 2021 – 2032
9.6.6.4.4 High Temperature Cables Market Size & Forecast, By Application, 2021 – 2032
9.6.6.5 South Africa
9.6.6.5.1 High Temperature Cables Market Size & Forecast, By Type, 2021 – 2032
9.6.6.5.2 High Temperature Cables Market Size & Forecast, By Voltage, 2021 – 2032
9.6.6.5.3 High Temperature Cables Market Size & Forecast, By Conductor Material, 2021 – 2032
9.6.6.5.4 High Temperature Cables Market Size & Forecast, By Application, 2021 – 2032
9.6.6.6 Rest of Middle East & Africa
9.6.6.6.1 High Temperature Cables Market Size & Forecast, By Type, 2021 – 2032
9.6.6.6.2 High Temperature Cables Market Size & Forecast, By Voltage, 2021 – 2032
9.6.6.6.3 High Temperature Cables Market Size & Forecast, By Conductor Material, 2021 – 2032
9.6.6.6.4 High Temperature Cables Market Size & Forecast, By Application, 2021 – 2032
10. Competitive Landscape
10.1 Key Players' Positioning
10.2 Competitive Developments
10.2.1 Key Strategies Adopted (%), By Key Players, 2024
10.2.2 Year-Wise Strategies & Development, 2021 – 2025
10.2.3 Number Of Strategies Adopted By Key Players, 2024
10.3 Market Share Analysis, 2024
10.4 Product/Service & Application Benchmarking
10.4.1 Product/Service Specifications & Features By Key Players
10.4.2 Product/Service Heatmap By Key Players
10.4.3 Application Heatmap By Key Players
10.5 Industry Start-Up & Innovation Landscape
10.6 Key Company Profiles
10.6.1 Nexans S.A.
10.6.1.1 Company Overview & Snapshot
10.6.1.2 Product/Service Portfolio
10.6.1.3 Key Company Financials
10.6.1.4 SWOT Analysis
10.6.2 Prysmian Group
10.6.2.1 Company Overview & Snapshot
10.6.2.2 Product/Service Portfolio
10.6.2.3 Key Company Financials
10.6.2.4 SWOT Analysis
10.6.3 Leoni AG
10.6.3.1 Company Overview & Snapshot
10.6.3.2 Product/Service Portfolio
10.6.3.3 Key Company Financials
10.6.3.4 SWOT Analysis
10.6.4 TE Connectivity Ltd.
10.6.4.1 Company Overview & Snapshot
10.6.4.2 Product/Service Portfolio
10.6.4.3 Key Company Financials
10.6.4.4 SWOT Analysis
10.6.5 Belden Inc.
10.6.5.1 Company Overview & Snapshot
10.6.5.2 Product/Service Portfolio
10.6.5.3 Key Company Financials
10.6.5.4 SWOT Analysis
10.6.6 Sumitomo Electric Industries, Ltd.
10.6.6.1 Company Overview & Snapshot
10.6.6.2 Product/Service Portfolio
10.6.6.3 Key Company Financials
10.6.6.4 SWOT Analysis
10.6.7 Southwire Company, LLC
10.6.7.1 Company Overview & Snapshot
10.6.7.2 Product/Service Portfolio
10.6.7.3 Key Company Financials
10.6.7.4 SWOT Analysis
10.6.8 TPC Wire & Cable Corp.
10.6.8.1 Company Overview & Snapshot
10.6.8.2 Product/Service Portfolio
10.6.8.3 Key Company Financials
10.6.8.4 SWOT Analysis
10.6.9 Okonite Company
10.6.9.1 Company Overview & Snapshot
10.6.9.2 Product/Service Portfolio
10.6.9.3 Key Company Financials
10.6.9.4 SWOT Analysis
10.6.10 RSCC Wire & Cable
10.6.10.1 Company Overview & Snapshot
10.6.10.2 Product/Service Portfolio
10.6.10.3 Key Company Financials
10.6.10.4 SWOT Analysis
10.6.11 Thermo Electric Company, Inc.
10.6.11.1 Company Overview & Snapshot
10.6.11.2 Product/Service Portfolio
10.6.11.3 Key Company Financials
10.6.11.4 SWOT Analysis
10.6.12 Cable USA
10.6.12.1 Company Overview & Snapshot
10.6.12.2 Product/Service Portfolio
10.6.12.3 Key Company Financials
10.6.12.4 SWOT Analysis
10.6.13 Axon’ Cable
10.6.13.1 Company Overview & Snapshot
10.6.13.2 Product/Service Portfolio
10.6.13.3 Key Company Financials
10.6.13.4 SWOT Analysis
10.6.14 General Cable
10.6.14.1 Company Overview & Snapshot
10.6.14.2 Product/Service Portfolio
10.6.14.3 Key Company Financials
10.6.14.4 SWOT Analysis
10.6.15 Eland Cables
10.6.15.1 Company Overview & Snapshot
10.6.15.2 Product/Service Portfolio
10.6.15.3 Key Company Financials
10.6.15.4 SWOT Analysis
10.6.16 HELUKABEL GmbH
10.6.16.1 Company Overview & Snapshot
10.6.16.2 Product/Service Portfolio
10.6.16.3 Key Company Financials
10.6.16.4 SWOT Analysis
10.6.17 Lapp Group
10.6.17.1 Company Overview & Snapshot
10.6.17.2 Product/Service Portfolio
10.6.17.3 Key Company Financials
10.6.17.4 SWOT Analysis
10.6.18 Bhuwal Cables Ltd.
10.6.18.1 Company Overview & Snapshot
10.6.18.2 Product/Service Portfolio
10.6.18.3 Key Company Financials
10.6.18.4 SWOT Analysis
10.6.19 Anixter International Inc.
10.6.19.1 Company Overview & Snapshot
10.6.19.2 Product/Service Portfolio
10.6.19.3 Key Company Financials
10.6.19.4 SWOT Analysis
10.6.20 Thermal Wire and Cable, LLC
10.6.20.1 Company Overview & Snapshot
10.6.20.2 Product/Service Portfolio
10.6.20.3 Key Company Financials
10.6.20.4 SWOT Analysis
11. Analyst Recommendations
11.1 SNS Insider Opportunity Map
11.2 Industry Low-Hanging Fruit Assessment
11.3 Market Entry & Growth Strategy
11.4 Analyst Viewpoint & Suggestions On Market Growth
12. Assumptions
13. Disclaimer
14. Appendix
14.1 List Of Tables
14.2 List Of Figures
An accurate research report requires proper strategizing as well as implementation. There are multiple factors involved in the completion of good and accurate research report and selecting the best methodology to compete the research is the toughest part. Since the research reports we provide play a crucial role in any company’s decision-making process, therefore we at SNS Insider always believe that we should choose the best method which gives us results closer to reality. This allows us to reach at a stage wherein we can provide our clients best and accurate investment to output ratio.
Each report that we prepare takes a timeframe of 350-400 business hours for production. Starting from the selection of titles through a couple of in-depth brain storming session to the final QC process before uploading our titles on our website we dedicate around 350 working hours. The titles are selected based on their current market cap and the foreseen CAGR and growth.
The 5 steps process:
Step 1: Secondary Research:
Secondary Research or Desk Research is as the name suggests is a research process wherein, we collect data through the readily available information. In this process we use various paid and unpaid databases which our team has access to and gather data through the same. This includes examining of listed companies’ annual reports, Journals, SEC filling etc. Apart from this our team has access to various associations across the globe across different industries. Lastly, we have exchange relationships with various university as well as individual libraries.
Step 2: Primary Research
When we talk about primary research, it is a type of study in which the researchers collect relevant data samples directly, rather than relying on previously collected data. This type of research is focused on gaining content specific facts that can be sued to solve specific problems. Since the collected data is fresh and first hand therefore it makes the study more accurate and genuine.
We at SNS Insider have divided Primary Research into 2 parts.
Part 1 wherein we interview the KOLs of major players as well as the upcoming ones across various geographic regions. This allows us to have their view over the market scenario and acts as an important tool to come closer to the accurate market numbers. As many as 45 paid and unpaid primary interviews are taken from both the demand and supply side of the industry to make sure we land at an accurate judgement and analysis of the market.
This step involves the triangulation of data wherein our team analyses the interview transcripts, online survey responses and observation of on filed participants. The below mentioned chart should give a better understanding of the part 1 of the primary interview.
Part 2: In this part of primary research the data collected via secondary research and the part 1 of the primary research is validated with the interviews from individual consultants and subject matter experts.
Consultants are those set of people who have at least 12 years of experience and expertise within the industry whereas Subject Matter Experts are those with at least 15 years of experience behind their back within the same space. The data with the help of two main processes i.e., FGDs (Focused Group Discussions) and IDs (Individual Discussions). This gives us a 3rd party nonbiased primary view of the market scenario making it a more dependable one while collation of the data pointers.
Step 3: Data Bank Validation
Once all the information is collected via primary and secondary sources, we run that information for data validation. At our intelligence centre our research heads track a lot of information related to the market which includes the quarterly reports, the daily stock prices, and other relevant information. Our data bank server gets updated every fortnight and that is how the information which we collected using our primary and secondary information is revalidated in real time.
Step 4: QA/QC Process
After all the data collection and validation our team does a final level of quality check and quality assurance to get rid of any unwanted or undesired mistakes. This might include but not limited to getting rid of the any typos, duplication of numbers or missing of any important information. The people involved in this process include technical content writers, research heads and graphics people. Once this process is completed the title gets uploader on our platform for our clients to read it.
Step 5: Final QC/QA Process:
This is the last process and comes when the client has ordered the study. In this process a final QA/QC is done before the study is emailed to the client. Since we believe in giving our clients a good experience of our research studies, therefore, to make sure that we do not lack at our end in any way humanly possible we do a final round of quality check and then dispatch the study to the client.
Key Segments:
By Type
Fluoroplastic
Silicone rubber
Fiberglass
Ceramic fiber
Mica-based
Others
By Voltage
Low
Medium
High
By Conductor Material
Copper
Aluminum
Nickel-Alloy
Silver-Plated Copper
Tinned Copper
By Application
Energy
Electric Appliances
Industrial Machinery
Aerospace & Defense
Automotive
Others
Request for Segment Customization as per your Business Requirement: Segment Customization Request
Regional Coverage:
North America
US
Canada
Europe
Germany
UK
France
Italy
Spain
Russia
Poland
Rest of Europe
Asia Pacific
China
India
Japan
South Korea
Australia
ASEAN Countries
Rest of Asia Pacific
Middle East & Africa
UAE
Saudi Arabia
Qatar
South Africa
Rest of Middle East & Africa
Latin America
Brazil
Argentina
Mexico
Colombia
Rest of Latin America
Request for Country Level Research Report: Country Level Customization Request
Available Customization
With the given market data, SNS Insider offers customization as per the company’s specific needs. The following customization options are available for the report:
Detailed Volume Analysis
Criss-Cross segment analysis (e.g. Product X Application)
Competitive Product Benchmarking
Geographic Analysis
Additional countries in any of the regions
Customized Data Representation
Detailed analysis and profiling of additional market players