Home Infusion Therapy Market Report Scope & Overview:
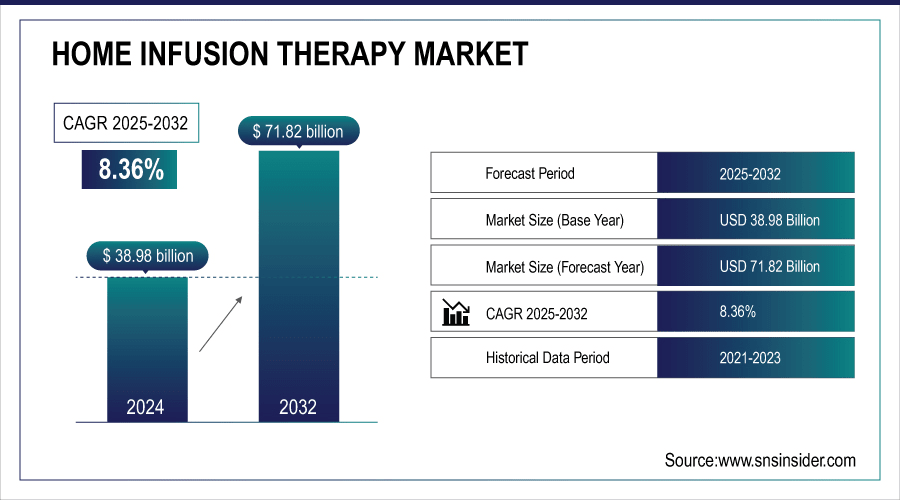
The Home Infusion Therapy Market size was valued at USD 38.98 Billion in 2024 and is expected to reach USD 71.82 Billion by 2032, growing at a CAGR of 8.36% over the forecast period 2025-2032.
The Home Infusion Therapy market is witnessing substantial growth, primarily fueled by the rising prevalence of chronic diseases and an increasing demand for patient-centric healthcare solutions. The Centers for Disease Control and Prevention (CDC) reports that nearly 60% of adults in the United States live with at least one chronic disease, including heart disease, diabetes, and respiratory conditions. This statistic highlights the urgent need for effective home healthcare solutions that empower patients to manage their conditions independently, thereby reducing the frequency of hospital visits and minimizing the associated healthcare costs. Chronic diseases often necessitate long-term treatments that can be cumbersome and challenging for patients to receive in traditional healthcare settings.

Get More Information on Home Infusion Therapy Market - Request Sample Report
Moreover, advancements in technology have significantly contributed to the growth of the Home Infusion Therapy market. Innovations in infusion devices and drug delivery systems, such as smart pumps equipped with monitoring capabilities, have enhanced patient safety and treatment efficacy. These technological improvements have made it easier for healthcare professionals to oversee home infusion therapy remotely, ensuring timely interventions when necessary. For instance, the integration of telehealth services has enabled healthcare providers to conduct virtual consultations, monitor patient conditions, and adjust treatment plans in real-time, further promoting the adoption of home infusion therapy. Government policies and reimbursement structures are also pivotal in shaping the market landscape. The Centers for Medicare & Medicaid Services (CMS) have implemented various initiatives aimed at expanding coverage for home health services, which directly benefits home infusion therapy. Increased reimbursement rates and simplified regulatory requirements have made it more accessible for patients to receive infusion therapies at home. As a result, healthcare providers are more likely to offer these services, knowing that they are supported by favorable reimbursement frameworks.
Home Infusion Therapy Market Highlights
-
Increasing prevalence of chronic diseases such as diabetes, cancer, and cardiovascular disorders is driving strong demand for home infusion therapy services.
-
Technological advancements in infusion devices, including smart pumps with remote monitoring capabilities, are enhancing patient safety and treatment efficacy.
-
Integration of telehealth solutions enables healthcare providers to monitor patients remotely, conduct virtual consultations, and adjust therapy in real-time, promoting adoption.
-
Strict regulatory requirements and inconsistent insurance reimbursement policies can limit market expansion and patient access to home infusion therapy.
-
The aging population is creating substantial growth opportunities for home healthcare services, including infusion therapy.
-
Anti-infective therapy holds a significant market share due to rising prevalence of infectious diseases and antibiotic-resistant infections.
-
North America leads the market with advanced healthcare infrastructure, favorable government policies, and growing elderly population driving increased adoption of home infusion services.
-
Favorable reimbursement frameworks and government initiatives, such as CMS programs, support the expansion and accessibility of home infusion therapy.
Home Infusion Therapy Market Drivers:
-
Increasing Incidence of Chronic Conditions Such as Diabetes, Cancer, And Cardiovascular Diseases Drives the Demand for Home Infusion Therapy
The rising prevalence of chronic diseases, including diabetes, cancer, and cardiovascular disorders, is a key driver of the home infusion therapy market. Globally, chronic conditions account for approximately 71% of all deaths, according to the World Health Organization (WHO), highlighting the urgent need for continuous and effective patient care. Diabetes alone affects over 537 million adults worldwide as of 2023, with the International Diabetes Federation projecting this number to rise to 643 million by 2030. Similarly, cardiovascular diseases remain the leading cause of death globally, responsible for an estimated 18.6 million fatalities annually. Cancer prevalence is also increasing, with the International Agency for Research on Cancer reporting over 19.3 million new cases in 2023.
Home infusion therapy allows for the administration of essential medications such as insulin, chemotherapy agents, and cardiovascular drugs in a home setting, reducing hospital visits and improving patient quality of life. The convenience and personalized care offered by home infusion are particularly beneficial for elderly patients, who often manage multiple chronic conditions simultaneously. In the United States, around 30% of adults aged 65 and older have two or more chronic diseases, which further drives demand for home-based healthcare solutions. As chronic disease prevalence continues to rise, home infusion therapy is poised for sustained growth due to its efficacy, convenience, and ability to optimize healthcare resources.
-
Innovations in Infusion Devices and Drug Delivery Systems Enhance Patient Safety and Comfort, Contributing to The Growth of Home Infusion Therapy Services
Home Infusion Therapy Market Restraints:
-
Strict Regulatory Requirements and Compliance Issues Can Hinder the Adoption and Expansion of Home Infusion Therapy Services, Particularly in Varying Markets.
Strict regulatory requirements and compliance challenges remain significant restraints in the growth of the home infusion therapy market. Different countries and regions impose varying standards for the administration, storage, and monitoring of infusion therapies, making it difficult for providers to maintain uniform practices globally. Compliance with agencies such as the U.S. Food and Drug Administration (FDA), the European Medicines Agency (EMA), and local health authorities requires rigorous documentation, frequent audits, and adherence to strict safety protocols.
Additionally, providers must ensure that all healthcare professionals administering home infusion are appropriately trained and certified, which can increase operational costs and limit rapid scaling. Variations in legal frameworks, such as differing policies on telehealth monitoring, remote patient management, and reimbursement eligibility, further complicate market expansion. Failure to comply with these regulations can result in penalties, legal liabilities, or suspension of services, discouraging smaller providers from entering the market. These regulatory complexities and compliance burdens create operational challenges that slow adoption rates, particularly in emerging markets where infrastructure and oversight may be limited.
-
Inadequate Reimbursement for Home Infusion Therapy from Insurance Providers May Restrict Patient Access and Limit Market Growth.
Home Infusion Therapy Market Opportunities:
-
An Aging Population Increases the Need for Home Healthcare Services, Including Infusion Therapy, Presenting Significant Market Growth Potential.
-
The Integration of Telehealth into Home Healthcare Can Facilitate Better Monitoring and Management of Infusion Therapies, Improving Patient Outcomes and Driving Demand.
Global Home Infusion Therapy Market Segmentation Insights
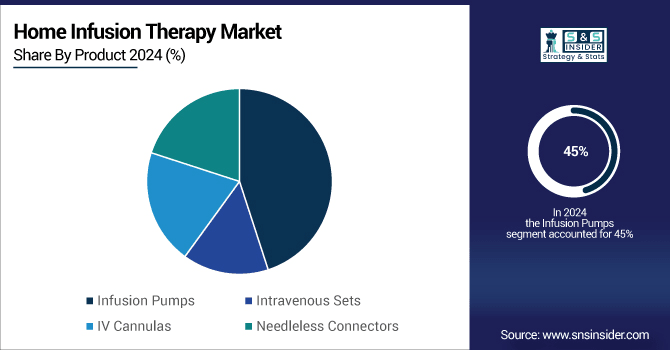
By Product
In the Home Infusion Therapy Market, Infusion Pumps held a substantial market share of 45% in 2024. Infusion pumps are critical in delivering precise amounts of medication and nutrients to patients, ensuring accurate dosing and reducing the risk of errors. The demand for advanced infusion pumps has surged due to their ability to improve patient outcomes and enhance safety in home healthcare settings. A report by the FDA indicated that the use of infusion pumps has been associated with a 50% reduction in medication administration errors, driving their adoption among healthcare providers and patients alike. Furthermore, advancements in technology, such as the integration of smart infusion systems and remote monitoring capabilities, have positioned infusion pumps as the preferred choice for home infusion therapy, contributing to their dominance in the market.
By Application
Anti-infective therapy accounted for 35% of the market share in 2024. The high prevalence of infectious diseases, coupled with the rising incidence of antibiotic-resistant infections, has driven the demand for effective anti-infective treatments delivered in a home setting. According to the World Health Organization (WHO), antimicrobial resistance (AMR) is a growing global health threat, causing an estimated 700,000 deaths annually, with projections suggesting that this number could rise to 10 million by 2050 if not addressed. This alarming statistic highlights the urgent need for effective anti-infective therapies, further stimulating market growth. Home infusion allows for continuous and consistent delivery of these therapies, reducing hospital stays and improving patient quality of life, which is crucial in managing infections.
Home Infusion Therapy Market Regional Outlook
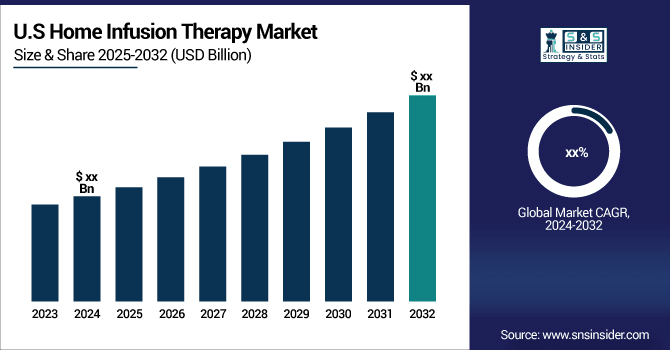
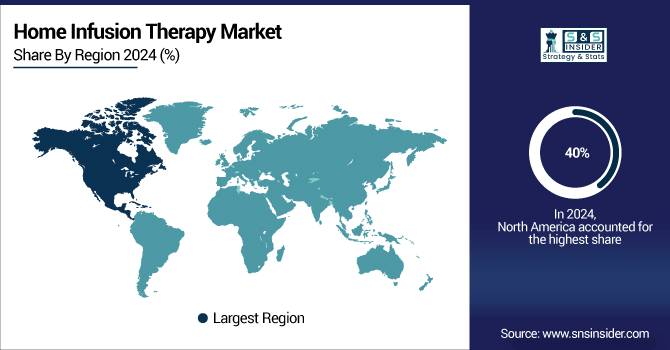
North America Leads Home Infusion Therapy Market
In 2024, North America was the dominant region in the home infusion therapy market, holding a market share of approximately 40%. This dominance can be attributed to several factors, including advanced healthcare infrastructure, a high prevalence of chronic diseases, and a rapidly growing elderly population in the region. According to the U.S. Census Bureau, the population aged 65 and older is projected to reach about 95 million by 2060, nearly doubling from 52 million in 2021. This demographic shift is expected to significantly increase the demand for home healthcare services, including home infusion therapy. Recent statistics from the National Center for Health Statistics indicate that approximately 30% of older adults in the U.S. manage two or more chronic conditions, further driving the need for effective home healthcare solutions. Additionally, favorable reimbursement policies and government initiatives, such as those from the Centers for Medicare & Medicaid Services (CMS), have expanded coverage for home health services, allowing more patients to access home infusion therapy.
-
In 2023, CMS reported that home health expenditures reached USD 100 billion, reflecting a 15% increase compared to the previous year. This trend reinforces North America’s position as a leader in the home infusion therapy market, with significant growth potential in the coming years.

Need any customization research on Home Infusion Therapy Market - Enquiry Now
Home Infusion Therapy Market Key Players
-
CVS/Coram
-
Option Care Health
-
BriovaRx/Diplomat (UnitedHealth Optum)
-
PharMerica
-
Fresenius Kabi
-
ICU Medical, Inc.
-
B. Braun Melsungen AG
-
BD (Becton, Dickinson, and Company)
-
Caesarea Medical Electronics
-
Smith’s Medical
-
JMS Co. Ltd.
-
Medtronic
-
Halyard Health (now part of Owens & Minor)
-
Zyno Medical
-
Alaris Medical Systems (part of BD)
-
Calea
-
Nipro Medical Corporation
-
HMC (Health Management Corporation)
-
Pall Corporation
Home Infusion Therapy Market Competitive Landscape
Baxter International Inc., headquartered in Deerfield, Illinois, is a global healthcare company specializing in medical technologies and therapies for complex and chronic conditions. Founded in 1931, Baxter pioneered intravenous (IV) solutions and has since expanded into renal care, infusion therapies, anesthesia, and surgical products. In 2023, the company reported global net sales of $14.8 billion, operating across Medical Products and Therapies, Healthcare Systems and Technologies, and Pharmaceuticals. Baxter has strengthened its portfolio through acquisitions like Gambro and Hill-Rom, while focusing on core medical technologies after divesting its biopharma solutions business. Its mission is to save and sustain lives worldwide.
-
In June 2023, an American healthcare company, Baxter International announced the Progressa+ Next Gen ICU bed that is designed to meet the emergency needs of patients at their homes. This technology facilitates the task performance of nurses at the same time promotes therapy at home.
Fresenius Kabi, a subsidiary of Fresenius SE & Co. KGaA, is a global healthcare company headquartered in Bad Homburg, Germany, specializing in lifesaving medicines and technologies for infusion, transfusion, and clinical nutrition. Established in 1999, the company focuses on providing intravenous drugs, infusion therapies, and medical devices to hospitals and healthcare providers worldwide. In 2023, Fresenius Kabi reported revenues exceeding €9 billion, driven by strong demand for critical care and oncology therapies. The company emphasizes innovation, quality, and patient safety, while expanding its global footprint through strategic investments and partnerships to enhance healthcare access in emerging and developed markets.
-
In May 2023, Fresenius Kabi, a global healthcare firm, established an agreement with Premier, Inc., an American healthcare company that resulted in the capability to offer pricing and term stipulations for the Ivenix Infusion System.
Report Attributes | Details |
---|---|
Market Size in 2024 | US$ 38.98 Billion |
Market Size by 2032 | US$ 71.82 Billion |
CAGR | CAGR of 8.36% From 2025 to 2032 |
Base Year | 2024 |
Forecast Period | 2025-2032 |
Historical Data | 2021-2023 |
Report Scope & Coverage | Market Size, Segments Analysis, Competitive Landscape, Regional Analysis, DROC & SWOT Analysis, Forecast Outlook |
Key Segments | •By Product (Infusion Pumps, Intravenous Sets, IV Cannulas, Needleless Connectors), •By Application (Anti-Infective, Endocrinology, Chemotherapy, Enteral Nutrition, Parenteral Nutrition, Others) •By Route of Administration (Intramuscular, Subcutaneously, Epidural) |
Regional Analysis/Coverage | North America (US, Canada, Mexico), Europe (Eastern Europe [Poland, Romania, Hungary, Turkey, Rest of Eastern Europe] Western Europe] Germany, France, UK, Italy, Spain, Netherlands, Switzerland, Austria, Rest of Western Europe]), Asia Pacific (China, India, Japan, South Korea, Vietnam, Singapore, Australia, Rest of Asia Pacific), Middle East & Africa (Middle East [UAE, Egypt, Saudi Arabia, Qatar, Rest of Middle East], Africa [Nigeria, South Africa, Rest of Africa], Latin America (Brazil, Argentina, Colombia, Rest of Latin America) |
Company Profiles | CVS/Coram, Option Care Health, BriovaRx/Diplomat (UnitedHealth Optum), PharMerica, Fresenius Kabi, ICU Medical, Inc., B. Braun Melsungen AG, Baxter, BD, Caesarea Medical Electronics, Smiths Medical, and Terumo Corporation, as well as JMS Co. Ltd. |
Table of Contents
1. Introduction
1.1 Market Definition
1.2 Scope (Inclusion and Exclusions)
1.3 Research Assumptions
2. Executive Summary
2.1 Market Overview
2.2 Regional Synopsis
2.3 Competitive Summary
3. Research Methodology
3.1 Top-Down Approach
3.2 Bottom-up Approach
3.3. Data Validation
3.4 Primary Interviews
4. Market Dynamics Impact Analysis
4.1 Market Driving Factors Analysis
4.1.1 Drivers
4.1.2 Restraints
4.1.3 Opportunities
4.1.4 Challenges
4.2 PESTLE Analysis
4.3 Porter’s Five Forces Model
5. Statistical Insights and Trends Reporting
5.1 Incidence and Prevalence (2023)
5.2 Prescription Trends, (2023), by Region
5.3 Drugs Volume: Device usage volume
5.4 Healthcare Spending: Expenditure data by government, insurers, and out-of-pocket by patients
6. Competitive Landscape
6.1 List of Major Companies, By Region
6.2 Market Share Analysis, By Region
6.3 Product Benchmarking
6.3.1 Product specifications and features
6.3.2 Pricing
6.4 Strategic Initiatives
6.4.1 Marketing and promotional activities
6.4.2 Distribution and Supply Chain Strategies
6.4.3 Expansion plans and new Product launches
6.4.4 Strategic partnerships and collaborations
6.5 Technological Advancements
6.6 Market Positioning and Branding
7. Home Infusion Therapy Market Segmentation, by Product
7.1 Chapter Overview
7.2 Infusion Pumps
7.2.1 Infusion Pumps Market Trends Analysis (2020-2032)
7.2.2 Infusion Pumps Market Size Estimates and Forecasts to 2032 (USD Billion)
7.3 Intravenous Sets
7.3.1 Intravenous Sets Market Trends Analysis (2020-2032)
7.3.2 Intravenous Sets Market Size Estimates and Forecasts to 2032 (USD Billion)
7.4 IV Cannulas
7.4.1 IV Cannulas Market Trends Analysis (2020-2032)
7.4.2 IV Cannulas Market Size Estimates and Forecasts to 2032 (USD Billion)
7.5 Needleless Connectors
7.5.1 Needleless Connectors Market Trends Analysis (2020-2032)
7.5.2 Needleless Connectors Market Size Estimates and Forecasts to 2032 (USD Billion)
8. Home Infusion Therapy Market Segmentation, by Application
8.1 Chapter Overview
8.2 Anti-Infective
8.2.1 Anti-Infective Market Trends Analysis (2020-2032)
8.2.2 Anti-Infective Market Size Estimates and Forecasts to 2032 (USD Billion)
8.3 Endocrinology
8.3.1 Endocrinology Market Trends Analysis (2020-2032)
8.3.2 Endocrinology Market Size Estimates and Forecasts to 2032 (USD Billion)
8.4 Chemotherapy
8.4.1 Chemotherapy Market Trends Analysis (2020-2032)
8.4.2 Chemotherapy Market Size Estimates and Forecasts to 2032 (USD Billion)
8.5 Enteral Nutrition
8.5.1 Enteral Nutrition Market Trends Analysis (2020-2032)
8.5.2 Enteral Nutrition Market Size Estimates and Forecasts to 2032 (USD Billion)
8.6 Parenteral Nutrition
8.6.1 Parenteral Nutrition Market Trends Analysis (2020-2032)
8.6.2 Parenteral Nutrition Market Size Estimates and Forecasts to 2032 (USD Billion)
8.7 Others
8.7.1 Others Market Trends Analysis (2020-2032)
8.7.2 Others Market Size Estimates and Forecasts to 2032 (USD Billion)
9. Home Infusion Therapy Market Segmentation, by Route of Administration
9.1 Chapter Overview
9.2 Intramuscular
9.2.1 Intramuscular Market Trends Analysis (2020-2032)
9.2.2 Intramuscular Market Size Estimates and Forecasts to 2032 (USD Billion)
9.3 Subcutaneously
9.3.1 Subcutaneously Market Trends Analysis (2020-2032)
9.3.2 Subcutaneously Market Size Estimates and Forecasts to 2032 (USD Billion)
9.4 Epidural
9.4.1 Epidural Market Trends Analysis (2020-2032)
9.4.2 Epidural Market Size Estimates and Forecasts to 2032 (USD Billion)
10. Regional Analysis
10.1 Chapter Overview
10.2 North America
10.2.1 Trends Analysis
10.2.2 North America Home Infusion Therapy Market Estimates and Forecasts, by Country (2020-2032) (USD Billion)
10.2.3 North America Home Infusion Therapy Market Estimates and Forecasts, by Product (2020-2032) (USD Billion)
10.2.4 North America Home Infusion Therapy Market Estimates and Forecasts, by Application (2020-2032) (USD Billion)
10.2.5 North America Home Infusion Therapy Market Estimates and Forecasts, by Route of Administration (2020-2032) (USD Billion)
10.2.6 USA
10.2.6.1 USA Home Infusion Therapy Market Estimates and Forecasts, by Product (2020-2032) (USD Billion)
10.2.6.2 USA Home Infusion Therapy Market Estimates and Forecasts, by Application (2020-2032) (USD Billion)
10.2.6.3 USA Home Infusion Therapy Market Estimates and Forecasts, by Route of Administration (2020-2032) (USD Billion)
10.2.7 Canada
10.2.7.1 Canada Home Infusion Therapy Market Estimates and Forecasts, by Product (2020-2032) (USD Billion)
10.2.7.2 Canada Home Infusion Therapy Market Estimates and Forecasts, by Application (2020-2032) (USD Billion)
10.2.7.3 Canada Home Infusion Therapy Market Estimates and Forecasts, by Route of Administration (2020-2032) (USD Billion)
10.2.8 Mexico
10.2.8.1 Mexico Home Infusion Therapy Market Estimates and Forecasts, by Product (2020-2032) (USD Billion)
10.2.8.2 Mexico Home Infusion Therapy Market Estimates and Forecasts, by Application (2020-2032) (USD Billion)
10.2.8.3 Mexico Home Infusion Therapy Market Estimates and Forecasts, by Route of Administration (2020-2032) (USD Billion)
10.3 Europe
10.3.1 Eastern Europe
10.3.1.1 Trends Analysis
10.3.1.2 Eastern Europe Home Infusion Therapy Market Estimates and Forecasts, by Country (2020-2032) (USD Billion)
10.3.1.3 Eastern Europe Home Infusion Therapy Market Estimates and Forecasts, by Product (2020-2032) (USD Billion)
10.3.1.4 Eastern Europe Home Infusion Therapy Market Estimates and Forecasts, by Application (2020-2032) (USD Billion)
10.3.1.5 Eastern Europe Home Infusion Therapy Market Estimates and Forecasts, by Route of Administration (2020-2032) (USD Billion)
10.3.1.6 Poland
10.3.1.6.1 Poland Home Infusion Therapy Market Estimates and Forecasts, by Product (2020-2032) (USD Billion)
10.3.1.6.2 Poland Home Infusion Therapy Market Estimates and Forecasts, by Application (2020-2032) (USD Billion)
10.3.1.6.3 Poland Home Infusion Therapy Market Estimates and Forecasts, by Route of Administration (2020-2032) (USD Billion)
10.3.1.7 Romania
10.3.1.7.1 Romania Home Infusion Therapy Market Estimates and Forecasts, by Product (2020-2032) (USD Billion)
10.3.1.7.2 Romania Home Infusion Therapy Market Estimates and Forecasts, by Application (2020-2032) (USD Billion)
10.3.1.7.3 Romania Home Infusion Therapy Market Estimates and Forecasts, by Route of Administration (2020-2032) (USD Billion)
10.3.1.8 Hungary
10.3.1.8.1 Hungary Home Infusion Therapy Market Estimates and Forecasts, by Product (2020-2032) (USD Billion)
10.3.1.8.2 Hungary Home Infusion Therapy Market Estimates and Forecasts, by Application (2020-2032) (USD Billion)
10.3.1.8.3 Hungary Home Infusion Therapy Market Estimates and Forecasts, by Route of Administration (2020-2032) (USD Billion)
10.3.1.9 Turkey
10.3.1.9.1 Turkey Home Infusion Therapy Market Estimates and Forecasts, by Product (2020-2032) (USD Billion)
10.3.1.9.2 Turkey Home Infusion Therapy Market Estimates and Forecasts, by Application (2020-2032) (USD Billion)
10.3.1.9.3 Turkey Home Infusion Therapy Market Estimates and Forecasts, by Route of Administration (2020-2032) (USD Billion)
10.3.1.10 Rest of Eastern Europe
10.3.1.10.1 Rest of Eastern Europe Home Infusion Therapy Market Estimates and Forecasts, by Product (2020-2032) (USD Billion)
10.3.1.10.2 Rest of Eastern Europe Home Infusion Therapy Market Estimates and Forecasts, by Application (2020-2032) (USD Billion)
10.3.1.10.3 Rest of Eastern Europe Home Infusion Therapy Market Estimates and Forecasts, by Route of Administration (2020-2032) (USD Billion)
10.3.2 Western Europe
10.3.2.1 Trends Analysis
10.3.2.2 Western Europe Home Infusion Therapy Market Estimates and Forecasts, by Country (2020-2032) (USD Billion)
10.3.2.3 Western Europe Home Infusion Therapy Market Estimates and Forecasts, by Product (2020-2032) (USD Billion)
10.3.2.4 Western Europe Home Infusion Therapy Market Estimates and Forecasts, by Application (2020-2032) (USD Billion)
10.3.2.5 Western Europe Home Infusion Therapy Market Estimates and Forecasts, by Route of Administration (2020-2032) (USD Billion)
10.3.2.6 Germany
10.3.2.6.1 Germany Home Infusion Therapy Market Estimates and Forecasts, by Product (2020-2032) (USD Billion)
10.3.2.6.2 Germany Home Infusion Therapy Market Estimates and Forecasts, by Application (2020-2032) (USD Billion)
10.3.2.6.3 Germany Home Infusion Therapy Market Estimates and Forecasts, by Route of Administration (2020-2032) (USD Billion)
10.3.2.7 France
10.3.2.7.1 France Home Infusion Therapy Market Estimates and Forecasts, by Product (2020-2032) (USD Billion)
10.3.2.7.2 France Home Infusion Therapy Market Estimates and Forecasts, by Application (2020-2032) (USD Billion)
10.3.2.7.3 France Home Infusion Therapy Market Estimates and Forecasts, by Route of Administration (2020-2032) (USD Billion)
10.3.2.8 UK
10.3.2.8.1 UK Home Infusion Therapy Market Estimates and Forecasts, by Product (2020-2032) (USD Billion)
10.3.2.8.2 UK Home Infusion Therapy Market Estimates and Forecasts, by Application (2020-2032) (USD Billion)
10.3.2.8.3 UK Home Infusion Therapy Market Estimates and Forecasts, by Route of Administration (2020-2032) (USD Billion)
10.3.2.9 Italy
10.3.2.9.1 Italy Home Infusion Therapy Market Estimates and Forecasts, by Product (2020-2032) (USD Billion)
10.3.2.9.2 Italy Home Infusion Therapy Market Estimates and Forecasts, by Application (2020-2032) (USD Billion)
10.3.2.9.3 Italy Home Infusion Therapy Market Estimates and Forecasts, by Route of Administration (2020-2032) (USD Billion)
10.3.2.10 Spain
10.3.2.10.1 Spain Home Infusion Therapy Market Estimates and Forecasts, by Product (2020-2032) (USD Billion)
10.3.2.10.2 Spain Home Infusion Therapy Market Estimates and Forecasts, by Application (2020-2032) (USD Billion)
10.3.2.10.3 Spain Home Infusion Therapy Market Estimates and Forecasts, by Route of Administration (2020-2032) (USD Billion)
10.3.2.11 Netherlands
10.3.2.11.1 Netherlands Home Infusion Therapy Market Estimates and Forecasts, by Product (2020-2032) (USD Billion)
10.3.2.11.2 Netherlands Home Infusion Therapy Market Estimates and Forecasts, by Application (2020-2032) (USD Billion)
10.3.2.11.3 Netherlands Home Infusion Therapy Market Estimates and Forecasts, by Route of Administration (2020-2032) (USD Billion)
10.3.2.12 Switzerland
10.3.2.12.1 Switzerland Home Infusion Therapy Market Estimates and Forecasts, by Product (2020-2032) (USD Billion)
10.3.2.12.2 Switzerland Home Infusion Therapy Market Estimates and Forecasts, by Application (2020-2032) (USD Billion)
10.3.2.12.3 Switzerland Home Infusion Therapy Market Estimates and Forecasts, by Route of Administration (2020-2032) (USD Billion)
10.3.2.13 Austria
10.3.2.13.1 Austria Home Infusion Therapy Market Estimates and Forecasts, by Product (2020-2032) (USD Billion)
10.3.2.13.2 Austria Home Infusion Therapy Market Estimates and Forecasts, by Application (2020-2032) (USD Billion)
10.3.2.13.3 Austria Home Infusion Therapy Market Estimates and Forecasts, by Route of Administration (2020-2032) (USD Billion)
10.3.2.14 Rest of Western Europe
10.3.2.14.1 Rest of Western Europe Home Infusion Therapy Market Estimates and Forecasts, by Product (2020-2032) (USD Billion)
10.3.2.14.2 Rest of Western Europe Home Infusion Therapy Market Estimates and Forecasts, by Application (2020-2032) (USD Billion)
10.3.2.14.3 Rest of Western Europe Home Infusion Therapy Market Estimates and Forecasts, by Route of Administration (2020-2032) (USD Billion)
10.4 Asia Pacific
10.4.1 Trends Analysis
10.4.2 Asia Pacific Home Infusion Therapy Market Estimates and Forecasts, by Country (2020-2032) (USD Billion)
10.4.3 Asia Pacific Home Infusion Therapy Market Estimates and Forecasts, by Product (2020-2032) (USD Billion)
10.4.4 Asia Pacific Home Infusion Therapy Market Estimates and Forecasts, by Application (2020-2032) (USD Billion)
10.4.5 Asia Pacific Home Infusion Therapy Market Estimates and Forecasts, by Route of Administration (2020-2032) (USD Billion)
10.4.6 China
10.4.6.1 China Home Infusion Therapy Market Estimates and Forecasts, by Product (2020-2032) (USD Billion)
10.4.6.2 China Home Infusion Therapy Market Estimates and Forecasts, by Application (2020-2032) (USD Billion)
10.4.6.3 China Home Infusion Therapy Market Estimates and Forecasts, by Route of Administration (2020-2032) (USD Billion)
10.4.7 India
10.4.7.1 India Home Infusion Therapy Market Estimates and Forecasts, by Product (2020-2032) (USD Billion)
10.4.7.2 India Home Infusion Therapy Market Estimates and Forecasts, by Application (2020-2032) (USD Billion)
10.4.7.3 India Home Infusion Therapy Market Estimates and Forecasts, by Route of Administration (2020-2032) (USD Billion)
10.4.8 Japan
10.4.8.1 Japan Home Infusion Therapy Market Estimates and Forecasts, by Product (2020-2032) (USD Billion)
10.4.8.2 Japan Home Infusion Therapy Market Estimates and Forecasts, by Application (2020-2032) (USD Billion)
10.4.8.3 Japan Home Infusion Therapy Market Estimates and Forecasts, by Route of Administration (2020-2032) (USD Billion)
10.4.9 South Korea
10.4.9.1 South Korea Home Infusion Therapy Market Estimates and Forecasts, by Product (2020-2032) (USD Billion)
10.4.9.2 South Korea Home Infusion Therapy Market Estimates and Forecasts, by Application (2020-2032) (USD Billion)
10.4.9.3 South Korea Home Infusion Therapy Market Estimates and Forecasts, by Route of Administration (2020-2032) (USD Billion)
10.4.10 Vietnam
10.4.10.1 Vietnam Home Infusion Therapy Market Estimates and Forecasts, by Product (2020-2032) (USD Billion)
10.4.10.2 Vietnam Home Infusion Therapy Market Estimates and Forecasts, by Application (2020-2032) (USD Billion)
10.4.10.3 Vietnam Home Infusion Therapy Market Estimates and Forecasts, by Route of Administration (2020-2032) (USD Billion)
10.4.11 Singapore
10.4.11.1 Singapore Home Infusion Therapy Market Estimates and Forecasts, by Product (2020-2032) (USD Billion)
10.4.11.2 Singapore Home Infusion Therapy Market Estimates and Forecasts, by Application (2020-2032) (USD Billion)
10.4.11.3 Singapore Home Infusion Therapy Market Estimates and Forecasts, by Route of Administration (2020-2032) (USD Billion)
10.4.12 Australia
10.4.12.1 Australia Home Infusion Therapy Market Estimates and Forecasts, by Product (2020-2032) (USD Billion)
10.4.12.2 Australia Home Infusion Therapy Market Estimates and Forecasts, by Application (2020-2032) (USD Billion)
10.4.12.3 Australia Home Infusion Therapy Market Estimates and Forecasts, by Route of Administration (2020-2032) (USD Billion)
10.4.13 Rest of Asia Pacific
10.4.13.1 Rest of Asia Pacific Home Infusion Therapy Market Estimates and Forecasts, by Product (2020-2032) (USD Billion)
10.4.13.2 Rest of Asia Pacific Home Infusion Therapy Market Estimates and Forecasts, by Application (2020-2032) (USD Billion)
10.4.13.3 Rest of Asia Pacific Home Infusion Therapy Market Estimates and Forecasts, by Route of Administration (2020-2032) (USD Billion)
10.5 Middle East and Africa
10.5.1 Middle East
10.5.1.1 Trends Analysis
10.5.1.2 Middle East Home Infusion Therapy Market Estimates and Forecasts, by Country (2020-2032) (USD Billion)
10.5.1.3 Middle East Home Infusion Therapy Market Estimates and Forecasts, by Product (2020-2032) (USD Billion)
10.5.1.4 Middle East Home Infusion Therapy Market Estimates and Forecasts, by Application (2020-2032) (USD Billion)
10.5.1.5 Middle East Home Infusion Therapy Market Estimates and Forecasts, by Route of Administration (2020-2032) (USD Billion)
10.5.1.6 UAE
10.5.1.6.1 UAE Home Infusion Therapy Market Estimates and Forecasts, by Product (2020-2032) (USD Billion)
10.5.1.6.2 UAE Home Infusion Therapy Market Estimates and Forecasts, by Application (2020-2032) (USD Billion)
10.5.1.6.3 UAE Home Infusion Therapy Market Estimates and Forecasts, by Route of Administration (2020-2032) (USD Billion)
10.5.1.7 Egypt
10.5.1.7.1 Egypt Home Infusion Therapy Market Estimates and Forecasts, by Product (2020-2032) (USD Billion)
10.5.1.7.2 Egypt Home Infusion Therapy Market Estimates and Forecasts, by Application (2020-2032) (USD Billion)
10.5.1.7.3 Egypt Home Infusion Therapy Market Estimates and Forecasts, by Route of Administration (2020-2032) (USD Billion)
10.5.1.8 Saudi Arabia
10.5.1.8.1 Saudi Arabia Home Infusion Therapy Market Estimates and Forecasts, by Product (2020-2032) (USD Billion)
10.5.1.8.2 Saudi Arabia Home Infusion Therapy Market Estimates and Forecasts, by Application (2020-2032) (USD Billion)
10.5.1.8.3 Saudi Arabia Home Infusion Therapy Market Estimates and Forecasts, by Route of Administration (2020-2032) (USD Billion)
10.5.1.9 Qatar
10.5.1.9.1 Qatar Home Infusion Therapy Market Estimates and Forecasts, by Product (2020-2032) (USD Billion)
10.5.1.9.2 Qatar Home Infusion Therapy Market Estimates and Forecasts, by Application (2020-2032) (USD Billion)
10.5.1.9.3 Qatar Home Infusion Therapy Market Estimates and Forecasts, by Route of Administration (2020-2032) (USD Billion)
10.5.1.10 Rest of Middle East
10.5.1.10.1 Rest of Middle East Home Infusion Therapy Market Estimates and Forecasts, by Product (2020-2032) (USD Billion)
10.5.1.10.2 Rest of Middle East Home Infusion Therapy Market Estimates and Forecasts, by Application (2020-2032) (USD Billion)
10.5.1.10.3 Rest of Middle East Home Infusion Therapy Market Estimates and Forecasts, by Route of Administration (2020-2032) (USD Billion)
10.5.2 Africa
10.5.2.1 Trends Analysis
10.5.2.2 Africa Home Infusion Therapy Market Estimates and Forecasts, by Country (2020-2032) (USD Billion)
10.5.2.3 Africa Home Infusion Therapy Market Estimates and Forecasts, by Product (2020-2032) (USD Billion)
10.5.2.4 Africa Home Infusion Therapy Market Estimates and Forecasts, by Application (2020-2032) (USD Billion)
10.5.2.5 Africa Home Infusion Therapy Market Estimates and Forecasts, by Route of Administration (2020-2032) (USD Billion)
10.5.2.6 South Africa
10.5.2.6.1 South Africa Home Infusion Therapy Market Estimates and Forecasts, by Product (2020-2032) (USD Billion)
10.5.2.6.2 South Africa Home Infusion Therapy Market Estimates and Forecasts, by Application (2020-2032) (USD Billion)
10.5.2.6.3 South Africa Home Infusion Therapy Market Estimates and Forecasts, by Route of Administration (2020-2032) (USD Billion)
10.5.2.7 Nigeria
10.5.2.7.1 Nigeria Home Infusion Therapy Market Estimates and Forecasts, by Product (2020-2032) (USD Billion)
10.5.2.7.2 Nigeria Home Infusion Therapy Market Estimates and Forecasts, by Application (2020-2032) (USD Billion)
10.5.2.7.3 Nigeria Home Infusion Therapy Market Estimates and Forecasts, by Route of Administration (2020-2032) (USD Billion)
10.5.2.8 Rest of Africa
10.5.2.8.1 Rest of Africa Home Infusion Therapy Market Estimates and Forecasts, by Product (2020-2032) (USD Billion)
10.5.2.8.2 Rest of Africa Home Infusion Therapy Market Estimates and Forecasts, by Application (2020-2032) (USD Billion)
10.5.2.8.3 Rest of Africa Home Infusion Therapy Market Estimates and Forecasts, by Route of Administration (2020-2032) (USD Billion)
10.6 Latin America
10.6.1 Trends Analysis
10.6.2 Latin America Home Infusion Therapy Market Estimates and Forecasts, by Country (2020-2032) (USD Billion)
10.6.3 Latin America Home Infusion Therapy Market Estimates and Forecasts, by Product (2020-2032) (USD Billion)
10.6.4 Latin America Home Infusion Therapy Market Estimates and Forecasts, by Application (2020-2032) (USD Billion)
10.6.5 Latin America Home Infusion Therapy Market Estimates and Forecasts, by Route of Administration (2020-2032) (USD Billion)
10.6.6 Brazil
10.6.6.1 Brazil Home Infusion Therapy Market Estimates and Forecasts, by Product (2020-2032) (USD Billion)
10.6.6.2 Brazil Home Infusion Therapy Market Estimates and Forecasts, by Application (2020-2032) (USD Billion)
10.6.6.3 Brazil Home Infusion Therapy Market Estimates and Forecasts, by Route of Administration (2020-2032) (USD Billion)
10.6.7 Argentina
10.6.7.1 Argentina Home Infusion Therapy Market Estimates and Forecasts, by Product (2020-2032) (USD Billion)
10.6.7.2 Argentina Home Infusion Therapy Market Estimates and Forecasts, by Application (2020-2032) (USD Billion)
10.6.7.3 Argentina Home Infusion Therapy Market Estimates and Forecasts, by Route of Administration (2020-2032) (USD Billion)
10.6.8 Colombia
10.6.8.1 Colombia Home Infusion Therapy Market Estimates and Forecasts, by Product (2020-2032) (USD Billion)
10.6.8.2 Colombia Home Infusion Therapy Market Estimates and Forecasts, by Application (2020-2032) (USD Billion)
10.6.8.3 Colombia Home Infusion Therapy Market Estimates and Forecasts, by Route of Administration (2020-2032) (USD Billion)
10.6.9 Rest of Latin America
10.6.9.1 Rest of Latin America Home Infusion Therapy Market Estimates and Forecasts, by Product (2020-2032) (USD Billion)
10.6.9.2 Rest of Latin America Home Infusion Therapy Market Estimates and Forecasts, by Application (2020-2032) (USD Billion)
10.6.9.3 Rest of Latin America Home Infusion Therapy Market Estimates and Forecasts, by Route of Administration (2020-2032) (USD Billion)
11. Company Profiles
11.1 CVS/Coram
11.1.1 Company Overview
11.1.2 Financial
11.1.3 Product / Services Offered
11.1.4 SWOT Analysis
11.2 Option Care Health
11.2.1 Company Overview
11.2.2 Financial
11.2.3 Product / Services Offered
11.2.4 SWOT Analysis
11.3 BriovaRx/Diplomat (UnitedHealth Optum)
11.3.1 Company Overview
11.3.2 Financial
11.3.3 Product / Services Offered
11.3.4 SWOT Analysis
11.4 PharMerica
11.4.1 Company Overview
11.4.2 Financial
11.4.3 Product / Services Offered
11.4.4 SWOT Analysis
11.5 Fresenius Kabi
11.5.1 Company Overview
11.5.2 Financial
11.5.3 Product / Services Offered
11.5.4 SWOT Analysis
11.6 ICU Medical, Inc.
11.6.1 Company Overview
11.6.2 Financial
11.6.3 Product / Services Offered
11.6.4 SWOT Analysis
11.7 B. Braun Melsungen AG
11.7.1 Company Overview
11.7.2 Financial
11.7.3 Product / Services Offered
11.7.4 SWOT Analysis
11.8 Baxter
11.8.1 Company Overview
11.8.2 Financial
11.8.3 Product / Services Offered
11.8.4 SWOT Analysis
11.9 BD
11.9.1 Company Overview
11.9.2 Financial
11.9.3 Product / Services Offered
11.9.4 SWOT Analysis
11.10 Caesarea Medical Electronics
11.10.1 Company Overview
11.10.2 Financial
11.10.3 Product / Services Offered
11.10.4 SWOT Analysis
12. Use Cases and Best Practices
13. Conclusion
Key Market Segments
By Product
-
Infusion Pumps
-
Intravenous Sets
-
IV Cannulas
-
Needleless Connectors
By Application
-
Anti-Infective
-
Endocrinology
-
Chemotherapy
-
Enteral Nutrition
-
Parenteral Nutrition
-
Others
By Route of Administration
-
Intramuscular
-
Subcutaneously
-
Epidural
Request for Segment Customization as per your Business Requirement: Segment Customization Request
Regional Coverage:
North America
-
US
-
Canada
-
Mexico
Europe
-
Eastern Europe
-
Poland
-
Romania
-
Hungary
-
Turkey
-
Rest of Eastern Europe
-
-
Western Europe
-
Germany
-
France
-
UK
-
Italy
-
Spain
-
Netherlands
-
Switzerland
-
Austria
-
Rest of Western Europe
-
Asia Pacific
-
China
-
India
-
Japan
-
South Korea
-
Vietnam
-
Singapore
-
Australia
-
Rest of Asia Pacific
Middle East & Africa
-
Middle East
-
UAE
-
Egypt
-
Saudi Arabia
-
Qatar
-
Rest of the Middle East
-
-
Africa
-
Nigeria
-
South Africa
-
Rest of Africa
-
Latin America
-
Brazil
-
Argentina
-
Colombia
-
Rest of Latin America
Request for Country Level Research Report: Country Level Customization Request
Available Customization
-
With the given market data, SNS Insider offers customization as per the company’s specific needs. The following customization options are available for the report:
-
Product Analysis
-
Criss-Cross segment analysis (e.g. Product X Application)
-
Product Matrix which gives a detailed comparison of the product portfolio of each company
-
Geographic Analysis
-
Additional countries in any of the regions
-
Company Information
-
Detailed analysis and profiling of additional market players (Up to five)
An accurate research report requires proper strategizing as well as implementation. There are multiple factors involved in the completion of good and accurate research report and selecting the best methodology to compete the research is the toughest part. Since the research reports we provide play a crucial role in any company’s decision-making process, therefore we at SNS Insider always believe that we should choose the best method which gives us results closer to reality. This allows us to reach at a stage wherein we can provide our clients best and accurate investment to output ratio.
Each report that we prepare takes a timeframe of 350-400 business hours for production. Starting from the selection of titles through a couple of in-depth brain storming session to the final QC process before uploading our titles on our website we dedicate around 350 working hours. The titles are selected based on their current market cap and the foreseen CAGR and growth.
The 5 steps process:
Step 1: Secondary Research:
Secondary Research or Desk Research is as the name suggests is a research process wherein, we collect data through the readily available information. In this process we use various paid and unpaid databases which our team has access to and gather data through the same. This includes examining of listed companies’ annual reports, Journals, SEC filling etc. Apart from this our team has access to various associations across the globe across different industries. Lastly, we have exchange relationships with various university as well as individual libraries.

Step 2: Primary Research
When we talk about primary research, it is a type of study in which the researchers collect relevant data samples directly, rather than relying on previously collected data. This type of research is focused on gaining content specific facts that can be sued to solve specific problems. Since the collected data is fresh and first hand therefore it makes the study more accurate and genuine.
We at SNS Insider have divided Primary Research into 2 parts.
Part 1 wherein we interview the KOLs of major players as well as the upcoming ones across various geographic regions. This allows us to have their view over the market scenario and acts as an important tool to come closer to the accurate market numbers. As many as 45 paid and unpaid primary interviews are taken from both the demand and supply side of the industry to make sure we land at an accurate judgement and analysis of the market.
This step involves the triangulation of data wherein our team analyses the interview transcripts, online survey responses and observation of on filed participants. The below mentioned chart should give a better understanding of the part 1 of the primary interview.

Part 2: In this part of primary research the data collected via secondary research and the part 1 of the primary research is validated with the interviews from individual consultants and subject matter experts.
Consultants are those set of people who have at least 12 years of experience and expertise within the industry whereas Subject Matter Experts are those with at least 15 years of experience behind their back within the same space. The data with the help of two main processes i.e., FGDs (Focused Group Discussions) and IDs (Individual Discussions). This gives us a 3rd party nonbiased primary view of the market scenario making it a more dependable one while collation of the data pointers.
Step 3: Data Bank Validation
Once all the information is collected via primary and secondary sources, we run that information for data validation. At our intelligence centre our research heads track a lot of information related to the market which includes the quarterly reports, the daily stock prices, and other relevant information. Our data bank server gets updated every fortnight and that is how the information which we collected using our primary and secondary information is revalidated in real time.

Step 4: QA/QC Process
After all the data collection and validation our team does a final level of quality check and quality assurance to get rid of any unwanted or undesired mistakes. This might include but not limited to getting rid of the any typos, duplication of numbers or missing of any important information. The people involved in this process include technical content writers, research heads and graphics people. Once this process is completed the title gets uploader on our platform for our clients to read it.
Step 5: Final QC/QA Process:
This is the last process and comes when the client has ordered the study. In this process a final QA/QC is done before the study is emailed to the client. Since we believe in giving our clients a good experience of our research studies, therefore, to make sure that we do not lack at our end in any way humanly possible we do a final round of quality check and then dispatch the study to the client.