In-Mold Labels Market Report Scope & Oveview:
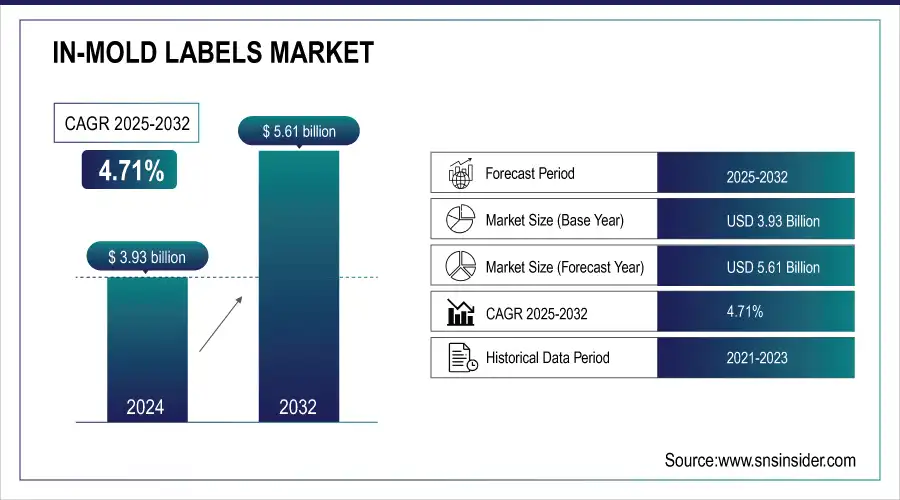
The In-Molds Labels Market was valued at USD 3.93 billion in 2024 and is expected to reach USD 5.61 billion by 2032, growing at a CAGR of 4.71% from 2025-2032.

Get More Information on In-Mold Labels Market - Request Sample Report
The In-Mold Labels (IML) market is experiencing steady growth due to its integration of labels with packaging during manufacturing, ensuring durability, premium aesthetics, and resistance to wear. Widely adopted in food and beverages for brand differentiation, IML is also gaining traction in cosmetics, pharmaceuticals, and household products. Its eco-friendly nature, reducing waste and supporting sustainability, further drives adoption. Technological advancements in materials, inks, and application techniques enhance design flexibility and quality. Despite benefits, high setup costs, specialized equipment, and intense competition present challenges.

Market Size and Forecast
-
Market Size in 2024: USD 3.93 Billion
-
Market Size by 2032: USD 5.61 Billion
-
CAGR: 4.71% from 2025 to 2032
-
Base Year: 2024
-
Forecast Period: 2025–2032
-
Historical Data: 2021–2023
In-Molds Labels Market Trends
-
Rising demand for durable, visually appealing, and cost-effective labeling solutions is driving the in-mold labels market.
-
Growing adoption in food, beverage, and household products packaging is boosting market expansion.
-
Integration with sustainable and recyclable packaging materials is aligning with eco-friendly initiatives.
-
Advancements in printing technologies are enabling high-quality graphics and customization.
-
Increasing automation in molding and labeling processes is improving efficiency and reducing production costs.
-
Expanding use in consumer goods and industrial applications is widening market scope.
-
Collaborations between packaging manufacturers, brand owners, and technology providers are fostering innovation.
In-Molds Labels Market Growth Drivers:
-
Rising Demand for Visually Appealing and Durable Packaging Across Food & Beverage Sector
The food and beverage sector drives the IML market significantly, with its demand for packaging that combines durability, moisture resistance, and superior aesthetics. In-Mold Labels allow high-quality graphics, vibrant designs, and clear branding, which boost consumer engagement and shelf differentiation. Their ability to integrate product information directly into packaging makes them a preferred solution. With rising consumer preference for packaged and branded goods, IML adoption continues to accelerate, making food and beverages the strongest driver of market expansion globally.
In-Molds Labels Market Restraints:
-
Complex Manufacturing Process Requiring Skilled Expertise Creates Operational Challenges
The IML process involves integrating labels within molds during container manufacturing, demanding high precision, advanced technical know-how, and specialized expertise. This complexity often leads to increased operational challenges, higher labor costs, and the need for extensive training. Any errors during production can result in significant losses, making consistency difficult for inexperienced players. These challenges restrict market penetration, particularly among small-scale manufacturers, thereby acting as a restraint on the growth potential of the In-Mold Labels market globally.
In-Molds Labels Market Opportunities:
-
Technological Innovations in Printing, Inks, and Materials Enhancing Label Performance
Ongoing technological innovations present lucrative opportunities for the IML market. Advancements in digital printing, UV-resistant inks, and specialty films allow labels to achieve better durability, vibrant aesthetics, and higher customization. Such innovations support sectors like cosmetics, pharmaceuticals, and premium beverages that demand high-end packaging. Additionally, the integration of smart features such as QR codes and interactive labels opens new avenues for consumer engagement, offering brands opportunities to differentiate themselves while expanding IML’s utility beyond conventional packaging applications.
-
Expanding Adoption of IML in Emerging Economies and New End-Use Sectors
Emerging markets present significant opportunities for IML adoption due to increasing industrialization, rising packaged food demand, and growing consumer preference for branded goods. Rapid urbanization and modern retail expansion in these regions drive the need for advanced packaging technologies. Beyond food and beverages, end-use industries such as personal care, household products, and pharmaceuticals are exploring IML for its durability and aesthetic appeal. This expansion creates vast opportunities for suppliers to penetrate untapped markets and diversify revenue streams.
In-Molds Labels Market Segment Analysis
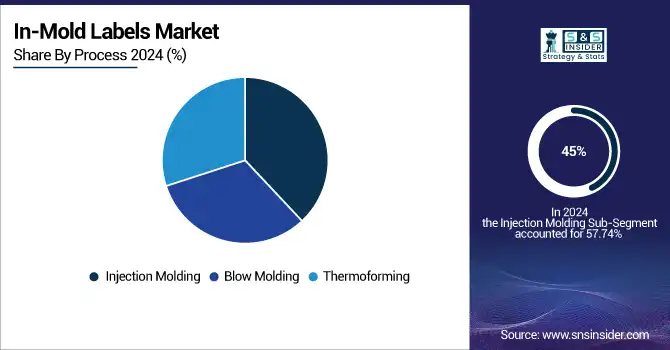
By Process, Injection molding dominates the In-Mold Labels market.
In 2024, Injection molding accounted for approximately 45% of the market due to its precision, versatility, and efficiency in producing complex, high-quality packaging designs. Widely used in food, beverage, and personal care industries, it ensures seamless label integration, durability, and resistance to wear. Its ability to handle large production volumes with consistent results makes it the most preferred process, driving its dominance in global IML applications.

By Material, Polypropylene dominates the In-Mold Labels market
In 2024, Polypropylene dominated the In-Mold Labels (IML) market with a share of approximately 38% due to its excellent durability, lightweight nature, and high resistance to moisture and chemicals. It provides superior print quality and adhesion, making it the preferred choice across food, beverage, and personal care packaging. Its recyclability and cost-effectiveness further boost adoption, aligning with the growing emphasis on sustainable packaging solutions while maintaining strong performance and visual appeal.
By Printing Method, Offset printing dominates the In-Mold Labels market
In 2024, Offset printing held a dominant share of around 42% owing to its ability to deliver high-quality, detailed, and vibrant graphics suitable for premium product packaging. This method supports large-scale production with consistent results, making it ideal for industries like food and beverages, where branding and aesthetics play a crucial role. Its cost efficiency for bulk runs and versatility across substrates further strengthen its market leadership.
By End Use, Food and beverages sector dominates the In-Mold Labels market.
In 2024, the food and beverages sector contributed around 50% of the market share, as brands increasingly adopt IML for superior packaging aesthetics, durability, and product differentiation. Dynamic graphics and enhanced shelf appeal make it highly effective in influencing consumer purchasing decisions. Its suitability for packaging that requires resistance to moisture and wear further strengthens its adoption, positioning food and beverages as the largest revenue-generating segment globally.
In-Molds Labels Market Regional Analysis
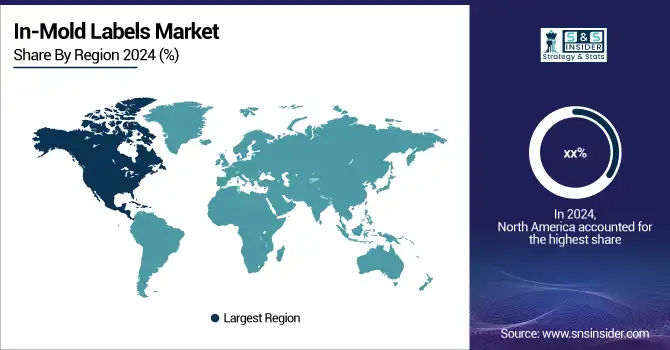
North America In-Molds Labels Market Insights
North America dominated the In-Mold Labels Market in 2024 due to high adoption of advanced packaging technologies, strong presence of leading label manufacturers, and extensive use across food & beverage, personal care, and pharmaceutical industries. The region benefits from well-established supply chains, robust R&D infrastructure, and increasing demand for sustainable and visually appealing packaging solutions, driving growth and reinforcing its leadership in the global IML market.

Get Customized Report as per your Business Requirement - Request For Customized Report
Asia Pacific In-Molds Labels Market Insights
The Asia-Pacific region is witnessing significant growth in the In-Mold Labels (IML) Market, driven by rapid industrialization, increasing consumer demand for packaged goods, and expanding food & beverage, personal care, and pharmaceutical sectors. Rising investments in advanced packaging technologies, growing manufacturing infrastructure, and increasing adoption of sustainable and aesthetically appealing labeling solutions are fueling market expansion, making Asia-Pacific a key region for IML manufacturers and suppliers.
Europe In-Molds Labels Market Insights
Europe holds a significant position in the In-Mold Labels (IML) Market, driven by advanced manufacturing capabilities, strong presence of key label manufacturers, and high demand from food & beverage, cosmetics, and pharmaceutical industries. The region emphasizes sustainable and eco-friendly packaging solutions, encouraging adoption of IML technology. Ongoing innovations in labeling materials, printing methods, and automation are further boosting market growth and enhancing product differentiation across Europe.
Middle East & Africa and Latin America In-Molds Labels Market Insights
The Middle East & Africa and Latin America In-Mold Labels (IML) Markets are expanding steadily, supported by growing packaged goods industries, urbanization, and rising consumer awareness. Limited local manufacturing has led to reliance on imports, while partnerships with global label suppliers are increasing accessibility. Investments in advanced packaging technologies, combined with demand from food & beverage, personal care, and pharmaceutical sectors, are driving market growth and creating opportunities in these regions.
In-Molds Labels Market Competitive Landscape:
Avery Dennison
Avery Dennison is a key player in the In-Molds Labels Market, offering innovative IML solutions with a focus on sustainability, recyclability, and traceability. The company integrates RFID technology into labels, enhancing product tracking, durability, and compliance with food safety standards. Avery Dennison continuously develops eco-friendly materials and PET-free inlays, supporting circular economy initiatives and reducing environmental impact while maintaining high-quality labeling performance across food, beverage, and consumer goods packaging applications.
Avery Dennison in In-Molds Labels Market focuses on innovation and sustainability, offering RFID-enabled IML products and eco-friendly solutions.
-
2025: Launched RFID-enabled IML portfolio AD Anchor U9, AD Line U9XE, and AD Spiral U9 IML designed for durability, traceability, and circularity.
-
2024: Western Michigan University certified AD Pure RFID inlays and tags for recyclability and repulpability, supporting sustainable labeling.
-
2023: Introduced AD Pure range, the first fully PET plastic-free RFID inlays and tags, reducing carbon footprint by 70–90%.
Key Players
Some of the In-Molds Labels Market Companies
-
CCL Industries Inc
-
Constantia Flexibles
-
Coveris Holdings SA
-
Mepco Label Systems
-
Avery Dennison Corporation
-
Century Label Inc
-
Allen Plastic
-
Cenveo Inc
-
Innovia Films Ltd
-
Huhtamaki Group
-
Multi-Color Corporation
-
Printpack Inc.
-
Sonoco Products Company
-
Bemis Company, Inc.
-
Winpak Ltd.
-
RPC Group Plc
-
Uflex Limited
-
LINPAC Packaging
-
WestRock Company
-
Berry Global, Inc.
Report Attributes | Details |
Market Size in 2024 | US$ 3.93 Bn |
Market Size by 2032 | US$ 5.61 Bn |
CAGR | CAGR of 4.71 % From 2025 to 2032 |
Base Year | 2024 |
Forecast Period | 2025-2032 |
Historical Data | 2021-2023 |
Report Scope & Coverage | Market Size, Segments Analysis, Competitive Landscape, Regional Analysis, DROC & SWOT Analysis, Forecast Outlook |
Key Segments | • By Material (Polyethylene, Polypropylene, Polystyrene, Polyethylene terephthalate, Paper, Barrier, Others) • By Printing Method (Flexographic, Gravure, Offset, Digital, Others) • By Process (Thermoforming, Blow Molding, Injection Molding) • By End Use (Food & Beverages, Pharmaceuticals, Personal Care & Cosmetics, Others) |
Regional Analysis/Coverage | North America (US, Canada, Mexico), Europe (Eastern Europe [Poland, Romania, Hungary, Turkey, Rest of Eastern Europe] Western Europe] Germany, France, UK, Italy, Spain, Netherlands, Switzerland, Austria, Rest of Western Europe]). Asia Pacific (China, India, Japan, South Korea, Vietnam, Singapore, Australia, Rest of Asia Pacific), Middle East & Africa (Middle East [UAE, Egypt, Saudi Arabia, Qatar, Rest of Middle East], Africa [Nigeria, South Africa, Rest of Africa], Latin America (Brazil, Argentina, Colombia Rest of Latin America) |
Company Profiles | CCL Industries Inc, Constantia Flexibles, Coveris Holdings SA, Mepco Label Systems, Avery Dennison Corporation, Century Label Inc, Allen Plastic, Cenveo Inc, Innovia Films Ltd, Huhtamaki Group, Multi-Color Corporation, Printpack Inc., Sonoco Products Company, Bemis Company, Inc., Winpak Ltd., RPC Group Plc, Uflex Limited, LINPAC Packaging, WestRock Company, Berry Global, Inc. |
Table Of Contents
1. Introduction
1.1 Market Definition & Scope
1.2 Research Assumptions & Abbreviations
1.3 Research Methodology
2. Executive Summary
2.1 Market Snapshot
2.2 Market Absolute $ Opportunity Assessment & Y-o-Y Analysis, 2021–2032
2.3 Market Size & Forecast, By Segmentation, 2021–2032
2.3.1 Market Size By Material
2.3.2 Market Size By Printing Method
2.3.3 Market Size By Process
2.3.4 Market Size By End Use
2.4 Market Share & Bps Analysis By Region, 2024
2.5 Industry Growth Scenarios – Conservative, Likely & Optimistic
2.6 Industry CxO’s Perspective
3. Market Overview
3.1 Market Dynamics
3.1.1 Drivers
3.1.2 Restraints
3.1.3 Opportunities
3.1.4 Key Market Trends
3.2 Industry PESTLE Analysis
3.3 Key Industry Forces (Porter’s) Impacting Market Growth
3.4 Industry Supply Chain Analysis
3.4.1 Raw Material Suppliers
3.4.2 Manufacturers
3.4.3 Distributors/Suppliers
3.4.4 Customers/End-Users
3.5 Industry Life Cycle Assessment
3.6 Parent Market Overview
3.7 Market Risk Assessment
4. Statistical Insights & Trends Reporting
4.1 Production & Capacity Metrics
4.1.1 Overview
4.1.2 Global Production Capacity of In-Mold Labels (Tons/Year)
4.1.3 Utilization Rate of Labeling Equipment (%)
4.1.4 Average Print Run Lengths for IML Production
4.1.5 Output Efficiency Metrics (Labels per Minute/Machine)
4.2 Material & Technology Metrics
4.2.1 Overview
4.2.2 % Share of Polypropylene vs. Other Substrates Used in IML
4.2.3 Adoption Rate of Digital vs. Conventional Printing for IML
4.2.4 Thickness Range Distribution of IML Films (Microns)
4.2.5 % Share of UV-Curable Inks vs. Solvent/Water-Based Inks
4.3 Application & End-Use Metrics
4.3.1 Overview
4.3.2 % Share of IML in Packaging for Food, Beverage, Personal Care, and Industrial Goods
4.3.3 Volume of IML Used in FMCG vs. Durable Goods Packaging (Tons)
4.3.4 Adoption Rate of IML in Rigid vs. Flexible Packaging (%)
4.3.5 Emerging End-Use Applications (Electronics, Automotive Interiors, Medical Devices)
4.4 Trade & Supply Chain Metrics
4.4.1 Overview
4.4.2 Import-Export Volume of IML Films & Labels (Value & Tons)
4.4.3 Major Exporting & Importing Countries in IML Market
4.4.4 Average Lead Times for Label Supply (Days)
4.4.5 % Outsourced vs. In-House Label Production by Packaging Companies
4.5 Cost & Pricing Metrics
4.5.1 Overview
4.5.2 Average Cost of IML per Square Meter (USD)
4.5.3 Pricing Trends by Print Technology (Offset, Flexo, Gravure, Digital)
4.5.4 Cost Breakdown: Raw Materials vs. Printing vs. Finishing (%)
4.5.5 Benchmark Pricing by Region and Supplier Type
5. In-Molds Labels Market Segmental Analysis & Forecast, By Material, 2021 – 2032, Value (Usd Billion)
5.1 Introduction
5.2 Polyethylene
5.2.1 Key Trends
5.2.2 Market Size & Forecast, 2021 – 2032
5.3 Polypropylene
5.4 Polystyrene
5.5 Polyethylene terephthalate
5.6 Paper
5.7 Barrier
5.8 Others
6. In-Molds Labels Market Segmental Analysis & Forecast, By Printing Method, 2021 – 2032, Value (Usd Billion)
6.1 Introduction
6.2 Flexographic
6.2.1 Key Trends
6.2.2 Market Size & Forecast, 2021 – 2032
6.3 Gravure
6.4 Offset
6.5 Digital
6.6 Others
7. In-Molds Labels Market Segmental Analysis & Forecast, By Process, 2021 – 2032, Value (Usd Billion)
7.1 Introduction
7.2 Thermoforming
7.2.1 Key Trends
7.2.2 Market Size & Forecast, 2021 – 2032
7.3 Blow Molding
7.4 Injection Molding
8. In-Molds Labels Market Segmental Analysis & Forecast, By End Use, 2021 – 2032, Value (Usd Billion)
8.1 Introduction
8.2 Food & Beverages
8.2.1 Key Trends
8.2.2 Market Size & Forecast, 2021 – 2032
8.3 Pharmaceuticals
8.4 Personal Care & Cosmetics
8.5 Others
9. In-Molds Labels Market Segmental Analysis & Forecast By Region, 2021 – 2025, Value (Usd Billion)
9.1 Introduction
9.2 North America
9.2.1 Key Trends
9.2.2 In-Molds Labels Market Size & Forecast, By Material, 2021 – 2032
9.2.3 In-Molds Labels Market Size & Forecast, By Printing Method, 2021 – 2032
9.2.4 In-Molds Labels Market Size & Forecast, By Process, 2021 – 2032
9.2.5 In-Molds Labels Market Size & Forecast, By End Use, 2021 – 2032
9.2.6 In-Molds Labels Market Size & Forecast, By Country, 2021 – 2032
9.2.6.1 USA
9.2.6.1.1 In-Molds Labels Market Size & Forecast, By Material, 2021 – 2032
9.2.6.1.2 In-Molds Labels Market Size & Forecast, By Printing Method, 2021 – 2032
9.2.6.1.3 In-Molds Labels Market Size & Forecast, By Process, 2021 – 2032
9.2.6.1.4 In-Molds Labels Market Size & Forecast, By End Use, 2021 – 2032
9.2.6.2 Canada
9.2.6.2.1 In-Molds Labels Market Size & Forecast, By Material, 2021 – 2032
9.2.6.2.2 In-Molds Labels Market Size & Forecast, By Printing Method, 2021 – 2032
9.2.6.2.3 In-Molds Labels Market Size & Forecast, By Process, 2021 – 2032
9.2.6.2.4 In-Molds Labels Market Size & Forecast, By End Use, 2021 – 2032
9.3 Europe
9.3.1 Key Trends
9.3.2 In-Molds Labels Market Size & Forecast, By Material, 2021 – 2032
9.3.3 In-Molds Labels Market Size & Forecast, By Printing Method, 2021 – 2032
9.3.4 In-Molds Labels Market Size & Forecast, By Process, 2021 – 2032
9.3.5 In-Molds Labels Market Size & Forecast, By End Use, 2021 – 2032
9.3.6 In-Molds Labels Market Size & Forecast, By Country, 2021 – 2032
9.3.6.1 Germany
9.3.6.1.1 In-Molds Labels Market Size & Forecast, By Material, 2021 – 2032
9.3.6.1.2 In-Molds Labels Market Size & Forecast, By Printing Method, 2021 – 2032
9.3.6.1.3 In-Molds Labels Market Size & Forecast, By Process, 2021 – 2032
9.3.6.1.4 In-Molds Labels Market Size & Forecast, By End Use, 2021 – 2032
9.3.6.2 UK
9.3.6.2.1 In-Molds Labels Market Size & Forecast, By Material, 2021 – 2032
9.3.6.2.2 In-Molds Labels Market Size & Forecast, By Printing Method, 2021 – 2032
9.3.6.2.3 In-Molds Labels Market Size & Forecast, By Process, 2021 – 2032
9.3.6.2.4 In-Molds Labels Market Size & Forecast, By End Use, 2021 – 2032
9.3.6.3 France
9.3.6.3.1 In-Molds Labels Market Size & Forecast, By Material, 2021 – 2032
9.3.6.3.2 In-Molds Labels Market Size & Forecast, By Printing Method, 2021 – 2032
9.3.6.3.3 In-Molds Labels Market Size & Forecast, By Process, 2021 – 2032
9.3.6.3.4 In-Molds Labels Market Size & Forecast, By End Use, 2021 – 2032
9.3.6.4 Italy
9.3.6.4.1 In-Molds Labels Market Size & Forecast, By Material, 2021 – 2032
9.3.6.4.2 In-Molds Labels Market Size & Forecast, By Printing Method, 2021 – 2032
9.3.6.4.3 In-Molds Labels Market Size & Forecast, By Process, 2021 – 2032
9.3.6.4.4 In-Molds Labels Market Size & Forecast, By End Use, 2021 – 2032
9.3.6.5 Spain
9.3.6.5.1 In-Molds Labels Market Size & Forecast, By Material, 2021 – 2032
9.3.6.5.2 In-Molds Labels Market Size & Forecast, By Printing Method, 2021 – 2032
9.3.6.5.3 In-Molds Labels Market Size & Forecast, By Process, 2021 – 2032
9.3.6.5.4 In-Molds Labels Market Size & Forecast, By End Use, 2021 – 2032
9.3.6.6 Russia
9.3.6.6.1 In-Molds Labels Market Size & Forecast, By Material, 2021 – 2032
9.3.6.6.2 In-Molds Labels Market Size & Forecast, By Printing Method, 2021 – 2032
9.3.6.6.3 In-Molds Labels Market Size & Forecast, By Process, 2021 – 2032
9.3.6.6.4 In-Molds Labels Market Size & Forecast, By End Use, 2021 – 2032
9.3.6.7 Poland
9.3.6.7.1 In-Molds Labels Market Size & Forecast, By Material, 2021 – 2032
9.3.6.7.2 In-Molds Labels Market Size & Forecast, By Printing Method, 2021 – 2032
9.3.6.7.3 In-Molds Labels Market Size & Forecast, By Process, 2021 – 2032
9.3.6.7.4 In-Molds Labels Market Size & Forecast, By End Use, 2021 – 2032
9.3.6.8 Rest of Europe
9.3.6.8.1 In-Molds Labels Market Size & Forecast, By Material, 2021 – 2032
9.3.6.8.2 In-Molds Labels Market Size & Forecast, By Printing Method, 2021 – 2032
9.3.6.8.3 In-Molds Labels Market Size & Forecast, By Process, 2021 – 2032
9.3.6.8.4 In-Molds Labels Market Size & Forecast, By End Use, 2021 – 2032
9.4 Asia-Pacific
9.4.1 Key Trends
9.4.2 In-Molds Labels Market Size & Forecast, By Material, 2021 – 2032
9.4.3 In-Molds Labels Market Size & Forecast, By Printing Method, 2021 – 2032
9.4.4 In-Molds Labels Market Size & Forecast, By Process, 2021 – 2032
9.4.5 In-Molds Labels Market Size & Forecast, By End Use, 2021 – 2032
9.4.6 In-Molds Labels Market Size & Forecast, By Country, 2021 – 2032
9.4.6.1 China
9.4.6.1.1 In-Molds Labels Market Size & Forecast, By Material, 2021 – 2032
9.4.6.1.2 In-Molds Labels Market Size & Forecast, By Printing Method, 2021 – 2032
9.4.6.1.3 In-Molds Labels Market Size & Forecast, By Process, 2021 – 2032
9.4.6.1.4 In-Molds Labels Market Size & Forecast, By End Use, 2021 – 2032
9.4.6.2 India
9.4.6.2.1 In-Molds Labels Market Size & Forecast, By Material, 2021 – 2032
9.4.6.2.2 In-Molds Labels Market Size & Forecast, By Printing Method, 2021 – 2032
9.4.6.2.3 In-Molds Labels Market Size & Forecast, By Process, 2021 – 2032
9.4.6.2.4 In-Molds Labels Market Size & Forecast, By End Use, 2021 – 2032
9.4.6.3 Japan
9.4.6.3.1 In-Molds Labels Market Size & Forecast, By Material, 2021 – 2032
9.4.6.3.2 In-Molds Labels Market Size & Forecast, By Printing Method, 2021 – 2032
9.4.6.3.3 In-Molds Labels Market Size & Forecast, By Process, 2021 – 2032
9.4.6.3.4 In-Molds Labels Market Size & Forecast, By End Use, 2021 – 2032
9.4.6.4 South Korea
9.4.6.4.1 In-Molds Labels Market Size & Forecast, By Material, 2021 – 2032
9.4.6.4.2 In-Molds Labels Market Size & Forecast, By Printing Method, 2021 – 2032
9.4.6.4.3 In-Molds Labels Market Size & Forecast, By Process, 2021 – 2032
9.4.6.4.4 In-Molds Labels Market Size & Forecast, By End Use, 2021 – 2032
9.4.6.5 Australia
9.4.6.5.1 In-Molds Labels Market Size & Forecast, By Material, 2021 – 2032
9.4.6.5.2 In-Molds Labels Market Size & Forecast, By Printing Method, 2021 – 2032
9.4.6.5.3 In-Molds Labels Market Size & Forecast, By Process, 2021 – 2032
9.4.6.5.4 In-Molds Labels Market Size & Forecast, By End Use, 2021 – 2032
9.4.6.6 ASEAN Countries
9.4.6.6.1 In-Molds Labels Market Size & Forecast, By Material, 2021 – 2032
9.4.6.6.2 In-Molds Labels Market Size & Forecast, By Printing Method, 2021 – 2032
9.4.6.6.3 In-Molds Labels Market Size & Forecast, By Process, 2021 – 2032
9.4.6.6.4 In-Molds Labels Market Size & Forecast, By End Use, 2021 – 2032
9.4.6.7 Rest of Asia-Pacific
9.4.6.7.1 In-Molds Labels Market Size & Forecast, By Material, 2021 – 2032
9.4.6.7.2 In-Molds Labels Market Size & Forecast, By Printing Method, 2021 – 2032
9.4.6.7.3 In-Molds Labels Market Size & Forecast, By Process, 2021 – 2032
9.4.6.7.4 In-Molds Labels Market Size & Forecast, By End Use, 2021 – 2032
9.5 Latin America
9.5.1 Key Trends
9.5.2 In-Molds Labels Market Size & Forecast, By Material, 2021 – 2032
9.5.3 In-Molds Labels Market Size & Forecast, By Printing Method, 2021 – 2032
9.5.4 In-Molds Labels Market Size & Forecast, By Process, 2021 – 2032
9.5.5 In-Molds Labels Market Size & Forecast, By End Use, 2021 – 2032
9.5.6 In-Molds Labels Market Size & Forecast, By Country, 2021 – 2032
9.5.6.1 Brazil
9.5.6.1.1 In-Molds Labels Market Size & Forecast, By Material, 2021 – 2032
9.5.6.1.2 In-Molds Labels Market Size & Forecast, By Printing Method, 2021 – 2032
9.5.6.1.3 In-Molds Labels Market Size & Forecast, By Process, 2021 – 2032
9.5.6.1.4 In-Molds Labels Market Size & Forecast, By End Use, 2021 – 2032
9.5.6.2 Argentina
9.5.6.2.1 In-Molds Labels Market Size & Forecast, By Material, 2021 – 2032
9.5.6.2.2 In-Molds Labels Market Size & Forecast, By Printing Method, 2021 – 2032
9.5.6.2.3 In-Molds Labels Market Size & Forecast, By Process, 2021 – 2032
9.5.6.2.4 In-Molds Labels Market Size & Forecast, By End Use, 2021 – 2032
9.5.6.3 Mexico
9.5.6.3.1 In-Molds Labels Market Size & Forecast, By Material, 2021 – 2032
9.5.6.3.2 In-Molds Labels Market Size & Forecast, By Printing Method, 2021 – 2032
9.5.6.3.3 In-Molds Labels Market Size & Forecast, By Process, 2021 – 2032
9.5.6.3.4 In-Molds Labels Market Size & Forecast, By End Use, 2021 – 2032
9.5.6.4 Colombia
9.5.6.4.1 In-Molds Labels Market Size & Forecast, By Material, 2021 – 2032
9.5.6.4.2 In-Molds Labels Market Size & Forecast, By Printing Method, 2021 – 2032
9.5.6.4.3 In-Molds Labels Market Size & Forecast, By Process, 2021 – 2032
9.5.6.4.4 In-Molds Labels Market Size & Forecast, By End Use, 2021 – 2032
9.5.6.5 Rest of Latin America
9.5.6.5.1 In-Molds Labels Market Size & Forecast, By Material, 2021 – 2032
9.5.6.5.2 In-Molds Labels Market Size & Forecast, By Printing Method, 2021 – 2032
9.5.6.5.3 In-Molds Labels Market Size & Forecast, By Process, 2021 – 2032
9.5.6.5.4 In-Molds Labels Market Size & Forecast, By End Use, 2021 – 2032
9.6 Middle East & Africa
9.6.1 Key Trends
9.6.2 In-Molds Labels Market Size & Forecast, By Material, 2021 – 2032
9.6.3 In-Molds Labels Market Size & Forecast, By Printing Method, 2021 – 2032
9.6.4 In-Molds Labels Market Size & Forecast, By Process, 2021 – 2032
9.6.5 In-Molds Labels Market Size & Forecast, By End Use, 2021 – 2032
9.6.6 In-Molds Labels Market Size & Forecast, By Country, 2021 – 2032
9.6.6.1 UAE
9.6.6.1.1 In-Molds Labels Market Size & Forecast, By Material, 2021 – 2032
9.6.6.1.2 In-Molds Labels Market Size & Forecast, By Printing Method, 2021 – 2032
9.6.6.1.3 In-Molds Labels Market Size & Forecast, By Process, 2021 – 2032
9.6.6.1.4 In-Molds Labels Market Size & Forecast, By End Use, 2021 – 2032
9.6.6.2 Saudi Arabia
9.6.6.2.1 In-Molds Labels Market Size & Forecast, By Material, 2021 – 2032
9.6.6.2.2 In-Molds Labels Market Size & Forecast, By Printing Method, 2021 – 2032
9.6.6.2.3 In-Molds Labels Market Size & Forecast, By Process, 2021 – 2032
9.6.6.2.4 In-Molds Labels Market Size & Forecast, By End Use, 2021 – 2032
9.6.6.3 Qatar
9.6.6.3.1 In-Molds Labels Market Size & Forecast, By Material, 2021 – 2032
9.6.6.3.2 In-Molds Labels Market Size & Forecast, By Printing Method, 2021 – 2032
9.6.6.3.3 In-Molds Labels Market Size & Forecast, By Process, 2021 – 2032
9.6.6.3.4 In-Molds Labels Market Size & Forecast, By End Use, 2021 – 2032
9.6.6.4 Egypt
9.6.6.4.1 In-Molds Labels Market Size & Forecast, By Material, 2021 – 2032
9.6.6.4.2 In-Molds Labels Market Size & Forecast, By Printing Method, 2021 – 2032
9.6.6.4.3 In-Molds Labels Market Size & Forecast, By Process, 2021 – 2032
9.6.6.4.4 In-Molds Labels Market Size & Forecast, By End Use, 2021 – 2032
9.6.6.5 South Africa
9.6.6.5.1 In-Molds Labels Market Size & Forecast, By Material, 2021 – 2032
9.6.6.5.2 In-Molds Labels Market Size & Forecast, By Printing Method, 2021 – 2032
9.6.6.5.3 In-Molds Labels Market Size & Forecast, By Process, 2021 – 2032
9.6.6.5.4 In-Molds Labels Market Size & Forecast, By End Use, 2021 – 2032
9.6.6.6 Rest of Middle East & Africa
9.6.6.6.1 In-Molds Labels Market Size & Forecast, By Material, 2021 – 2032
9.6.6.6.2 In-Molds Labels Market Size & Forecast, By Printing Method, 2021 – 2032
9.6.6.6.3 In-Molds Labels Market Size & Forecast, By Process, 2021 – 2032
9.6.6.6.4 In-Molds Labels Market Size & Forecast, By End Use, 2021 – 2032
10. Competitive Landscape
10.1 Key Players' Positioning
10.2 Competitive Developments
10.2.1 Key Strategies Adopted (%), By Key Players, 2024
10.2.2 Year-Wise Strategies & Development, 2021 – 2025
10.2.3 Number Of Strategies Adopted By Key Players, 2024
10.3 Market Share Analysis, 2024
10.4 Product/Service & Application Benchmarking
10.4.1 Product/Service Specifications & Features By Key Players
10.4.2 Product/Service Heatmap By Key Players
10.4.3 Application Heatmap By Key Players
10.5 Industry Start-Up & Innovation Landscape
10.6 Key Company Profiles
10.6.1 CCL Industries Inc
10.6.1.1 Company Overview & Snapshot
10.6.1.2 Product/Service Portfolio
10.6.1.3 Key Company Financials
10.6.1.4 SWOT Analysis
10.6.2 Constantia Flexibles
10.6.3 Coveris Holdings SA
10.6.4 Mepco Label Systems
10.6.5 Avery Dennison Corporation
10.6.6 Century Label Inc
10.6.7 Allen Plastic
10.6.8 Cenveo Inc
10.6.9 Innovia Films Ltd
10.6.10 Huhtamaki Group
10.6.11 Multi-Color Corporation
10.6.12 Printpack Inc.
10.6.13 Sonoco Products Company
10.6.14 Bemis Company, Inc.
10.6.15 Winpak Ltd.
10.6.16 RPC Group Plc
10.6.17 Uflex Limited
10.6.18 LINPAC Packaging
10.6.19 WestRock Company
10.6.20 Berry Global, Inc.
11. Analyst Recommendations
11.1 SNS Insider Opportunity Map
11.2 Industry Low-Hanging Fruit Assessment
11.3 Market Entry & Growth Strategy
11.4 Analyst Viewpoint & Suggestions on Market Growth
12. Assumptions
13. Disclaimer
14. Appendix
14.1 List Of Tables
14.2 List Of Figures
Key Segments:
By Material
-
Polyethylene
-
Polypropylene
-
Polystyrene
-
Polyethylene terephthalate
-
Paper
-
Barrier
-
Others
By Printing Method
-
Flexographic
-
Gravure
-
Offset
-
Digital
-
Others
By Process
-
Thermoforming
-
Blow Molding
-
Injection Molding
By End Use
-
Food & Beverages
-
Pharmaceuticals
-
Personal Care & Cosmetics
-
Others
Request for Segment Customization as per your Business Requirement: Segment Customization Request
Regional Coverage:
North America
-
US
-
Canada
Europe
-
Germany
-
France
-
UK
-
Italy
-
Spain
-
Poland
-
Russia
-
Rest of Europe
Asia Pacific
-
China
-
India
-
Japan
-
South Korea
-
Australia
-
ASEAN Countries
-
Rest of Asia Pacific
Middle East & Africa
-
UAE
-
Saudi Arabia
-
Qatar
-
South Africa
-
Rest of Middle East & Africa
Latin America
-
Brazil
-
Argentina
-
Mexico
-
Colombia
-
Rest of Latin America
Request for Country Level Research Report: Country Level Customization Request
Available Customization
With the given market data, SNS Insider offers customization as per the company’s specific needs. The following customization options are available for the report:
-
Detailed Volume Analysis
-
Criss-Cross segment analysis (e.g. Product X Application)
-
Competitive Product Benchmarking
-
Geographic Analysis
-
Additional countries in any of the regions
-
Customized Data Representation
-
Detailed analysis and profiling of additional market players
An accurate research report requires proper strategizing as well as implementation. There are multiple factors involved in the completion of good and accurate research report and selecting the best methodology to compete the research is the toughest part. Since the research reports we provide play a crucial role in any company’s decision-making process, therefore we at SNS Insider always believe that we should choose the best method which gives us results closer to reality. This allows us to reach at a stage wherein we can provide our clients best and accurate investment to output ratio.
Each report that we prepare takes a timeframe of 350-400 business hours for production. Starting from the selection of titles through a couple of in-depth brain storming session to the final QC process before uploading our titles on our website we dedicate around 350 working hours. The titles are selected based on their current market cap and the foreseen CAGR and growth.
The 5 steps process:
Step 1: Secondary Research:
Secondary Research or Desk Research is as the name suggests is a research process wherein, we collect data through the readily available information. In this process we use various paid and unpaid databases which our team has access to and gather data through the same. This includes examining of listed companies’ annual reports, Journals, SEC filling etc. Apart from this our team has access to various associations across the globe across different industries. Lastly, we have exchange relationships with various university as well as individual libraries.

Step 2: Primary Research
When we talk about primary research, it is a type of study in which the researchers collect relevant data samples directly, rather than relying on previously collected data. This type of research is focused on gaining content specific facts that can be sued to solve specific problems. Since the collected data is fresh and first hand therefore it makes the study more accurate and genuine.
We at SNS Insider have divided Primary Research into 2 parts.
Part 1 wherein we interview the KOLs of major players as well as the upcoming ones across various geographic regions. This allows us to have their view over the market scenario and acts as an important tool to come closer to the accurate market numbers. As many as 45 paid and unpaid primary interviews are taken from both the demand and supply side of the industry to make sure we land at an accurate judgement and analysis of the market.
This step involves the triangulation of data wherein our team analyses the interview transcripts, online survey responses and observation of on filed participants. The below mentioned chart should give a better understanding of the part 1 of the primary interview.

Part 2: In this part of primary research the data collected via secondary research and the part 1 of the primary research is validated with the interviews from individual consultants and subject matter experts.
Consultants are those set of people who have at least 12 years of experience and expertise within the industry whereas Subject Matter Experts are those with at least 15 years of experience behind their back within the same space. The data with the help of two main processes i.e., FGDs (Focused Group Discussions) and IDs (Individual Discussions). This gives us a 3rd party nonbiased primary view of the market scenario making it a more dependable one while collation of the data pointers.
Step 3: Data Bank Validation
Once all the information is collected via primary and secondary sources, we run that information for data validation. At our intelligence centre our research heads track a lot of information related to the market which includes the quarterly reports, the daily stock prices, and other relevant information. Our data bank server gets updated every fortnight and that is how the information which we collected using our primary and secondary information is revalidated in real time.

Step 4: QA/QC Process
After all the data collection and validation our team does a final level of quality check and quality assurance to get rid of any unwanted or undesired mistakes. This might include but not limited to getting rid of the any typos, duplication of numbers or missing of any important information. The people involved in this process include technical content writers, research heads and graphics people. Once this process is completed the title gets uploader on our platform for our clients to read it.
Step 5: Final QC/QA Process:
This is the last process and comes when the client has ordered the study. In this process a final QA/QC is done before the study is emailed to the client. Since we believe in giving our clients a good experience of our research studies, therefore, to make sure that we do not lack at our end in any way humanly possible we do a final round of quality check and then dispatch the study to the client.