Industry 5.0 Market Key Insights:
Get More Information on Industry 5.0 Market - Request Sample Report
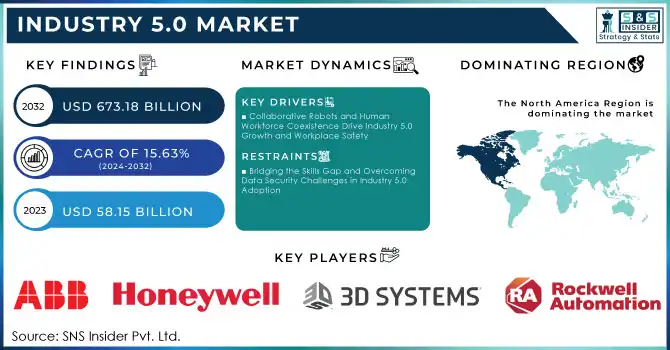
The Industry 5.0 Market Size was estimated at USD 58.15 billion in 2023 and is expected to reach USD 673.18 billion by 2032, with a growing at CAGR of 15.63% during the forecast period of 2024-2032.
The industry 5.0 market being focused on the human-centric solution to production that requires the involvement of people along with automation has been growing day by day. The neo-industrial paradigm seeks to improve the efficiency, productivity, and customizability of manufacturing processes through the use of modern-day technologies, including artificial intelligence (AI), robotics, and digital twins. This increase is due to a growing preference for customized and premium products in the automotive, healthcare, and electronics sectors. Moreover, the rapid growth of IoT and connectivity technologies, which allow both instant data exchange and decision-making, has helped promote the implementation of Industry 5.0. In 2023, 70% of the world's manufacturers have adopted AI technologies to help with predictive maintenance and process optimization.
Collaborative robots (also known as cobots) were utilized in 18% of industrial operations and expected an annual increment of over 20%. By 2024, digital twin technology had been adopted by 25% of manufacturers to optimize the production process and minimize the expected downtime. Beyond that, more than 60 billion IoT devices are expected to be worldwide connected by 2024, which shall improve real-time decision-making in Industry 5.0.
The rise in hybrid and cloud-based deployment models ensures scalability and flexibility, leading to increased spend on such technologies by small and medium enterprises (SMEs). Additionally, several governments and organizations across the globe are deploying considerable funds in research and development as well as the supporting infrastructure necessary for Industry 5.0 innovation, which encompasses all things related to smart factories and collaborative robotics. All these factors together make it the game-changer for global manufacturing in the name of Industry 5.0.
Government investments in sustainable manufacturing continue to grow, with the EU allocating EURO 50 billion to green and digital transitions as part of the Horizon Europe program in 2023-2024. By 2024, 70% of organizations in the manufacturing sector will have adopted AI adoption for applications involving predictive maintenance and process optimization. Worldwide yearly development of cobots reaches 25% with 20% of assembling activities in the created nations utilizing such robots. The number of IoT devices in manufacturing is expected to reach 60 billion-plus by 2024, facilitating smart data-driven decisions.
Market Dynamic
KEY DRIVERS:
-
Collaborative Robots and Human Workforce Coexistence Drive Industry 5.0 Growth and Workplace Safety
The rising need for better coexistence of human and robot workforce is one of the major growth accelerators for the industry 5.0 market. Collaborative robots or cobots, are built to help humans perform tasks that require precision, strength, or repeated motion so employees can find their strengths in complex problems and innovation. In sectors like healthcare and aerospace where the processes are sensitive, complex, and require fine motor skills, this type of hybrid is ideal. Cobots are also being adopted due to the need for safer, ergonomic workplaces as they reduce workplace injuries related to repetitive strain or dangerous work. 35% of manufacturing operations are projected to utilize collaborative robots (cobots) for assembly, material handling, and other tasks by 2024. In repetitive task industries, cobots are expected to alleviate 35% of musculoskeletal disorders (MSDs) which are commonplace in workplaces and cause injuries. According to a survey of workplaces utilizing cobots, 70% of workers experience less physical strain, and 50% experience reduced workplace injury. The growth of the cobot market is expansive, with nearly over 6,000 cobots deployed in various sectors such as healthcare, automotive, and electronics, the market shall be growing at a rate of 25% per annum.
-
Edge Computing Drives Efficiency and Real-Time Decision Making in Industry 5.0 with IoT and 5G
Edge computing provides low latency and high efficiency by processing data closer to its source, deviating from traditional cloud computing. This is critical in Industry 5.0 settings where immediate decision-making is essential to maintain continuous processes and seamless transition between processes. Edge computing, for instance, powers solutions such as predictive maintenance in manufacturing and autonomous systems in logistics, where downtime can be disastrous and operational reliability is paramount. With the increase in the number of IoT devices, receiving and processing massive data flow, as well as software and hardware that need to respond instantly, edge computing has become an essential part of the Industry 5.0 scenario. The number of IoT devices powering edge computing is projected to surpass 27 billion by 2024, compared to 13 billion in 2023. Edge computing in manufacturing will lower maintenance costs by 12%, and downtime by 35% (real-time predictive analytics). It is also projected to eliminate 99.73% of unnecessary data storage, leading to optimal use of resources. Edge computing can decrease operational inefficiencies in industries, such as healthcare and automotive, by as much as 40%. It also states that by 2025, 70% of new IoT applications will combine edge computing with 5G connectivity to allow for faster decision-making.
RESTRAIN:
-
Bridging the Skills Gap and Overcoming Data Security Challenges in Industry 5.0 Adoption
One of the biggest struggles Industry 5.0 faces is the shortage of workers who can operate innovative technologies such as collaborative robotics, AI, and digital twins. However, industry 5.0 would require workers to have technical knowledge and be flexible to work with sophisticated systems. There is a huge gap in skills in many types of industries, especially in small and medium enterprises (SMEs), which lack access to upskilling goods. This gap between technology and the domain slows the adoption rate of Industry 5.0 solutions, and it limits our potential for full human-machine collaboration. Data security & privacy concerns regarding interconnected systems and IoT devices are another key constraint. Industry 5.0 is completely dependent on shared data by all stakeholders through different networks, which increases susceptibility to cyberattacks, data breaches, and unauthorized access. Especially, industries like healthcare and aerospace, which come with sensitive data, refrain from using such technologies. This forces organizations to dedicate a significant number of resources towards cybersecurity, making it even more difficult to adopt Industry 5.0.
Segment Analysis
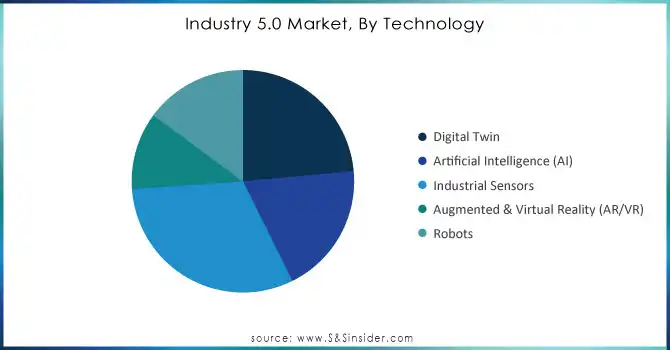
BY TECHNOLOGY TYPE
The industrial sensors segment accounted for the largest market share of 31% in 2023, as it acts as a key cornerstone to enable various Industry 5.0 technologies, which include IoT, Predictive Maintenance, and Automation. These sensors gather real-time data from manufacturing processes using a variety of types such as temperature, pressure, motion, proximity, and more to provide a seamless operation in smart factories. There has been a surge in the adoption of industrial sensors across automotive, aerospace, and healthcare sectors as the focus on precision and efficiency in manufacturing processes rises. Moreover, a fusion of sensors, AI, and edge technologies has made the sensors more intelligent and they have become a critical component in attaining Industry 5.0 objectives.
Artificial Intelligence segment expected to grow at the fastest CAGR from 2024 to 2032, will play a transformative functional role in Industry 5.0 The ability of the AI to analyze huge amounts of data, obtain relevant information from them, and develop a basis for human-machine cooperation, predictive maintenance, and tailor-made production must not be work out. Since Industry 5.0 heavily relies on AI technologies such as machine learning (ML), natural language processing (NLP), and vision systems, growing AI deployment in Industry 5.0 has greatly benefited this business area. The growth further skyrockets as it is being used in real-time analytics, autonomous systems, and robotics. The accelerating pace of innovation and the increasing availability of AI algorithms through cloud and edge computing platforms will be the catalyst for its growth in just about every sector.
Need Any Customization Research On Industry 5.0 Market - Inquiry Now
BY ORGANIZATION
Large enterprises segment held a market share of 67% of Industry 5.0 market in 2023, on account of their ability to invest in highly advanced technologies such as AI, robotics, and digital twins. Organizations with vast financial resources and matured infrastructures are better equipped to seamlessly integrate complex industrial 5.0 systems. Big firms likewise have the economic climates of scale to release advanced solutions across various centers. Also, their resource management when it comes to R&D and staff training prepares them to better transition into more human-centered technologies, such as cobots (collaborative robots) and IoT-sensitive practices. Such dominance is especially true for capital-intensive sectors such as automotive and aerospace, where enterprise scale adoption to Industry 5.0 capital goods enables efficiency and productivity.
Small and medium enterprises (SMEs) segment is estimated to record the fastest CAGR through 2024-2032 since Industry 5.0 technologies are becoming affordable for SMEs by this timeframe. These deployment models also helped to bring advanced technologies closer to SMEs by lowering upfront costs and allowing scalability through the cloud (be it public, private, or hybrid). Industry 5.0 is also being used by SMEs for product customization to be able to be more competitive in niche markets. The spryness of this growth is being hastened by government initiatives and funding programs for digital transformation in SMEs. Industry 5.0 is adopted by SMEs in specific sectors such as healthcare and electronics to provide them with customized solutions such as precision manufacturing and robotics-assisted processes. Increased modularity and customization of technologies mean that SMEs are ready to fill this gap with quick adoption.
BY DEPLOYMENT MODEL
Cloud-based solutions segment accounted for a dominant market share of 53% in 2023 and will register the highest CAGR between 2024 and 2032. This leadership comes as a result of the native advantages they possess such as cost, scalability, and ease of deployment. As a result, cloud solutions allow for speedy adoption of Industry 5.0 technologies for businesses without having to cope with huge capital outlay on infrastructure. Ideal for modern apps such as AI, digital twins, and real-time analytics work driving their adoption in automotive, healthcare, and other electronic sectors. This provides Even HR with a further 2023 lock-in for their customers, as the ability to centralize and access data globally creates an extra level of stickiness. Hybrid and edge-cloud models, to better blend the benefits of cloud systems with on-premises control for sensitive data. Cloud-based platforms are being used by SMEs, especially to access tools for high-performance computing and automation that only very large enterprises could acquire previously. Cloud-based Industry 5.0 applications are also benefitting from the proliferation of 5G and IoT technologies, and the wide-ranging functionality added through these technologies will keep the music playing on for these applications, achieving the highest CAGR over the years to come.
BY END USE
In 2023, automotive segment led the market with a share of 28% as smart manufacturing, automation and the transition to electric vehicles (EVs) and autonomous driving technologies made great strides. I remember comparing the automotive sector back in 2021 to the standing of other industries in the adoption of Industry 5.0 technologies like cobots, AI-based quality inspection, and real-time data analytics and the automotive sector was still on top. Not only do these advances facilitate production lines, but they also increase the ability to customize and personalize vehicles within the demand we are starting to see from consumers. In addition, other efforts, including a significant investment in smart factories and connected ecosystems, have also pushed the automotive sector even further ahead of the rest in the Industry 5.0 space.
Semiconductor & Electronics segment is likely to register a fastest CAGR owing to the demand for advanced semiconductors to accommodate new technologies such as 5G, AI, and IoT in the period from 2024 to 2032. Semiconductors are the backbone of digital transformation and are critical to many industries, including automotive, healthcare, and telecommunications, The semiconductor industry is set for a period of rapid growth as demand for more powerful, more efficient chips especially for edge computing, autonomous systems, and high-performance computing (HPC) continues to rise. Smart devices are likewise permeating everywhere, and continued electrification development makes this field a major force in Industry 5.0 growth.
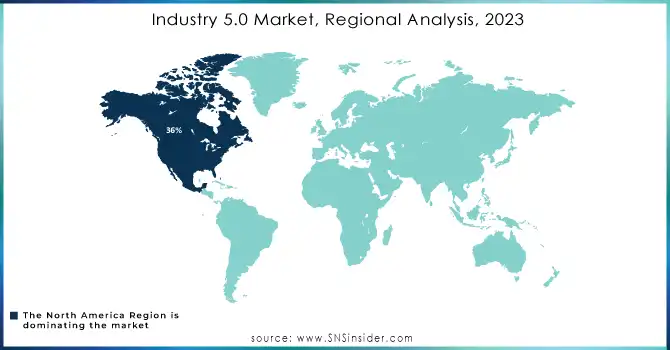
Regional Overview
North America accounted for 36% market share in 2023. Major players such as General Motors and Tesla have extensive automotive manufacturing operations in the region and are adopting Industry 5.0 practices like human-robot collaboration, AI-based manufacturing, and digital twins to improve productivity and personalization in automotive manufacturing. It is also considered a center for the Semiconductor manufacturing industry consisting of some top companies such as Intel and NVIDIA leading the way in AI and machine learning. In addition, the ongoing initiatives of the U.S. government, aimed at enhancing digital transformation via investments in smart manufacturing and advanced robotics, continue to expand the dominance of the region.
Asia Pacific is anticipated to witness the fastest growth rate of over 14% during the period from 2024 to 2032 due to rapid industrialization, growing adoption of smart factory technology, and government initiatives to promote digital transformation. Several nations viz., China, Japan, and South Korea have approached Industry 5.0 applications, with massive investments. China has released its initiative called “Made in China 2025” which aims to upgrade manufacturing capabilities with AI, IoT, and robotics and is set to explode into opportunities. An enabler of Industry 5.0 is Japan’s Advanced Robotics Cluster, which consists of manufacturers such as FANUC and Kawasaki Robotics among many more. At the same time, South Korea's modernization of its semiconductor manufacturing via advanced AI and robotics has been driving the growth of the regional partner.
Key Players in Industry 5.0 Market
Some of the major players in the Industry 5.0 Market are:
-
ABB (Collaborative Robots, Industrial Automation)
-
Honeywell International Inc (Digital Twin Solutions, Process Automation)
-
3D Systems (3D Printers, Additive Manufacturing Solutions)
-
Rockwell Automation (Autonomous Robots, Smart Manufacturing Systems)
-
Siemens (Digital Twin, Industrial Sensors)
-
Emerson Electric Co (AI-Driven Control Systems, Industrial Automation)
-
General Electric (IoT Solutions, Digital Twin Technology)
-
Bosch (Robotic Systems, Smart Sensors)
-
Fanuc (Collaborative Robots, CNC Systems)
-
Stratasys Ltd. (3D Printing Solutions, Additive Manufacturing Materials)
-
Piher Sensing Systems (Sensors for Automation, Industrial Sensing Solutions)
-
Mitsubishi Electric (Automation Solutions, Collaborative Robots)
-
Cognex Corporation (Vision Systems, Robotics Solutions)
-
Intel Corporation (AI Chips, Industrial IoT Platforms)
-
FANUC Robotics (Automation Solutions, Collaborative Robots)
-
Yaskawa Electric Corporation (Robotics, Motion Control Systems)
-
KUKA (Robots for Manufacturing, Automated Handling Solutions)
-
ABB Robotics (Robotic Solutions, Smart Factory Solutions)
-
Schneider Electric (Energy Management Solutions, Automation Systems)
-
Rockwell Automation (Industrial Automation, AI-Driven Automation Solutions)
Some of the Raw Material Suppliers for Industry 5.0 Companies:
-
Albemarle Corporation
-
BASF
-
Dow Inc.
-
3M
-
DuPont
-
ArcelorMittal
-
Nippon Steel Corporation
-
Siemens Healthineers
-
Honeywell
-
Schneider Electric
RECENT TRENDS
-
In January 2024, ABB acquired Sevensense, a Swiss start-up specializing in AI-powered 3D vision navigation for autonomous mobile robots (AMRs). The acquisition strengthens ABB's robotics capabilities, particularly in autonomous navigation technology.
-
In August 2024, Intel unveiled its AI innovations at Hot Chips 2024, showcasing the Xeon 6 SoC and Gaudi 3 AI accelerator to optimize AI workloads. The company also introduced an optical compute interconnect chipset for high-speed data processing.
-
In October 2024, BlackBerry expanded its partnership with Intel to help manufacturers design and safety-certify industrial systems and robotics for Industry 5.0. This collaboration focuses on advancing AI-driven automation and secure solutions.
| Report Attributes | Details |
|---|---|
| Market Size in 2023 | USD 58.15 Billion |
| Market Size by 2032 | USD 673.18 Billion |
| CAGR | CAGR of 31.31% From 2024 to 2032 |
| Base Year | 2023 |
| Forecast Period | 2024-2032 |
| Historical Data | 2020-2022 |
| Report Scope & Coverage | Market Size, Segments Analysis, Competitive Landscape, Regional Analysis, DROC & SWOT Analysis, Forecast Outlook |
| Key Segments | • By Technology Type (Digital Twin, Artificial Intelligence (AI), Industrial Sensors, Augmented & Virtual Reality (AR/VR), Robots) • By Organization (Large Enterprise, Small and Medium Enterprise) • By Deployment Model (On-premises, Cloud-based, Hybrid) • By End Use (Automotive, Aerospace, Healthcare, Semiconductor & Electronics, Metals & Mining, Others) |
| Regional Analysis/Coverage | North America (US, Canada, Mexico), Europe (Eastern Europe [Poland, Romania, Hungary, Turkey, Rest of Eastern Europe] Western Europe [Germany, France, UK, Italy, Spain, Netherlands, Switzerland, Austria, Rest of Western Europe]), Asia Pacific (China, India, Japan, South Korea, Vietnam, Singapore, Australia, Rest of Asia Pacific), Middle East & Africa (Middle East [UAE, Egypt, Saudi Arabia, Qatar, Rest of Middle East], Africa [Nigeria, South Africa, Rest of Africa], Latin America (Brazil, Argentina, Colombia, Rest of Latin America) |
| Company Profiles | ABB, Honeywell International Inc, 3D Systems, Rockwell Automation, Siemens, Emerson Electric Co, General Electric, Bosch, Fanuc, Stratasys Ltd., Piher Sensing Systems, Mitsubishi Electric, Cognex Corporation, Intel Corporation, FANUC Robotics, Yaskawa Electric Corporation, KUKA, ABB Robotics, Schneider Electric, Rockwell Automation. |
| Key Drivers | • Collaborative Robots and Human Workforce Coexistence Drive Industry 5.0 Growth and Workplace Safety • Edge Computing Drives Efficiency and Real-Time Decision Making in Industry 5.0 with IoT and 5G |
| Restraints | • Bridging the Skills Gap and Overcoming Data Security Challenges in Industry 5.0 Adoption |
Frequently Asked Questions
Ans: North America dominated the Industry 5.0 Market in 2023.
Ans: The Large Enterprise segment dominated the Industry 5.0 Market in 2023.
Ans: The major growth factor of the Industry 5.0 market is the increasing integration of advanced technologies like AI, robotics, and IoT to enhance automation, productivity, and human-centric collaboration across industries.
Ans: Industry 5.0 Market size was USD 58.15 billion in 2023 and is expected to Reach USD 673.18 billion by 2032.
Ans: The Industry 5.0 Market is expected to grow at a CAGR of 31.31% during 2024-2032.
Get in Touch
