Graph Database Market Report Scope & Overview:
To Get More Information on Graph Database Market - Request Sample Report
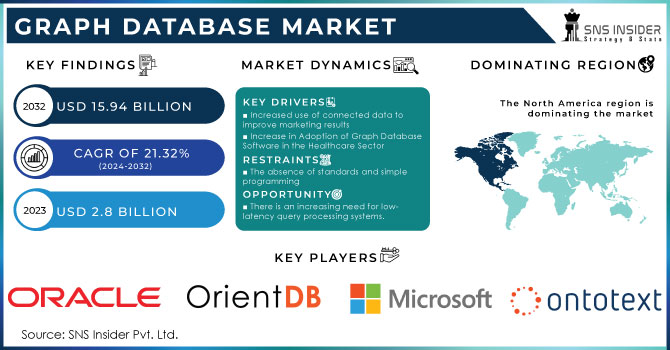
The Graph Database Market size was valued at US$ 2.8 billion in 2023 and is expected to reach US$ 15.94 billion in 2032 with a growing CAGR of 21.32 % over the forecast period 2024-2032.
Graph database represent a class of transactional technologies designed specifically for online transaction processing (OLTP) databases. The market for these databases is poised for significant growth, driven by the rising adoption of AI-based graph database services and tools. Additionally, the increasing demand for solutions capable of processing low-latency queries further contributes to this upward trend. Moreover, the urgent need to identify complex patterns and virtualize big data analytics is expected to play a pivotal role in propelling the graph database market forward in the near future.
Market Definition
A graph database is a particular kind of database that uses graph topologies for semantic searches and stores and represents data as nodes, edges, and properties. Each node represents an object between two nodes, and each edge represents a link or relationship between them. The technologies that convert relational online transaction processing (OLTP) databases into graph databases are called graph databases.
Market Dynamics
Drivers
-
Increased use of connected data to improve marketing results
-
Increase in Adoption of Graph Database Software in the Healthcare Sector
Graph database software plays a crucial role in the healthcare and life sciences sectors by efficiently recording and disseminating patient information. This technology is revolutionizing the way healthcare providers and patients access and share vital data. In fact, innovative start-ups in the healthcare industry are capitalizing on the power of graph database software to meet the unmet needs of their customers. One such example is Zephyr Health, a health-focused start-up that has successfully integrated graph database technology into its service offerings.
Furthermore, established healthcare organizations and institutions are embracing graph database tools to optimize their operations, enhance safety measures, reduce costs, and elevate the quality of patient care. This widespread adoption of graph database software is a testament to its effectiveness and potential to revolutionize the healthcare sector.
By leveraging graph database technology, healthcare providers can streamline their processes, ensuring that patient information is readily available to those who need it. This not only improves operational efficiency but also enhances patient safety and care. Additionally, the utilization of graph database software enables healthcare organizations to identify patterns and trends in patient data, leading to more accurate diagnoses and personalized treatment plans.
Moreover, the implementation of graph database software in the healthcare sector has proven to be cost-effective. By eliminating the need for multiple systems and databases, healthcare organizations can significantly reduce their expenses while improving data management and accessibility.
Restrains
-
The absence of standards and simple programming
Although theoretically NoSQL databases and graph databases must be run on a single machine because they cannot be implemented across a low-cost cluster. This is the cause of the network's rapid performance decline. Another potential drawback is that since there is no Standard Query Language (SQL) to retrieve data from graph databases, developers must write their queries in Java. This requires hiring expensive programmers, or they must use SparcQL or another query language designed to support graph databases, which would require learning a new skill. Because of this, graph database systems lack programming simplicity and standardization. Although there are graph database visualization tools on the market, they are still in the early stages of development.
Opportunities
-
Growing use of graph database tools and services powered by artificial intelligence (AI).
-
There is an increasing need for low-latency query processing systems.
-
Open knowledge networks' emergence
Challenges
-
Insufficient technical expertise is a common challenge faced by individuals or organizations.
Impact of the Russia-Ukraine
If companies that produce graph database software or hardware components have operations or suppliers in Ukraine or Russia, disruptions in the supply chain due to the conflict could lead to delays in product development or manufacturing.
The war can affect exchange rates and currency values, which, in turn, can impact the cost of technology imports and exports. Companies that rely on foreign markets for graph database sales could face challenges if exchange rates become volatile by 10%. The conflict might prompt organizations to reevaluate their data privacy and security measures. Graph databases are often used to analyze and manage sensitive data. An escalation in cyberattacks or concerns about data security could lead to an increased 6% demand for graph database solutions. Governments may impose new regulations or sanctions in response to the conflict. This could affect international trade and business operations, potentially impacting companies in the graph database market. The Russia-Ukraine war can change the priorities of industries and governments. For example, increased focus on national security might lead to higher demand for graph database solutions in defense and intelligence sectors. If the conflict escalates and disrupts global trade, it could have broader economic repercussions. A global economic downturn could reduce overall IT spending, which might affect the graph database market.
Impact of Recession
In times of economic uncertainty, businesses tend to prioritize cost efficiency and cost reduction 7.2% in many organizations. Graph databases, while powerful for certain use cases, can be perceived as more complex and potentially costly to implement and maintain compared to traditional relational databases. This might lead to a preference for more established and cost-effective database solutions. Graph databases are particularly suited for applications that involve complex relationships and interconnected data, such as social networks, fraud detection, and recommendation systems. During a recession, some of these use cases might see reduced activity, while others, like fraud detection, might become more critical. The net impact on the market will depend on the mix of use cases.
On the flip side, recessions can also spur innovation as companies seek more efficient and effective solutions to address their business challenges. Some organizations may turn to graph databases to gain a competitive advantage by better understanding their data and relationships within it. Companies that were considering adopting graph databases before a recession might delay their plans due to economic uncertainty. However, once economic conditions stabilize, they could resume or accelerate their adoption of these technologies, potentially leading to a rebound in the market.
Key Market Segmentation
By Component
-
Software
-
Services
By Deployment
-
Cloud
-
On-Premise
By Type
-
Relational (SQL)
-
Non-Relational (NoSQL)
By Application
-
Identity and Access Management
-
Customer Analytics
-
Recommendation Engine
-
Master Data Management
-
Privacy and Risk Compliance
-
Fraud Detection and Risk Management
-
Others
By Analysis Type
-
Community Analysis
-
Connectivity Analysis
-
Centrality Analysis
-
Path Analysis
By End User
-
Banking, Financial Services and Insurance (BFSI)
-
IT & Telecommunication
-
Retail
-
Healthcare
-
Life Science
-
Media & Entertainment
-
Government
-
Others
Regional Analysis
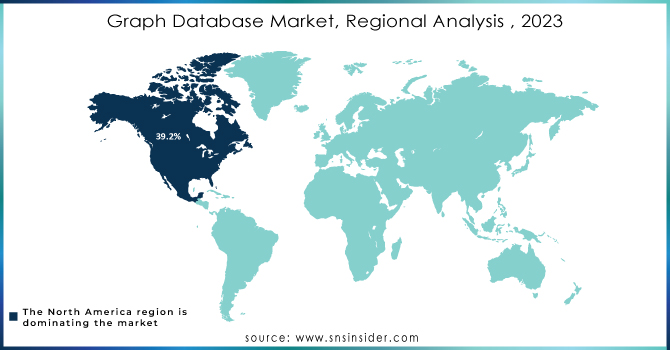
Due to the emergence of technology-based industries and businesses, graph database players in the region are expected to experience significant market growth. North America accounts for 39.2% of the global Revenue of the market. As most enterprises rely on data, this is driving the adoption of graph database services & and tools and related technologies. Additionally, vendor investments are boosting the market's expansion. For instance, California-based TigerGraph raised USD 33 million for graph database products.
Due to the development of IoT devices, industrial companies, and the emergence of artificial intelligence-based graph database providers, Asia Pacific is also anticipated to experience considerable growth in the graph database industry. Additionally, several Asian nations are using information-intensive technology to gain an advantage over rivals. These elements are more likely to produce opportunities for vendors of graph databases and fuel market expansion in the area. Due to the growing demand for improved data visualization tools, the Middle East and Africa are more likely to experience growth. In addition, a number of regional government initiatives are anticipated to fuel market expansion.
Do You Need any Customization Research on Graph Database Market - Enquire Now
REGIONAL COVERAGE:
North America
-
US
-
Canada
-
Mexico
Europe
-
Eastern Europe
-
Poland
-
Romania
-
Hungary
-
Turkey
-
Rest of Eastern Europe
-
-
Western Europe
-
Germany
-
France
-
UK
-
Italy
-
Spain
-
Netherlands
-
Switzerland
-
Austria
-
Rest of Western Europe
-
Asia Pacific
-
China
-
India
-
Japan
-
South Korea
-
Vietnam
-
Singapore
-
Australia
-
Rest of Asia Pacific
Middle East & Africa
-
Middle East
-
UAE
-
Egypt
-
Saudi Arabia
-
Qatar
-
Rest of Middle East
-
-
Africa
-
Nigeria
-
South Africa
-
Rest of Africa
-
Latin America
-
Brazil
-
Argentina
-
Colombia
- Rest of Latin America
Key Players:
The major players in market are Oracle Corporation, Ontotext, Orient DB, Hewlett Packard Enterprise, Microsoft Corporation, Teradata Corporation, Stardog Union Inc., Amazon Web Services, Inc., Objectivity Inc., MangoDB, TIBCO Software, Franz Inc., TigerGraph Inc., DataStax, IBM Corporation, Blazegraph, Openlink Software, MarkLogic Corporation, GraphBase, Neon4j Inc., ArangoDB, and others in final report.
Recent Development
MarkLogic Corporation released MarkLogic Data Hub Central in April 2021 with a no-code or low-code user interface. Through the introduction of MarkLogic, businesses now have a clear roadmap for modernizing their data infrastructure for the cloud.
The graph database from the firm, NEO4J version 4.3, was launched in June 2021. It includes minor upgrades that highlight earlier inventions. The most recent version boosts performance with new intelligent IO scheduling, relationship and relationship property indexes, faster write transaction throughput, graph data science, and parallelized backup.
A data lineage platform called MANTA established a strategic agreement with Neo4j in April 2021 to directly include Neo4j's graph database technology into MANTA's platform for pipeline analysis. As businesses continue their digital transformation, customers will be able to quickly process ever-larger volumes of data thanks to better graph database capabilities.
| Report Attributes | Details |
| Market Size in 2023 | US$ 2.8 Bn |
| Market Size by 2032 | US$ 15.94 Bn |
| CAGR | CAGR of 22.77 % From 2024 to 2032 |
| Base Year | 2023 |
| Forecast Period | 2024-2032 |
| Historical Data | 2020-2022 |
| Report Scope & Coverage | Market Size, Segments Analysis, Competitive Landscape, Regional Analysis, DROC & SWOT Analysis, Forecast Outlook |
| Key Segments | • By Component (Software, Services) • By Deployment (Cloud, On-Premise) • By Type (Relational (SQL), Non-Relational (NoSQL)) • By Application (Identity and Access Management, Customer Analytics, Recommendation Engine, Master Data Management, Privacy and Risk Compliance, Fraud Detection and Risk Management, Others) • By Analysis Type (Community Analysis, Connectivity Analysis, Centrality Analysis, Path Analysis) • By End User (Banking, Financial Services and Insurance (BFSI), IT & Telecommunication, Retail, Healthcare, Life Science, Media & Entertainment, Government, Others), |
| Regional Analysis/Coverage | North America (US, Canada, Mexico), Europe (Eastern Europe [Poland, Romania, Hungary, Turkey, Rest of Eastern Europe] Western Europe] Germany, France, UK, Italy, Spain, Netherlands, Switzerland, Austria, Rest of Western Europe]), Asia Pacific (China, India, Japan, South Korea, Vietnam, Singapore, Australia, Rest of Asia Pacific), Middle East & Africa (Middle East [UAE, Egypt, Saudi Arabia, Qatar, Rest of Middle East], Africa [Nigeria, South Africa, Rest of Africa], Latin America (Brazil, Argentina, Colombia Rest of Latin America) |
| Company Profiles | Oracle Corporation, Ontotext, Orient DB, Hewlett Packard Enterprise, Microsoft Corporation, Teradata Corporation, Stardog Union Inc., Amazon Web Services, Inc., Objectivity Inc., MangoDB, TIBCO Software, Franz Inc., TigerGraph Inc., DataStax, IBM Corporation, Blazegraph, Openlink Software, MarkLogic Corporation, GraphBase, Neon4j Inc., ArangoDB |
| Key Drivers | • Increased use of connected data to improve marketing results • Increase in Adoption of Graph Database Software in the Healthcare Sector |
| Market Restraints | • The absence of standards and simple programming |
Frequently Asked Questions
Ans. The major players in the market are Oracle Corporation, Ontotext, Orient DB, Hewlett Packard Enterprise, Microsoft Corporation, Teradata Corporation, Stardog Union Inc., Amazon Web Services, Inc., Objectivity Inc., MangoDB, DataStax, IBM Corporation, Blazegraph, Openlink Software, MarkLogic Corporation, GraphBase, Neon4j Inc., ArangoDB, and others in final report.
Ans: North American region is dominating the Graph Database Market
Ans: There are three options available to purchase this report,
A. Single User License USD 4650
Features: A non-printable PDF to be accessed by just one user at a time
1. No Excel would be delivered along with the PDF
2. 1 complimentary analyst briefing session of 30 minutes to be provided post-purchase and delivery of the study
3. 1 complimentary update to be provided after 6 months of purchase
4. Additional 80 analyst hours of free customization to add extra slices of information that might be missing from the study
B. Enterprise User License: USD 6,450
Features:
1. A printable/ sharable and downloadable PDF
2. No limit over the number of users
3. An Excel spreadsheet would be delivered along with the PDF
4. 2 complimentary analyst briefing sessions of 30 minutes each to be provided post-purchase and delivery of the study
5. 2 complimentary updates to be provided within 1 year of purchase
6. Additional 100 analyst hours of free customization to add extra slices of information that might be missing from the study.
C: Excel Datasheet: USD 2,325
1. ME sheet is provided in Excel format.
2. 1 complimentary analyst briefing session of 30 minutes to be provided post-purchase and delivery of the study
Ans. The CAGR of the Graph Database Market for the forecast period 2024-2032 is 21.32%.
Ans: The market is expected to grow to USD 15.94 billion by the forecast period of 2032.
Get in Touch
