LNG Supply Chain & Infrastructure Market Report Scope & Overview:
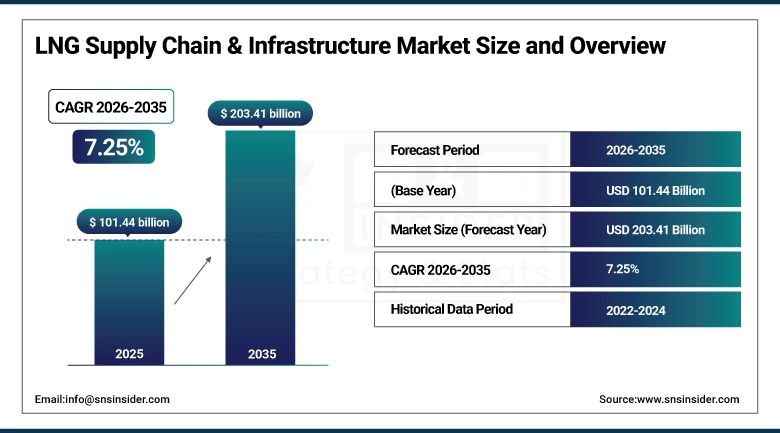
The LNG Supply Chain & Infrastructure Market size was valued at USD 101.44 Billion in 2025 and is projected to reach USD 203.41 Billion by 2035, growing at a CAGR of 7.25% during 2026–2035.
LNG turned natural gas from a regional commodity into a global one. Before commercial-scale liquefaction, gas moved through pipelines that tied producers to fixed buyers across fixed geography every major disruption had outsized consequences and no one had much flexibility. Cryogenic liquefaction broke that geography by converting gas into a liquid that ships like crude oil, letting buyers diversify supply sources and producers access markets no pipeline could reach.
Market Size and Forecast:
-
Market Size in 2025: USD 101.44 Billion
-
Market Size by 2035: USD 203.41 Billion
-
CAGR: 7.25% from 2026 to 2035
-
Base Year: 2025
-
Forecast Period: 2026–2035
-
Historical Data: 2022–2024
To Get more information on LNG Supply Chain & Infrastructure Market - Request Free Sample Report
Key LNG Supply Chain & Infrastructure Market Trends:
-
Europe's post-2022 LNG import acceleration is the single largest demand-side structural change in the global LNG market in a decade, with the continent building out floating storage and regasification unit (FSRU) capacity at a pace that has permanently altered the European gas infrastructure map.
-
Floating LNG (FLNG) production vessels are moving from novel technology into mainstream project execution, with multiple large-scale FLNG deployments in Australia, Mozambique, and Malaysia demonstrating that offshore liquefaction can be commercially and operationally competitive with onshore terminals in the right geology.
-
LNG as marine fuel (LNG bunkering) is scaling faster than any previous alternative marine fuel, with port bunkering infrastructure investment in Rotterdam, Singapore, and key Asian hubs creating a supply network that is making LNG a commercially viable option for newbuild vessel specifications across container, bulk, and cruise segments.
-
Modular and small-scale LNG infrastructure is enabling access for markets that cannot absorb the capital cost of conventional large-scale terminal development, opening city gas distribution and industrial fuel switching applications in Southeast Asia, Africa, and parts of Latin America that are not connected to gas pipeline networks.
-
Ammonia and hydrogen co-location at LNG terminals is emerging as a development pattern as project developers seek to future-proof large-scale terminal investments against energy transition risk by positioning liquefaction and regasification infrastructure as potential hubs for green molecule trade alongside conventional LNG.
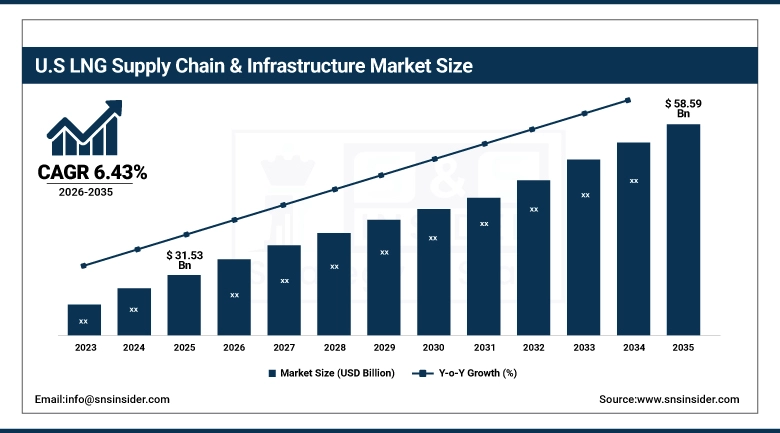
U.S. LNG Supply Chain and Infrastructure Market Size Outlook:
The U.S. LNG Supply Chain and Infrastructure Market was valued at USD 31.53 Billion in 2025 and is projected to reach USD 58.59 Billion by 2035, growing at a CAGR of 6.43% during 2026–2035. The U.S. has become the world's largest LNG exporter, with Gulf Coast liquefaction capacity at Sabine Pass, Corpus Christi, Freeport, and Cameron forming the export backbone.
LNG Supply Chain & Infrastructure Market Growth Drivers:
-
Europe's Structural LNG Import Dependency and Asia's Long-Term Demand Growth Are Sustaining Multi-Decade Investment Cycles Across Every Segment of the LNG Supply Chain
Two demand-side forces are sustaining LNG infrastructure investment at the current scale. The redirection of Russian pipeline gas that supplied roughly 40% of EU consumption before 2022 converted almost overnight from pipeline procurement into LNG import demand, and the FSRU deployments, pipeline interconnections, and import terminal expansions that followed created a structural change in European gas infrastructure that will take years to reverse. The second force is Asian long-term demand. China, India, South Korea, and Japan together represent the world's largest LNG import market, and none of them faces near-term reduction in import dependence. China's gas demand is growing as it substitutes gas for coal in power and industry; India is expanding import infrastructure to support diesel displacement in industrial and commercial use; Japan and South Korea run stable high-volume import programs tied to power generation baseload that will not change until nuclear restart and renewable capacity additions reach scales that reduce gas-fired generation requirements.
LNG Supply Chain & Infrastructure Market Restraints:
-
Project Financing Complexity, Construction Cost Inflation, and the Long-Horizon Risk of Energy Transition Policy Are Creating Investment Hesitation Across New LNG Infrastructure Commitments
LNG infrastructure project financing requires long-term offtake contracts and institutional lending at a scale that makes the financing community's risk tolerance highly consequential. That tolerance has tightened as energy transition policy has shortened assumed commercial operating lives in lender discount rate models a terminal with a 25-year life assumption pencils out differently than one assuming 35 years, and major multilateral lenders have progressively restricted LNG financing under ESG commitments and investor pressure. Construction cost inflation since 2020 steel, engineering labor, specialized equipment has lengthened project economics timelines and made some previously viable projects uneconomic at current gas price assumptions. These constraints are not preventing investment, but they are concentrating capital toward projects with the strongest offtake security and the most experienced developers, raising the barrier to entry for new participants.
LNG Supply Chain & Infrastructure Market Opportunities:
-
Small-Scale LNG, FSRU Deployment Flexibility, and Emerging Market Demand Are Opening Infrastructure Investment Pathways That Large-Scale Terminal Development Cannot Address
Small-scale LNG modular liquefaction, ISO container transport, and compact regasification is opening gas access for markets where conventional large-scale terminal development is not economically justifiable: Indonesia's outer islands, West African coastal cities, and parts of Latin America without pipeline infrastructure. FSRU technology has demonstrated that import terminals can be deployed in months rather than years, and a mature secondary FSRU market now allows developers to deploy, lease, and redeploy assets in ways that fixed onshore terminals cannot accommodate. LNG bunkering infrastructure growth is generating supply chain revenue independently of power and city gas markets, while ammonia and hydrogen co-location at LNG terminals is emerging as a development pattern as operators seek to future-proof large terminal investments against energy transition risk.
LNG Supply Chain & Infrastructure Market Segment Analysis:
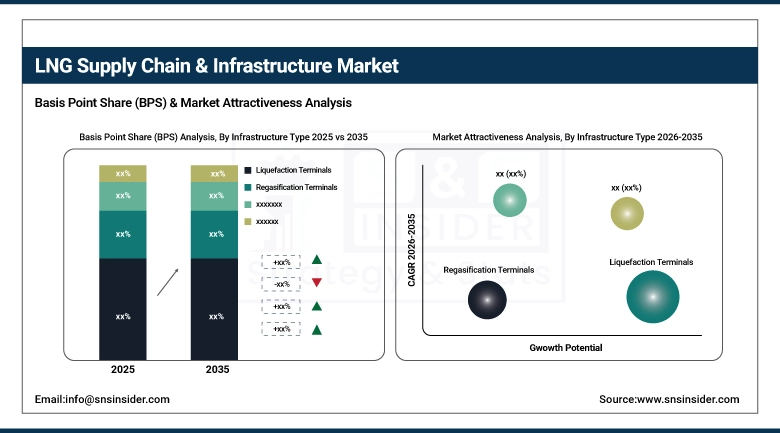
By Infrastructure Type: Liquefaction Terminals Lead While Regasification Terminals Register Strongest Growth Through 2035
Liquefaction Terminals (Export Terminals) dominated with a 34.28% share in 2025 at USD 34.77 Billion, while Regasification Terminals (Import Terminals, FSRUs) are expected to grow at the fastest CAGR of approximately 7.81% through 2035 at USD 27.55 Billion in 2025.
Liquefaction holds the leading infrastructure share because large-scale export terminal projects represent the highest single capital commitments in the LNG supply chain, with Train 1 through Train 6-scale facilities at locations like Sabine Pass and Qatar's North Field expansions generating capital expenditure that no other infrastructure category approaches on a per-project basis. Regasification and FSRU deployment is growing fastest because the European import acceleration and the expansion of Asian import capacity are simultaneously driving deployment at a rate that outpaces the slower-developing export side. FSRU deployments in particular generate infrastructure market revenue quickly because they convert from vessel to operational import terminal on compressed timelines.
By Supply Chain Stage: Midstream Leads and Drives Growth While Upstream and Downstream Scale in Support
Midstream (Liquefaction, Storage, Transportation, Trading) dominated with a 56.83% share in 2025 at USD 57.65 Billion, growing at a CAGR of approximately 7.73% through 2035. Midstream's commanding share reflects where the value concentration in the LNG supply chain sits: the liquefaction and shipping assets that transform pipeline gas into globally tradeable cargo are both the most capital-intensive and the most commercially central elements of the chain. Upstream (21.64%, USD 21.95 Billion, 6.46% CAGR) and Downstream (21.53%, USD 21.84 Billion, 6.67% CAGR) provide the feedstock and the consumption base that midstream infrastructure connects, but neither individually approaches midstream's scale or value concentration.
By Application: Power Generation Leads While Residential & Commercial Drives Fastest Growth Through 2035
Power Generation dominated with a 38.72% share in 2025 at USD 39.28 Billion, while Residential & Commercial (City Gas Distribution) is expected to grow at the fastest CAGR of approximately 7.95% through 2035. Power generation holds its leading application share because gas-fired power plants represent the largest single consuming end-market for LNG globally, absorbing import volumes in Japan, South Korea, and increasingly in South and Southeast Asia that dwarf any other application's scale. Residential and commercial city gas distribution is growing fastest because the expansion of gas access into urban populations in Asia, the Middle East, and Latin America that are currently underserved by gas pipeline networks represents a demand growth runway that developed market power generation does not have.
By End-User: Oil & Gas Companies Lead While Power Utilities Record Fast Growth Through 2035
Oil & Gas Companies dominated with a 41.36% share in 2025 at USD 41.96 Billion, growing at a CAGR of approximately 6.84% through 2035. Their market leadership reflects their role as the primary developers, owners, and operators of LNG infrastructure across the supply chain from upstream production through liquefaction and shipping to offtake agreements with downstream buyers. Power Utilities (27.48%, USD 27.88 Billion, 7.80% CAGR) are growing rapidly as regulated utilities in Europe and Asia sign long-term LNG supply contracts to replace coal and nuclear generation, and as independent power producers in emerging markets build gas-fired capacity anchored on LNG supply agreements.
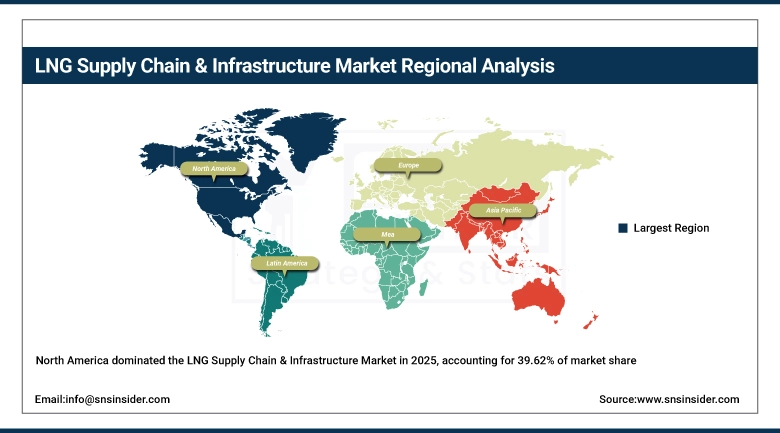
LNG Supply Chain & Infrastructure Market Regional Analysis:
North America LNG Supply Chain & Infrastructure Market Insights
North America dominated in 2025 at 39.62% of market share at USD 40.19 Billion, projected to reach USD 76.97 Billion by 2035 at a CAGR of 6.75%. The United States leads with 78.5% of North American share at USD 31.53 Billion, as the world's largest LNG exporter with Gulf Coast terminals serving European and Asian demand. Canada is growing faster at 7.85% CAGR, with LNG Canada's Pacific coast export facility positioning Canada as a supplier to Asian markets with shorter shipping distances than U.S. Gulf Coast routes.
Get Customized Report as per Your Business Requirement - Enquiry Now
Europe LNG Supply Chain & Infrastructure Market Insights
Europe is expected to grow at the fastest regional CAGR of approximately 8.35% from 2026 to 2035, rising from USD 20.47 Billion in 2025 to USD 45.48 Billion by 2035. Germany is the dominant national market, having gone from zero LNG import infrastructure before 2022 to an accelerated Floating Storage & Regasification Units (FSRU) deployment program and permanent onshore terminal construction at Brunsbüttel. The Netherlands and Belgium with the Gate Terminal in Rotterdam and Zeebrugge function as the primary LNG entry points into the European gas grid.
Asia Pacific LNG Supply Chain & Infrastructure Market Insights
Asia Pacific held a 25.47% share in 2025 at USD 25.84 Billion, projected to reach USD 54.74 Billion by 2035 at a CAGR of 7.84%. Japan is the dominant national LNG market by import volume, with JERA, Tokyo Gas, and Osaka Gas among the world's largest LNG buyers, underpinned by decades of mature import infrastructure. China is growing fastest within the region, expanding import terminal capacity and domestic distribution as it displaces coal in power and industrial applications.
Latin America and Middle East & Africa LNG Supply Chain & Infrastructure Market Insights
Latin America held a 5.21% share in 2025 at USD 5.29 Billion, expected to reach USD 10.33 Billion by 2035 at a CAGR of 6.97%. Brazil leads the Latin American market, using LNG imports to supplement hydroelectric power generation during drought years when reservoir levels constrain output. Argentina and Chile hold secondary positions. Middle East & Africa held a 9.52% share in 2025 at USD 9.66 Billion, growing at a slower 5.12% CAGR to USD 15.89 Billion by 2035. Qatar is the dominant market and the world's second-largest LNG exporter, with its North Field expansion programs driving the largest single LNG infrastructure investment program currently underway globally. The UAE and emerging African exporters including Mozambique, Tanzania, and Senegal add further regional investment activity.
Competitive Landscape for LNG Supply Chain & Infrastructure Market:
Cheniere Energy, Inc.
Cheniere Energy is the United States' first and largest LNG exporter, owning and operating the Sabine Pass LNG terminal in Louisiana and the Corpus Christi LNG terminal in Texas. Its integrated model spanning gas procurement, liquefaction, LNG marketing, and shipping logistics gives it commercial depth that pure infrastructure owners or pure LNG traders cannot match. Cheniere's contract portfolio is anchored by long-term SPAs with European utilities, Asian national oil companies, and independent power producers that provide cash flow predictability for operational management and capital planning.
In March 2025, Cheniere Energy announced a Final Investment Decision on Corpus Christi Stage 3, adding three new midscale liquefaction trains with combined capacity of approximately 10 million tonnes per annum, fully contracted at FID and projected to enter phased commissioning between 2027 and 2029.
QatarEnergy
QatarEnergy is Qatar's state-owned national oil company and the operator of the world's largest LNG export program, with integrated positions across upstream North Field gas production, six liquefaction trains at Ras Laffan, and equity stakes in import terminals across Europe and Asia. Its North Field expansion program will increase Qatar's total LNG export capacity to approximately 126 million tonnes per annum by the early 2030s, extending its position as one of the two largest global exporters alongside the United States.
In January 2025, QatarEnergy signed long-term LNG supply agreements with four major European utilities extending supply through 2044, covering deliveries into regasification terminals in Germany, France, the Netherlands, and Italy, as part of its strategy to secure European market share following the structural demand increase of 2022.
LNG Supply Chain & Infrastructure Companies are:
-
QatarEnergy
-
Chevron Corporation
-
Shell plc
-
China National Petroleum Corporation (CNPC)
-
TotalEnergies SE
-
ConocoPhillips
-
BP plc
-
Equinor ASA
-
Cheniere Energy, Inc.
-
Eni S.p.A.
-
Gazprom PJSC
-
Woodside Energy Group Ltd.
-
Petronet LNG Limited
-
Sinopec Group
-
Mitsui O.S.K. Lines (MOL)
-
NYK Line (Nippon Yusen Kabushiki Kaisha)
-
BW Group
-
MISC Berhad
| Report Attributes | Details |
|---|---|
| Market Size in 2025 | USD 101.44 Billion |
| Market Size by 2035 | USD 203.42 Billion |
| CAGR | CAGR of 7.25% From 2026 to 2035 |
| Base Year | 2025 |
| Forecast Period | 2026-2035 |
| Historical Data | 2022-2024 |
| Report Scope & Coverage | Market Size, Segments Analysis, Competitive Landscape, Regional Analysis, DROC & SWOT Analysis, Forecast Outlook |
| Key Segments | • By Infrastructure Type (Liquefaction Terminals (Export Terminals), Regasification Terminals (Import Terminals, FSRUs), LNG Storage Facilities (Onshore Tanks, Floating Storage), and LNG Transportation Infrastructure (Carriers, Pipelines, Trucking)) • By Supply Chain Stage (Upstream (Natural Gas Exploration & Production), Midstream (Liquefaction, Storage, Transportation, Trading), and Downstream (Regasification, Distribution, End-Use Consumption)) • By Application (Power Generation, Industrial Use (Petrochemicals, Fertilizers, Manufacturing), Residential & Commercial (City Gas Distribution), Transportation Fuel (Marine Bunkering, Heavy Vehicles)) • By End-User (Oil & Gas Companies, Power Utilities, Industrial Enterprises, and Government & Energy Agencies) |
| Regional Analysis/Coverage | North America (US, Canada), Europe (Germany, UK, France, Italy, Spain, Russia, Poland, Rest of Europe), Asia Pacific (China, India, Japan, South Korea, Australia, ASEAN Countries, Rest of Asia Pacific), Middle East & Africa (UAE, Saudi Arabia, Qatar, South Africa, Rest of Middle East & Africa), Latin America (Brazil, Argentina, Mexico, Colombia, Rest of Latin America). |
| Company Profiles | ExxonMobil Corporation, QatarEnergy, Chevron Corporation, Shell plc, China National Petroleum Corporation (CNPC), PetroChina Company Limited, TotalEnergies SE, ConocoPhillips, BP plc, Equinor ASA, Cheniere Energy, Inc., Eni S.p.A., Gazprom PJSC, Woodside Energy Group Ltd., Petronet LNG Limited, Sinopec Group, Mitsui O.S.K. Lines (MOL), NYK Line (Nippon Yusen Kabushiki Kaisha), BW Group, MISC Berhad. |
Get in Touch
