Logistics Automation Market Report Scope & Overview:
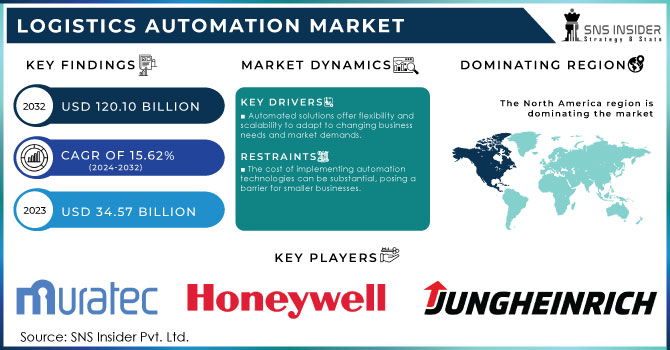
The Logistics Automation Market Size was valued at USD 34.57 Billion in 2023, and is expected to reach USD 120.10 Billion by 2032, and grow at a CAGR of 15.62% over the forecast period 2024-2032.
The expanding consumer tendency towards online shopping and rising demand for short delivery timelines is one of the major factors fueling the market's growth. Elevated consumer Expectations have led to a surge in fulfillment centers for last-mile and quick deliveries. Logistics providers are investing heavily in sorting systems, warehouse robotics, and warehouse management software. Fulfillment centers are gradually adopting automation, transitioning from mechanized assistance to fully operator-free equipment. As Autonomous vehicle and robotics systems mature with time, their applications in logistics and warehousing will broaden significantly and create growth opportunities for the logistics automation market during the forecast period.
The logistics automation market is experiencing robust growth which is also driven by increasing demand for efficiency and cost reduction in supply chain operations is a major driver, as businesses seek to streamline processes and minimize human error. The rapid expansion of e-commerce necessitates scalable and efficient logistics solutions to handle high volumes of orders and ensure timely delivery. Technological advancements in robotics, AI, and IoT are enhancing automation capabilities, offering real-time tracking and improved accuracy. Primarily, the need for better inventory management and data analytics is pushing the adoption of automated systems. As companies focus on optimizing their logistics operations, the market for logistics automation continues to expand, reflecting these growing demands and innovations.
Get more information on Logistics Automation Market - Request Free Sample Report
The logistics automation industry encounters numerous obstacles, such as ferocious market competition, insufficient industry standards, and a shortage of skilled workers required to manage sophisticated systems. The intricate nature of automation technology and software necessitates specialized knowledge, and the limited availability of trained professionals, especially in developing nations like India and China, can impede market expansion. Moreover, the lack of standardization makes it difficult to create consistent supply chain solutions, leading to increased costs for developing tailored systems.
Market Dynamics
Drivers
-
Automated solutions offer flexibility and scalability to adapt to changing business needs and market demands.
-
Automation can reduce operational costs over time by enhancing productivity and decreasing reliance on manual labor
-
The rise in online shopping requires efficient, scalable logistics solutions to manage high volumes of orders.
The surge in online shopping has led to an increased demand for logistics solutions that can efficiently handle large quantities of orders. To meet this demand, businesses need scalable systems that can adapt to fluctuating order volumes and ensure timely delivery. Efficient logistics solutions help streamline processes such as inventory management, order processing, and distribution. They also enable real-time tracking and reduce errors, which is essential for customer satisfaction. Scalable automation systems allow businesses to expand their operations without a corresponding rise in labor costs or operational complexity.
Automation can significantly reduce operational costs by boosting productivity and decreasing reliance on manual labor. By automating repetitive tasks and processes, businesses can streamline operations, minimize errors, and speed up workflows, which leads to higher efficiency. This reduces the need for a large workforce and associated labor costs, as machines and software handle many tasks more quickly and accurately than humans. Over time, the initial investment in automation technology is offset by the savings in labor costs and the gains from increased productivity. Consequently, automation not only helps in cutting expenses but also enhances overall operational performance, leading to long-term financial benefits for businesses.
Restraints
-
The cost of implementing automation technologies can be substantial, posing a barrier for smaller businesses.
-
There is a lack of trained professionals to manage and operate advanced automation systems.
-
Absence of uniform regulatory guidelines.
-
Integrating automation systems into existing infrastructure and processes can be difficult and disruptive.
Integrating automation systems with current logistics infrastructure and processes can be challenging and disruptive, as it often necessitates substantial modifications to existing workflows and equipment. This integration requires ensuring that new automated technologies are compatible with existing systems, which can be both intricate and time-consuming. The process may cause temporary delays or inefficiencies in ongoing operations as systems are adjusted or reconfigured. Additionally, employees might need training to operate the new technologies, which adds to the complexity of the transition. In summary, successful integration requires thorough planning and execution to minimize operational disruptions and achieve a smooth transition to automation in the logistics sector.
Logistics businesses are focused on enhancing supply chain efficiency to maximize profitability and viability. In the logistics industry, there is a requirement for common governance standards in the US and European countries, logistics standardization in Asian countries, such as China and South Korea, is limited due to the lack of government involvement and the lack of regional organizations capable of actively spearheading and coordinating multinational logistics standardization initiatives.
Segment Analysis
By Component
In 2023, the hardware segment dominated the market with a maximum revenue share of 66.6%. Automated Storage and Retrieval Systems (ASRS) is a system designed to automatically store and retrieve materials from designated storage locations. It comprises four main components: storage racks, input/output systems, storage and retrieval (S/R) equipment, and computer management systems.
The software segment is projected to expand at a CAGR of 15.2% throughout the forecast period. This segment is further categorized into warehouse management systems and transportation management systems. Warehouse management software, which automates and enhances various warehouse processes such as inventory tracking, storage, receiving, and workload planning, is anticipated to be the fastest-growing software solution during the forecast period.
By Function
The transportation management segment dominated the market and held the largest revenue share in 2023. As the adoption of advanced technologies in supply chain and logistics increases, the market is projected to experience significant growth during the forecast period. These systems have played a crucial role in planning, executing, and optimizing the transportation of goods. Additionally, they have proven highly valuable for documentation related to compliance within the supply chain and logistics processes.
The inventory & storage management segment is anticipated to grow at the fastest CAGR of 16.2% during the forecast period. The inventory & storage management includes automated retrieval systems and automated storage systems. automated retrieval systems handle the product dispatch from the warehouse while Autonomous storage systems enable the warehouses the automate storage crates or pallets on racks or shelves, Automating the inventory and storage process Facilitates and boosts the tracking and tracing of products in large warehouses.
By Type
With the largest revenue share in 2023, sales logistics dominated the market. Sales logistics is the most crucial aspect of the supply chain as it involves moving or delivering the goods to the end consumer. Sales logistics integrate order management, inventory management, vendor management, and shipping management.
The production logistics segment is projected to experience the highest CAGR during the forecast period. Companies are focusing extensively on optimizing production processes, such as time and cost efficiencies, to enlarge profitability. Production logistics contains inventory management of raw materials, transportation within the manufacturing unit, and distribution.
By Application
The order management segment, with the largest revenue share, dominated the market in 2023. Order management encompasses overseeing the entire lifecycle of an order, from entry and fulfillment to delivery and post-sale services. Its adoption is rising due to the visibility it provides to both businesses and customers.
The inventory management segment is anticipated to grow at the highest CAGR during the forecast period. Inventory management is a crucial component of logistics automation. Automation enhances inventory management by minimizing errors and boosting efficiency, it involves monitoring inventory levels, managing stock for each product, forecasting demand, and handling overall inventory accounting. Forecasting product demand based on historical sales data is highly advantageous for maintaining optimal inventory levels.
By Vertical
In 2023, the retail and e-commerce segments dominated the market and held the maximum revenue share. The sector employs logistics automation solutions to handle the rising volumes of orders and shipments. These solutions enhance reliability and guarantee timely delivery, which aligns with the needs of the retail and e-commerce industries.
The healthcare segment is expected to experience substantial growth throughout the forecast period. Logistics automation solutions tailored for the healthcare sector ensure the safe and secure handling, storage, and retrieval of products like pharmaceuticals and vaccines. The healthcare sector demands a high level of accuracy and accountability to ensure the safety of the products, and automation significantly helps to ensure it.
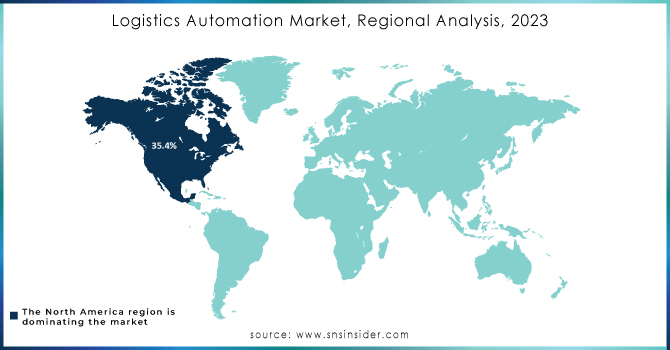
Regional Analysis
With a revenue share more than of 35.4%, North America led the logistics automation market in 2023. The region's growth can be linked to the presence of several logistics automation solution providers and several logistics companies, such as UPS, DHL, and FedEx Corporation, among others, in North America. Primarily, the speedy execution of modern technologies and the presence of modern infrastructure in the region a supportive factors in the growth of the target market. The U.S. is projected to maintain its dominance throughout the forecast period, driven by the rapid growth of the e-commerce sector in the country.
The logistics automation market in Asia-Pacific is anticipated to grow at the highest CAGR of 15.5% during the forecast period. The region is expected to undergo rapid economic expansion, particularly in the e-commerce sector. Additionally, Asia-Pacific comprises several key logistical hubs, including Singapore, Indonesia, China, India, and others.
Do You Need any Customization Research on Logistics Automation Market - Enquire Now
KEY PLAYERS
The major key players in the Logistics Automation Market are Murata Machinery, Ltd., Honeywell International Inc., Jungheinrich AG, Daifuku Co., Ltd., SSI Schaefer Group, Knapp AG, Mecalux, S.A., Kion Group AG, TGW Logistics Group GmbH, Beumer Group GmbH & Co. KG, Dematic Corp, and other players.
Recent Developments
In February 2024, Dematic announced a partnership with the Canadian logistics company Groupe Robert and launched Quebec's first fully automated cold storage facility for third-party logistics.
In May 2023, Swisslog Holding AG announced a partnership with Northern Tool + Equipment to deploy a Swisslog automation solution at their facility in Fort Mill, South Carolina, USA
| Report Attributes | Details |
| Market Size in 2023 | US$ 34.57 Bn |
| Market Size by 2032 | US$ 120.10 Bn |
| CAGR | CAGR of 15.62% From 2024 to 2032 |
| Base Year | 2023 |
| Forecast Period | 2024-2032 |
| Historical Data | 2020-2022 |
| Report Scope & Coverage | Market Size, Segments Analysis, Competitive Landscape, Regional Analysis, DROC & SWOT Analysis, Forecast Outlook |
| Key Segments |
• By Component (Hardware, Software, Services) • By Function (Inventory & Storage Management, Transportation Management) • By Type (Sales Logistics, Production Logistics, Recovery Logistics, Procurement Logistics) • By Application (Inventory Management, Order Management, Yard Management, Shipping Management, Labor Management, Vendor Management, Customer Support, Others) • By Vertical (Retail & E-commerce, Healthcare, Automotive, Aerospace & Defense, Electronics & Semiconductors, Others) |
| Regional Analysis/Coverage | North America (US, Canada, Mexico), Europe (Eastern Europe [Poland, Romania, Hungary, Turkey, Rest of Eastern Europe] Western Europe] Germany, France, UK, Italy, Spain, Netherlands, Switzerland, Austria, Rest of Western Europe]). Asia Pacific (China, India, Japan, South Korea, Vietnam, Singapore, Australia, Rest of Asia Pacific), Middle East & Africa (Middle East [UAE, Egypt, Saudi Arabia, Qatar, Rest of Middle East], Africa [Nigeria, South Africa, Rest of Africa], Latin America (Brazil, Argentina, Colombia Rest of Latin America) |
| Company Profiles | Murata Machinery, Ltd., Honeywell International Inc., Jungheinrich AG, Daifuku Co., Ltd., SSI Schaefer Group, Knapp AG, Mecalux, S.A., Kion Group AG, TGW Logistics Group GmbH, Beumer Group GmbH & Co. KG, Dematic Corp |
| Key Drivers | • Automated solutions offer flexibility and scalability to adapt to changing business needs and market demands. • Automation can reduce operational costs over time by enhancing productivity and decreasing reliance on manual labor • The rise in online shopping requires efficient, scalable logistics solutions to manage high volumes of orders |
| Market Restraints | •The cost of implementing automation technologies can be substantial, posing a barrier for smaller businesses. •There is a lack of trained professionals to manage and operate advanced automation systems. •Absence of uniform regulatory guidelines. •Integrating automation systems into existing infrastructure and processes can be difficult and disruptive. . |
Frequently Asked Questions
Ans. The inventory and storage management function is forecasted to register the highest CAGR of 11.93% from 2024 to 2032. The inventory & storage management ensures the stocks are maintained at optimum levels, and the demand for each product determines the stock levels.
Ans. The major factors attributing to the growth of the logistics automation market are the rapid growth of the e-commerce sector, which has led to a surge of e-commerce fulfillment centers, increasing adoption of automation equipment such as robots, conveyor systems, and storage systems, and supportive government initiatives to build a robust logistics infrastructure.
Ans. Major players operating in the logistics automation market include Dematic Corp., Daifuku Co. Limited, Swisslog Holding AG, Honeywell International Inc., Jungheinrich AG, Murata Machinery Ltd, and Knapp AG.
Ans. USD 120.10 Billion is the Company's projected Logistics Automation Market size by 2032.
Ans. The Compound Annual Growth rate for Logistics Automation Market over the forecast period is 15.62%.
Get in Touch
