Low GWP Refrigerants Market Size & Trends
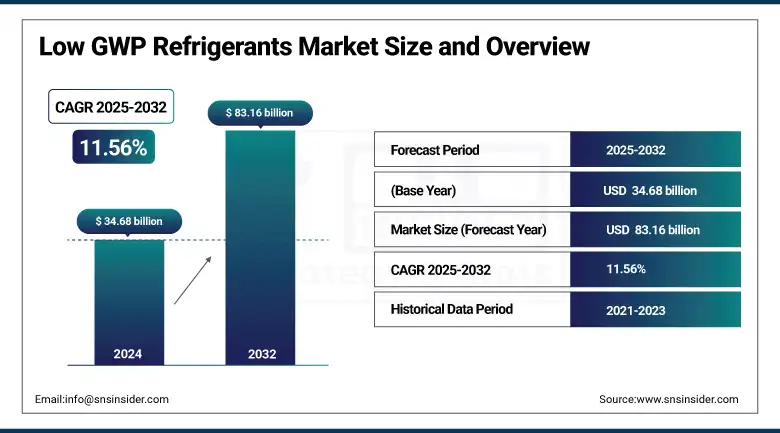
The Low GWP Refrigerants market size was valued at USD 34.68 billion in 2024 and is expected to reach USD 83.16 billion by 2032, growing at a CAGR of 11.56% over the forecast period of 2025-2032.
Regulations and increasing sustainable cooling demand propel the low GWP refrigerants industry. US EPA’s 2023 SNAP rule can limit high-GWP HFCs, driving the market for lower GWP options with a GWP of refrigerants that are less than 150. Honeywell, which is one of the low GWP refrigerants companies, is growing the HFO refrigerants industry, with a USD 1+ billion investment in Solstice production and collaboration with Bosch and Pure Harvest in the development of energy-efficient applications. The market trends for low GWP refrigerants also support natural refrigerants, particularly in commercial and farming domains.
To Get more information On Low GWP Refrigerants Market - Request Free Sample Report
The EPA states that 2020 HFC use and emissions were 309 million metric tons of CO2 equivalent (MMTCO2e), with HFC-134a being 24% of the total U.S. HFC market, with recovery rates under 2%. The expansion at Honeywell’s Baton Rouge more than doubled Solstice z output, underlining the leadership in the low GWP refrigerants market share and lending a hand to the growth of the low GWP refrigerants market size. These trends encourage a long term low GWP refrigerants market outlook and global penetration.
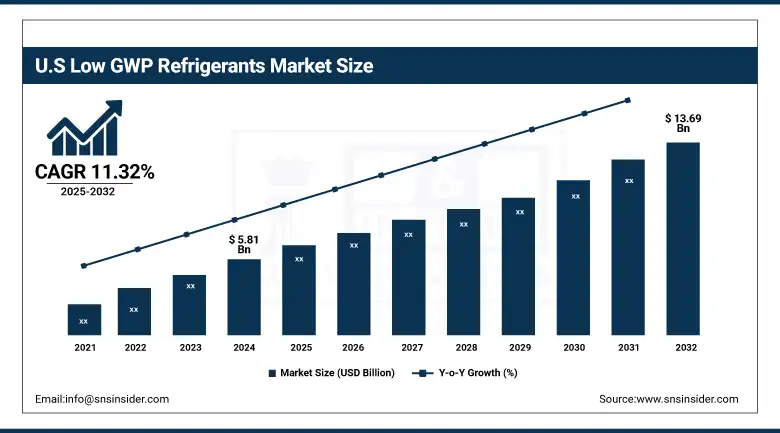
The U.S. leads North America’s Low GWP Refrigerants Market, valued at USD 5.81 billion in 2024 and projected to reach USD 13.69 billion by 2032, growing at a CAGR of 11.32%. This growth is fueled by stringent federal policies under the AIM Act aimed at phasing down HFCs, encouraging the adoption of natural refrigerants like hydrocarbons and CO₂. Major companies such as Honeywell and Chemours are advancing HFO technologies, supported by energy-efficient HVAC initiatives and AHRI standards, solidifying U.S. dominance in the market.
Low GWP Refrigerants Market Dynamics
Drivers:
-
Global regulatory mandates accelerate the transition to low global warming potential refrigerants
Stricter international regulations , such as the AIM Act in the U.S. and the Kigali Amendment, are propelling the growth of the low GWP refrigerants market. A statement and the regulations announced today will mandate a phasedown of the high global warming potential HFCs used in air-conditioners and refrigerants. The EPA, for instance, requires a 40% reduction in the use of HFCs by 2024. These changes are driving low GWP refrigerant manufacturers to explore other options, such as natural refrigerants and HFO refrigerants. The low GWP refrigerants market drivers and adoption trends in commercial refrigeration and HVAC sectors are largely driven by regulatory influence, with compliance deadlines looming.
-
Strategic partnerships and capacity expansions strengthen the supply and adoption of greener refrigerants
Low GWP refrigerant companies invest in partnerships and infrastructure to support growing demand. Examples of this trend include Honeywell’s USD 1 billion investment in Solstice® production and Bosch’s collaboration to develop energy-efficient heat pumps. Such efforts are increasing the presence of low-GWP options worldwide, thereby benefiting the low GWP refrigerants market trends. These additional capacity additions and technology transfer throughout OEM chains are needed for those higher penetration rates that, in turn, continue to strengthen the low GWP refrigerants market size and its stability. Higher cooperation also ensures the supply continuity and faster product certification, adding to the low GWP refrigerants industry trends.
Restraints:
-
Equipment compatibility challenges impede seamless replacement of legacy refrigerant systems
New systems are necessary for low GWP refrigerants because pressure levels, flammability, and oil incompatibility are different. This creates logistical issues for industries with existing HFC systems. Supermarkets, for instance, excuse themselves with the downtime risk when switching to the more environmentally friendly CO2-based systems. These barriers prevent a fast migration and worsen the low GWP refrigerants market analysis. The necessary upgrades in technology and safety certification make for a more expensive transition, up front, and one that takes longer. Therefore, end users often postpone replacement decisions, in particular in emerging countries, thus restraining the low GWP refrigerants market growth, despite significant regulatory and environmental drivers.
Low GWP Refrigerants Market Segmentation Analysis
By Type
Hydrocarbons captured a dominant market share of 44.6% in the low GWP refrigerants market in 2024, owing to low GWP and superior thermodynamic performance. Sub-segments such as isobutane and propane are gaining popularity in residential and commercial applications and providing energy efficiency and facilitating environmental goals. As Farnas Honeywell and Chemours continue to add to their offerings of HFO refrigerants and the like, hydrocarbons are still the natural option sought under global policies like the Kigali Amendment. Recommendations by organizations like the Air-Conditioning, Heating, and Refrigeration Institute (AHRI) are driving their penetration in developed and developing regions.
Simultaneously, hydrocarbons are also the fastest-growing segment with the highest CAGR of 11.78% over the forecast period of 2025 to 2032. Propane, in the lead among the growing number of options, stands out for safety, cost, and regulatory support. The U.S. Environmental Protection Agency also acknowledges propane and isobutane as acceptable alternatives and has ‘pumped’ the widespread adoption of these flammables, said Smith. These trends demonstrate ongoing movement towards sustainable refrigerant solutions at all levels.
By Application
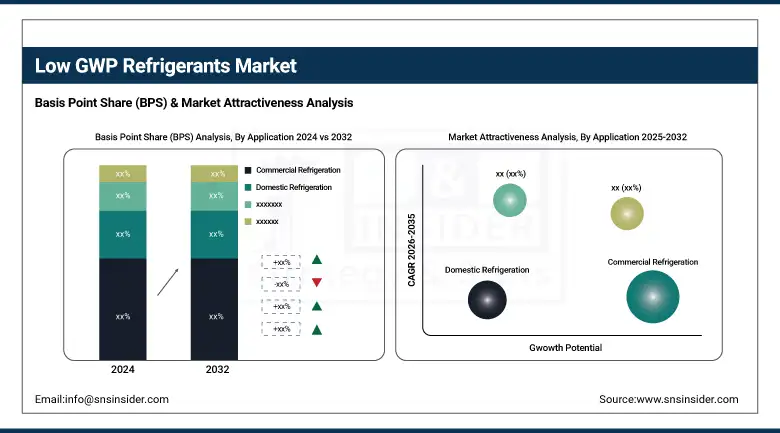
Commercial refrigeration dominated the low GWP refrigerants market in 2024 with a market share of 44.6%. Eco-friendly refrigerants in supermarkets, cold storage warehouses, and retail chains looking to minimize their carbon footprint are the major contributors to this segment’s growth. For example, Walmart and Kroger are investing in the installation of new refrigeration systems with natural refrigerants such as CO2 and hydrocarbons, in response to U.S. Environmental Protection Agency actions to phase down HFCs. The broad-based regulatory momentum, for example, from the AIM Act, is leading commercial refrigeration participants toward low GWP refrigerants and driving market trends and company investments around the world.
Industrial refrigeration is the fastest-growing segment with a CAGR of 12.1% in 2024, owing to increasing requirements in food processing, chemical, and pharmaceutical industries. In industrial applications, massive refrigeration machines use ammonia and HCs to render energy savings, as well as being in accordance with the many strict regulations of emissions. There are programs like the California Energy Commission’s Healthy Refrigeration Program that offer incentives for replacing older systems with more environmentally safe alternatives. These efforts are being combined with growing emphasis on sustainability in manufacturing, driving the growth of the low GWP refrigerants market and, consequently, industrial refrigeration as one of the most important subsegments amidst overall market dynamics.
Low GWP Refrigerants Market Regional Outlook
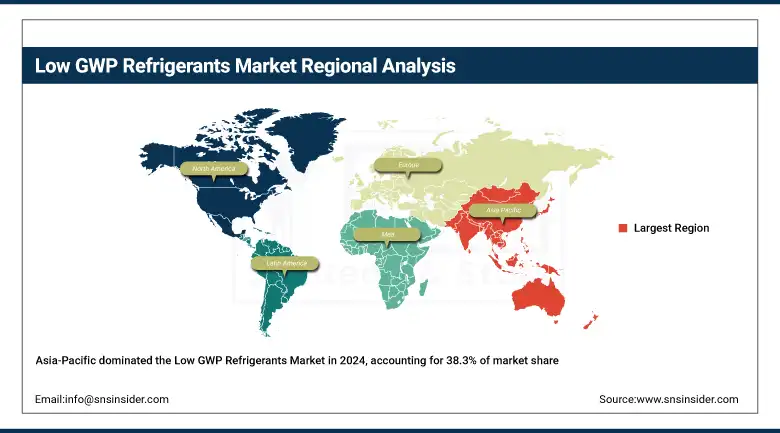
Asia Pacific is the dominating region in the low GWP refrigerants market with a 38.3% market share in 2024 and the fastest growth with the highest CAGR of 12.06% during the forecast period of 2025 to 2032. Rapid urbanisation, industrialisation, and growing environmental concern are driving the expansion. Government programmes such as India’s National Cooling Action Plan and China’s targets to cut energy intensity are encouraging natural refrigerants and HFO blends. The area houses many low-GWP refrigerant companies working on hydrocarbon and CO₂ refrigerants, with increasing demand for cleaner cooling solutions.
Get Customized Report as per Your Business Requirement - Enquiry Now
Asia Pacific is dominated by China, with aggressive policies favoring low GWP refrigerants. In addition, the Ministry of Ecology and Environment has limited the use of high-GWP HFCs and has provided subsidies to natural refrigerants for commercial and industrial use. Large Chinese companies such as Gree Electric Appliances are promoting the inclusion of hydrocarbons and HFOs in their ranges with the help of subsidies from the government, as well as pilot projects. China has shown the strategic convergence of regulatory push and corporate investment in the low GWP refrigerants market growth.
North America holds a significant 24.2% market share in the low GWP refrigerants market in 2024, owing to the stringent regulations, for instance, the U.S. Environmental Protection Agency's Safety at Work, Adv health Aus tre of refrigeration, Australian r of alternatives to high GWP refrigerants. The HVAC and refrigeration industries are wizards of creating local solutions, adopting natural refrigerants as well as HFO blends to comply with the Kigali Amendment deadlines for lowering their carbon footprints. Market work is also supported by industry associations such as the Air-Conditioning, Heating, and Refrigeration Institute (AHRI) through standards and certification programmes to increase low-GWP refrigerant use.
Low GWP Refrigerants Market Key Players
The major low GWP refrigerants market competitors include Honeywell International Inc., The Chemours Company, DAIKIN INDUSTRIES, Ltd., Arkema S.A., Orbia (formerly Mexichem/Koura), Linde plc, Sinochem Holdings, A-Gas, Zhejiang Sanmei Chemical Incorporated Company, and Air Liquide.
Recent Developments in the Low GWP Refrigerants Market
-
In May 2025, Arkema launched new Forane low GWP refrigerants like R-454B and R-513A, offering up to 50% GWP reduction, supporting HVACR industry shifts and regulatory compliance through a Honeywell partnership.
-
In July 2024, Honeywell provided Solstice L40X to Actrol in Australia, enabling ultra-low GWP cooling solutions, reducing emissions, and aligning with national goals to cut refrigerant-related emissions by 85% by 2036.
| Report Attributes | Details |
|---|---|
| Market Size in 2024 | USD 34.68 billion |
| Market Size by 2032 | USD 83.16 billion |
| CAGR | CAGR of 11.56% From 2025 to 2032 |
| Base Year | 2024 |
| Forecast Period | 2025-2032 |
| Historical Data | 2021-2023 |
| Report Scope & Coverage | Market Size, Segments Analysis, Competitive Landscape, Regional Analysis, DROC & SWOT Analysis, Forecast Outlook |
| Key Segments | •By Type (Inorganics [Ammonia, Carbon Dioxide, and Others], Hydrocarbons [Isobutane, Propane, Butane, Ethane, and Others], Fluorocarbons [Hydrofluorocarbon (HFCs), and Hydrofluoroolefin (HFOs)]) •By Application (Industrial Refrigeration, Commercial Refrigeration, Domestic Refrigeration, and Others) |
| Regional Analysis/Coverage | North America (US, Canada, Mexico), Europe (Germany, France, UK, Italy, Spain, Poland, Turkey, Rest of Europe), Asia Pacific (China, India, Japan, South Korea, Singapore, Australia, Rest of Asia Pacific), Middle East & Africa (UAE, Saudi Arabia, Qatar, South Africa, Rest of Middle East & Africa), Latin America (Brazil, Argentina, Rest of Latin America) |
| Company Profiles | Honeywell International Inc., The Chemours Company, DAIKIN INDUSTRIES, Ltd., Arkema S.A., Orbia (formerly Mexichem/Koura), Linde plc, Sinochem Holdings, A-Gas, Zhejiang Sanmei Chemical Incorporated Company, and Air Liquide |
Frequently Asked Questions
Global regulatory mandates like the U.S. AIM Act and Kigali Amendment are accelerating the Low GWP Refrigerants Market growth by phasing down high-GWP HFCs.
Hydrocarbons dominated the Low GWP Refrigerants Market share in 2024 with 44.6% due to their low global warming potential and energy efficiency.
Commercial refrigeration captured 44.6% of the Low GWP Refrigerants Market share due to supermarket and retail adoption of CO? and hydrocarbon systems.
Asia Pacific held 38.3% of the Low GWP Refrigerants Market share in 2024, driven by urbanization and initiatives like India’s Cooling Plan and China’s CO? policies.
Major Low GWP Refrigerants Market players include Honeywell, Chemours, Daikin, Arkema, and Orbia, investing in Solstice, HFOs, and natural refrigerant portfolios.
Get in Touch
