Low Profile Additives Market Report Scope & Overview:
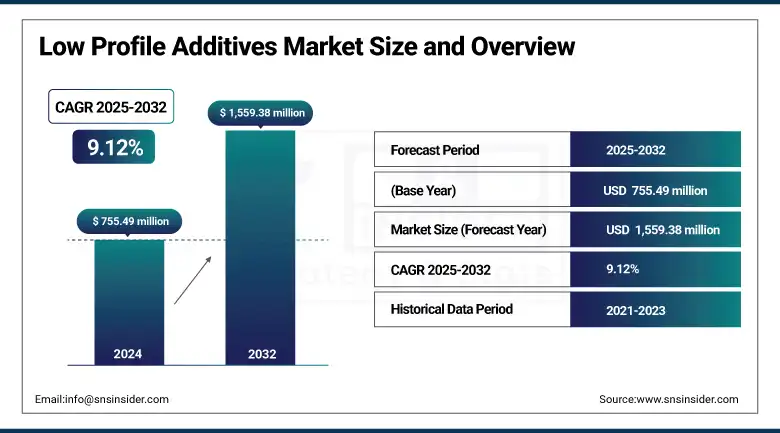
The Low Profile Additives Market size was valued at USD 755.49 million in 2024 and is expected to reach USD 1,559.38 million by 2032, growing at a CAGR of 9.12% over the forecast period of 2025-2032.
The market for fiberglass-reinforced plastics that utilize low-profile additives for polyester resin systems and vinyl ester resin additives is growing, due in large part to lightweighted automotive and electric vehicle platforms designed for improved fuel economy. Within the construction aspect of the industry, these can be seen in the form of FRP façade panels, which have anti-shrinkage and pigmentation capabilities and demonstrate some of the main trends and advancements in the low-profile additives market. Recyclable composites development is being driven by sustainability initiatives, such as the 2025 study on fiber-reinforced composites conducted by NASA Glenn, headquartered in Cleveland, Ohio, U.S., and the University of Alabama.
To Get more information On Low Profile Additives Market - Request Free Sample Report
As stated in an INEOS Composites statement in late March 2025, its composites business, including low profile additives, posted sales of more than €800 million throughout 17 locations worldwide. The American Composites Manufacturers Association reported expanding usage of FRP in bridge rehabilitations, thereby offering impetus to low profile additives market. Key global participants in low profile additives market for vinyl ester resin additives are making strategic collaborations to boost the low profile additives market size. Altogether, such dynamic factors give a strong outlook to the market analysis of the low profile additives and growth.
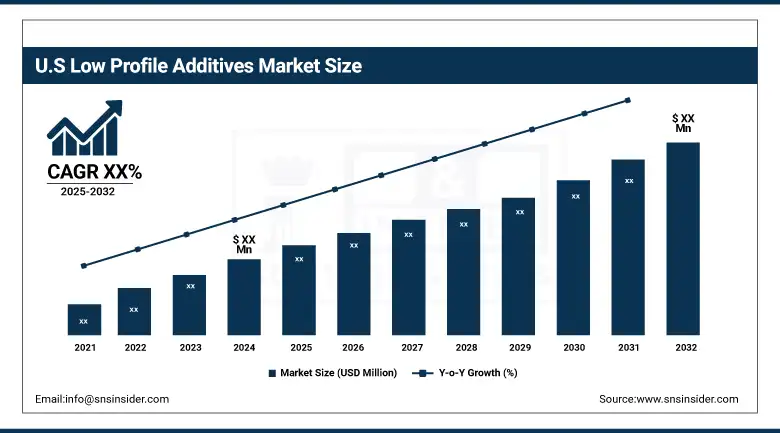
The U.S. dominates the North American low profile additives market, contributing nearly 80% of the regional share. The US Department of Energy is promoting the use of lightweight composites for automotive and aerospace use, which supports the increased use of low profile additives in vinyl ester resin and fiber-reinforced plastics. The US market was further bolstered by a 9% increase in composite utilization, with composites in the automotive industry led by federal support for sustainable manufacturing and lightweight vehicle design.
Low Profile Additives Market Drivers:
-
Rising electric vehicle adoption fuels demand for lightweight composite materials
Global electric vehicle sales topped the mark of 17 million units in 2024, thereby significantly fuelling demand for low profile additives for polyester resin systems, fiberglass-reinforced plastics, and vinyl ester resin additives. Car companies are using these materials more and more in battery housings and body panels in order to meet fuel economy targets. The International Energy Agency reports that electric vehicle sales increased by 35% in Q1 2025, which bolsters a robust growth of the low-profile additives market, market size growth, and product development for the market leaders in low profile additives companies.
-
Sustainability mandates boost the development of recyclable composites with advanced additives
A 2025 NASA-University of Alabama research showed 95% fiber reclamation of recyclable FRP with the aid of specialized low profile additives for polyester resin systems. This is in line with the U.S. EPA’s target to divert 50% of composite waste by 2030. These environmental considerations are driving low profile additives market trends and the development of greener vinyl ester resin additives. These activities support the growth of low profile additives market and the competitive position of such environmentally oriented low profile additives companies in the world.
Low Profile Additives Market Restraints:
-
Supply-chain bottlenecks for specialty resin intermediates constrain production scale-up
Shortage of supplies of intermediates for propylene oxide and polymethyl methacrylate has curtailed resin production and, correspondingly, the availability of low profile additives. Closures by LyondellBasell and Covestro in Europe in March 2025 took 10% of feedstock capacity from the market, which led to longer lead times and increased flexibility to access import volumes with high tariffs. It is these constraints that restrict the market share of low profile additives and hinder scalability for low profile additives businesses. These disturbances are projected to restrict low profile additives market size in lucrative regions such as Asia and Europe.
Low Profile Additives Market Segmentation Analysis:
By Product
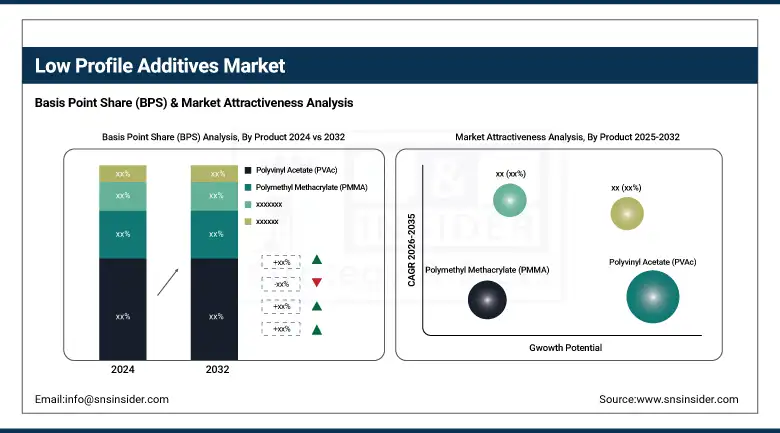
Polyvinyl acetate dominated and accounted for 43.5% of the low profile additives market share in 2024. In automotive and construction composites, FRP (fiberglass-reinforced plastics), PVAC improves surface quality. The American Composites Manufacturers Association reported this week that the automotive industry in the U.S. increased its intake of composites by 11% in the first quarter of 2024. This is a trend that is catching low profile additives market soaring and is consolidating PVAc’s position in finish control.
Polymethyl methacrylate recorded the highest CAGR of 9.61% in the forecast period of 2025 to 2032, owing to its copolymer compositions used in transparent and UV-resistant composites. Commonly used in electronic and medical grade FRP (Fiberglass Reinforced Plastics), PMMA additives aid in clarity and heat resistance. In its February 2024 bulletin, the Food and Drug Administration of the United States reported an increasing use of PMMA in the housings of surgical instruments and dental materials. This observation correlates with the low profile additives market trends in both medical and consumer applications.
By Function
Anti-shrinkage held 52.0% of the low profile additives market share in 2024, with thermoset polyester systems leading this category. Dimensionally stable additives are essential for precision parts in automotive and structural engineering. The use of anti-shrinking additives in fiberglass-reinforced utility housings and electrical enclosures saw increased penetration according to a 2024 U.S. DOE advanced materials report. These polyester resin system low profile additives help provide control of dimensions and a similar surface appearance, which further contributes to the low profile additives market analysis and applications.
Pigmentation registered the fastest CAGR of 9.81% % in the forecast period of 2025 to 2032. This trend is driven by increasing demand for architectural panels with enduringly beautiful color. In 2024, 17% of LEED-certified projects used colored fiberglass-reinforced plastics on the exterior, according to the U.S. Green Building Council. These are factors that are driving up the importance of pigmentation in the low profile additives market size, as businesses are working on formulating these to support design and sustainability requirements.
By Application
Sheet and bulk molding compounds dominated with 46.8% of the low profile additives market share in 2024, especially in glass-mat SMCs. These systems are important for automotive, marine, structural, and industrial panels. AM Bulletin adds that a university study found a 13% increase in the year-over-year use of SMC for truck hoods and marine decks in the fourth quarter of 2024. Low profile polyester resin systems additives enhance the surface finish and reduce porosity, which adds to their attractiveness in high-throughput markets.
Pultrusion registered a CAGR of 9.6% % in the forecast period of 2025 to 2032. It is suitable for the power grid, construction, and transportation fields. low profile additives can reduce the surface waviness and shrinkage of the material. Pultruded composite beams for bridge retrofits increased 19% per the U.S. Department of Transportation's 2024 infrastructure update. This validates the segment’s lead in the low profile additives market growth on big, high-growth infrastructure projects.
Low Profile Additives Market Regional Outlook:
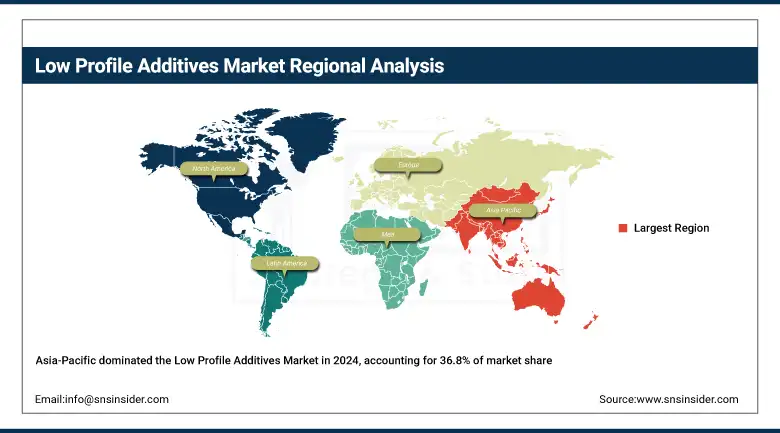
Asia Pacific leads the low profile additives market with a 36.8% share in 2024 and is the fastest-growing region with the highest CAGR of 6.13% % in the forecast period of 2025 to 2032. The growth is propelled by fast urbanization, projects in infrastructure, and the expansion of the automotive industry. For this year, the group China Composites announced a 12% growth in the production of fiberglass-reinforced plastics, mainly serving the wind energy and construction industries. Demand for low profile additives is on the rise, driven by the region’s emphasis on energy efficiency, complemented by the use of lightweight composites in transportation and building materials.
Get Customized Report as per Your Business Requirement - Enquiry Now
China dominates the Asia Pacific low profile additives market, holding approximately 40% of the regional share. The Ministry of Industry and Information Technology (MIIT) reported a 15% increase in composite applications in 2024, vinyl ester resin additives rising rapidly for wind power generators and new energy vehicles. The Chinese Wind Energy Association in February said it would continue to invest in fiberglass-reinforced plastics used in the production of rotor blades, in line with the national drive towards green infrastructure and carbon neutrality. These trends place China as a significant regional market growth driver.
North America accounted for a significant 25.1% share of the low profile additives market in 2024. The market in the region is heavily influenced by an established automotive and construction industry, the latter of which requires low profile additives to manufacture lightweight and durable components through glass-reinforced plastics. The American Composites Manufacturers Association (ACMA) recently cited 8.5% growth for composites in 2024, specifically in polyester resin systems and vinyl ester resin additives, as industries seek to achieve sustainability goals and lower emissions in major infrastructure and manufacturing uses.
Low Profile Additives Market Companies are:
The major low profile additives market competitors include BASF SE, Wacker Chemie AG, Polynt-Reichhold Group, Ashland Global Holdings Inc., Arkema, Swancor Holding Co., Ltd., AOC, LLC, Allnex, Satyen Polymers Pvt. Ltd., and HK Research Corporation.
Recent Developments:
-
In March 2025, INEOS Composites (under KPS ownership) reported composite business sales exceeding €800 million annually, reflecting strength in resins and low-profile additives
-
In May 2025, Wacker announced mechanical completion of new plants in Zhangjiagang to produce silicone fluids, emulsions, and elastomer gels crucial for composite additives
| Report Attributes | Details |
|---|---|
| Market Size in 2024 | USD 755.49 million |
| Market Size by 2032 | USD 1,559.38 million |
| CAGR | CAGR of 9.12% From 2025 to 2032 |
| Base Year | 2024 |
| Forecast Period | 2025-2032 |
| Historical Data | 2021-2023 |
| Report Scope & Coverage | Market Size, Segments Analysis, Competitive Landscape, Regional Analysis, DROC & SWOT Analysis, Forecast Outlook |
| Key Segments | •By Product (Polyvinyl Acetate (PVAc), Polymethyl Methacrylate (PMMA), Polystyrene (PS), and Others) •By Function (Anti-shrinkage, and Pigmentation) •By Application (Sheet Molding Compounds (SMC)/Bulk Molding Compounds (BMC), Pultrusion, Resin Transfer Molding, and Others) |
| Regional Analysis/Coverage | North America (US, Canada, Mexico), Europe (Germany, France, UK, Italy, Spain, Poland, Turkey, Rest of Europe), Asia Pacific (China, India, Japan, South Korea, Singapore, Australia, Rest of Asia Pacific), Middle East & Africa (UAE, Saudi Arabia, Qatar, South Africa, Rest of Middle East & Africa), Latin America (Brazil, Argentina, Rest of Latin America) |
| Company Profiles | BASF SE, Wacker Chemie AG, Polynt-Reichhold Group, Ashland Global Holdings Inc., Arkema, Swancor Holding Co., Ltd., AOC, LLC, Allnex, Satyen Polymers Pvt. Ltd., and HK Research Corporation |
Get in Touch
