Master Recharge API Market Report Scope & Overview:
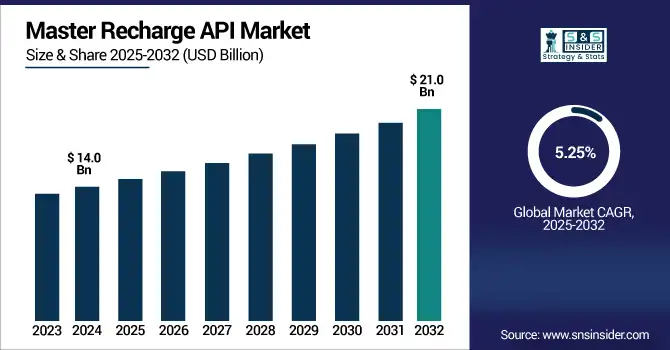
The Master Recharge API Market size was valued at USD 14.0 billion in 2024 and is expected to reach USD 21.0 billion by 2032, growing at a CAGR of 5.25% during 2025-2032.
To Get more information on Master Recharge API Market- Request Free Sample Report
The Master Recharge API Market growth is driven by the need for centralized digital payment solutions over mobile recharges, utility bill payments, DTH, and insurance services are increasing. Increasing use of smartphones, rising internet penetration, and growing availability of fintech platforms are propelling the growth of the market. According to recent Master Recharge API Market Analysis, the market is estimated to observe a modest CAGR during the forecast period and is expected to grow on account of API-based automation, real-time transaction processing, and integration with digital wallets and UPI systems. Emerging master recharge API market trends, white-label API platforms in the Master Recharge API Market, rural digitalization initiatives, and AI-driven fraud prevention tools. Future market opportunities aided and abetted by government-sponsored financial inclusion programs and the rising trend for scalable, secure, and mobile-first payment infrastructures are estimated to play a major role in helping push the market over the USD 20 billion threshold by 2032.
The U.S. Master Recharge API Market was estimated to be valued at USD 4.1 billion in 2024. The market is slated to grow at a lucrative CAGR of 4.96% throughout the forecast period, and is anticipated to reach around USD 6.1 billion by 2032. The growth is driven by the adoption of digital payments, an increase in API based fintech integration, and an increase in mobile users.
Market Dynamics:
Drivers:
-
Growing Digital Payment Adoption Leads to Increased Demand for Unified Recharge APIs Enabling Seamless Transactions
Since Master Recharge APIs handle financial data and personal user information, security vulnerabilities are a huge concern. Second, the risk of data breaches, unauthorized access, and API misuse could dissuade small businesses and financial institutions from adopting these solutions fully. Threats: APIs without strong authentication protocols, encryption mechanisms, and security audits are open to cyberattacks. Moreover, the sometimes evolving regulatory frameworks like GDPR and CCPA set high standards in terms of data privacy, and those regulations create additional complexities during implementation. If not managed by service providers carefully, this can delay the adoption, increase compliance costs, resulting in a loss of end-user trust.
According to a study, more than 63 billion digital payment transactions were recorded globally via mobile and API-based platforms in Q4 2024 alone
Restraints:
-
Rising Data Privacy and Security Concerns Limit Adoption of Recharge APIs Among Users and Businesses
As Master Recharge APIs deal with sensitive financial data and personal user information, security vulnerabilities pose a major concern. The risk of data breaches, unauthorized access, and API misuse may deter small businesses and financial institutions from fully adopting these solutions. Without robust authentication protocols, encryption mechanisms, and regular security audits, the APIs remain vulnerable to cyberattacks. Additionally, evolving regulatory frameworks such as GDPR and CCPA require compliance with strict data privacy standards, adding complexity to implementation. This can slow down adoption rates, increase operational costs for compliance, and ultimately reduce the trust of end-users if not handled properly by service providers.
A 2024 IBM Security report found that 76% of API-based data breaches in the finance and telecom sectors stemmed from inadequate authentication and encryption protocols.
Opportunities:
-
Limited Financial Access in Rural Areas Presents New Opportunities For API-Driven Digital Recharge and Payment Services
Master Recharge API providers have a huge opportunity to enter the rural and underbanked market, where brick-and-mortar financial infrastructure is still scarce. These regions are ideal for the integration of API base recharge and payment services owing to increasing mobile connectivity and digital literacy. This trend is further reinforced by governments and NGOs promoting digital inclusion by incentivizing digital transactions and enabling local entrepreneurs via digital kiosks and agent banking modalities. This could facilitate low-cost micro-transactions such as mobile recharges, bill payments, and financial services in real-time through an API platform – thus helping in financial inclusion. This expansion will increase the market footprint and revenue streams, especially for API service providers.
For Instance, in 2024, the number of mobile money accounts in rural regions increased by 19% year-over-year, driven largely by API-integrated platforms.
Challenges:
-
Lack of System Interoperability Complicates Integration of APIs Into Diverse and Legacy Platforms
While Master Recharge APIs have their benefits, integration with existing legacy systems is a major area of concern. Most small and mid-sized service providers run on very old infrastructure, which cannot converse through the new standard APIs. Further, fragmentation in telecom operator protocols, bilateral billing systems, and sub-standardized transaction standards between regions add complexity in smooth API integration. Technical problems such as downtime, latency, and data mismatch potentially limit user experience and service availability. The absence of a standard framework, both on-device and across multiple platforms, could lead to endless implementation timelines and higher expenses for businesses. Addressing these challenges entails extensive API documentation, strong developer support, and ongoing system updates from different stakeholders.
Segmentation Analysis:
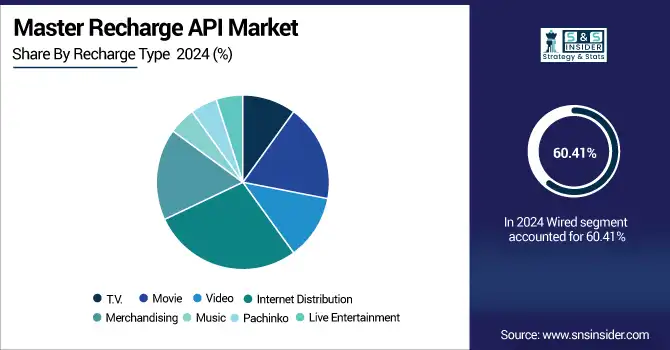
By Recharge Type:
Internet Distribution dominated the market in 2024 and accounted for 28% of master recharge API market share, owing to the growing population using the internet worldwide, growing consumption of data packs, and increasing consumption of OTT content. As mobile-first economies and digital inclusion policies evolve, this segment will continue to hold its own. Continuous improvement on telecom infrastructure and gradual implementation of 5G will increase the frequency of recharge and the number of API transactions , leading up to 2032.
For Instance, In February 2024, NTT DOCOMO collaborated with AWS to develop its 5G Open RAN core, facilitating seamless integration of internet services through telecom APIs powered by cloud-native infrastructure.
Live Entertainment is expected to register the fastest CAGR owing to the growing demand for access to concerts and sports, and virtual events in real-time, using recharge-enabled APIs. Growth is being driven by the post-pandemic digital habits, micro-ticketing, and recharge functionality in-app. The segment will gain from the integration of immersive tech (AR/VR) by 2032 & additional monetization of API-enabled platforms in emerging markets.
By Application:
Action & Adventure dominated the master recharge API market share in 2024 and accounted for a significant revenue share, due to high user engagement, mass appeal, and integration with gaming and streaming services. Recapping the APIs with pay-per-view and subscription models has proven rather popular. In 2032, we will see growth continuing as content providers further enhance their global reach towards multi-language support and mobile-first viewing experiences, due to the expansion of a digital audience.
Sci-Fi & Fantasy is expected to register the fastest CAGR during the forecast period, attributed to growing fandom communities, the release of exclusive content, and storytelling formats. The trend of recharges for episodic access via API and merchandise bundling is also on the rise. Enhanced user spending and engagement, particularly with Gen Z and millennial consumers in developed and emerging markets, will be driven by augmented reality capabilities and platform partnerships by 2032.
By Payment Method:
Debit Cards dominated the master recharge API market and accounted for a significant revenue share in 2024, owing to easy banking penetration, user-friendly nature, and high trust among users for recharge-related transactions. It is not surprising, however, that banks are aggressively marketing API integrated debit services with OTP based security. The segment, which is projected to lead through 2032, will continue to be supported by rural banking expansion as well as new card-linked APIs that provide loyalty, lower transaction costs, and cross-platform interoperability.
In April 2024, the Reserve Bank of India mandated that from August 2025, only card issuers and networks can store card-on-file data, requiring payment aggregators to delete all stored debit and credit card details.
UPI is expected to register the fastest CAGR, driven by immediate, low-cost transactions and increasing adoption across mobile-first economies. Supportive infrastructure from the government and easy API integrations with recharge platforms have grown usage rapidly. The UPI will now grow due to voice-activated payments, offline UPI modes, and usage expansions in micro-transactions, subscriptions, and API-based automation by 2032.
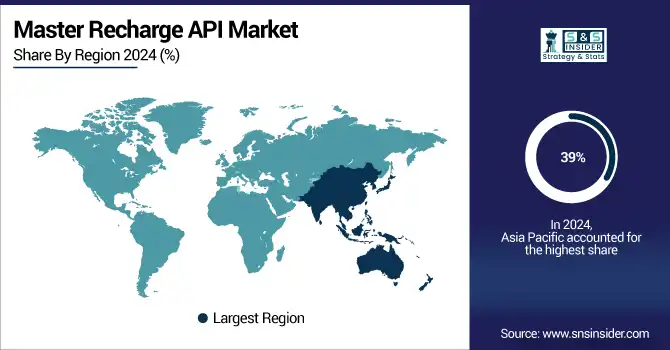
Regional Analysis:
Asia-Pacific dominated the master recharge API market in 2024 and accounted for 39% of revenue share, owing to high penetration of mobile, widespread use of prepaid services, and strong government support for digital payments in the Asia-Pacific region. API integration in the telecom and utility sectors has been mainly triggered by countries such as India, China, and Indonesia. Infrastructure development, rural digitalization, and fintech innovation will likely maintain regional leadership in recharge API by 2032.
According to the Worldline India Digital Payments Report, UPI transaction volume surged from 8.03 billion in January 2023 to 13.9 billion in June 2024, while the value rose from ₹12.98 trillion to ₹20.07 trillion
The Middle East & Africa are projected to register the fastest CAGR, an increase in mobile connectivity in economies such as Israel, the UAE, and others. the global trends towards financial inclusion are expected to boost this region. Governments Are Spending on Digital ID and Payment Systems. Demand for recharge API will grow tremendously by 2032 in the region that includes telecom, electricity, and micro-insurance services, especially among the underserved population in rural areas.
Growth in Europe is driven by increasing digital banking penetration, rising mobile subscriptions, and demand for secure, real-time API transactions. By 2032, expanding 5G infrastructure and eSIM adoption will further enhance API use in recharges, enabling seamless telecom and utility payment automation.
Germany leads the European master recharge API market due to high fintech adoption, strong telecom infrastructure, and a growing prepaid user base. With rising demand for API-based service bundling and enterprise recharge automation, Germany is expected to sustain dominance through innovations in digital ID, PSD2 compliance, and open banking.
Get Customized Report as per Your Business Requirement - Enquiry Now
Key Players:
The major master recharge API market companies are Recharge99, EzzyPay, SmartPay, Novopay, RechargeItNow, Mobisoft Technology, XPay Wallet, RECHARGEHUB, Ezytm, CyberPlat and others
Recent Developments:
-
In January 2025, CyberPlat integrated blockchain technology into its recharge API infrastructure to enhance transaction transparency, improve data security, and ensure tamper-proof auditing.
-
In June 2024, SmartPay released version 4.7, introducing a new criteria object in its MIT and subscription checkout APIs, enabling merchants to attach custom metadata to recharge transactions.
-
In February 2025, SmartPay launched version 4.9, adding custom footer image support in its checkout UI, integrating new payment methods like PayU BLIK and PayU Bank Transfer, and enhancing widget security
|
Report Attributes |
Details |
|
Market Size in 2024 |
US$ 14.0 Billion |
|
Market Size by 2032 |
US$ 21.0 Billion |
|
CAGR |
CAGR of 5.25% From 2025 to 2032 |
|
Base Year |
2024 |
|
Forecast Period |
2025-2032 |
|
Historical Data |
2021-2023 |
|
Report Scope & Coverage |
Market Size, Segments Analysis, Competitive Landscape, Regional Analysis, DROC & SWOT Analysis, Forecast Outlook |
|
Key Segments |
• By Recharge Type (T.V., Movie, Video, Internet Distribution, Merchandising, Music, Pachinko, Live Entertainment) |
|
Regional Analysis/Coverage |
North America (US, Canada, Mexico), Europe (Germany, France, UK, Italy, Spain, Poland, Turkey, Rest of Europe), Asia Pacific (China, India, Japan, South Korea, Singapore, Australia, Rest of Asia Pacific), Middle East & Africa (UAE, Saudi Arabia, Qatar, South Africa, Rest of Middle East & Africa), Latin America (Brazil, Argentina, Rest of Latin America) |
|
Company Profiles |
Recharge99, EzzyPay, SmartPay, Novopay, RechargeItNow, Mobisoft Technology, XPay Wallet, RECHARGEHUB, Ezytm, CyberPlat and others in the report |
Frequently Asked Questions
Asia-Pacific region dominated the Master Recharge API Market with 39% of revenue share in 2024.
Internet Distribution dominated the market in 2024 and accounted for 28% of the master recharge API market share
Growing Digital Payment Adoption Leads to Increased Demand for Unified Recharge APIs Enabling Seamless Transactions
The Master Recharge API Market size was valued at USD 14.0 billion in 2024 and is expected to reach USD 21.0 billion by 2032
The expected CAGR of the Master Recharge API Market over 2025-2032 is 5.25%.
Get in Touch
