image

MEMS Variable Optic Attenuators (mVOA) Market Report Scope & Overview:

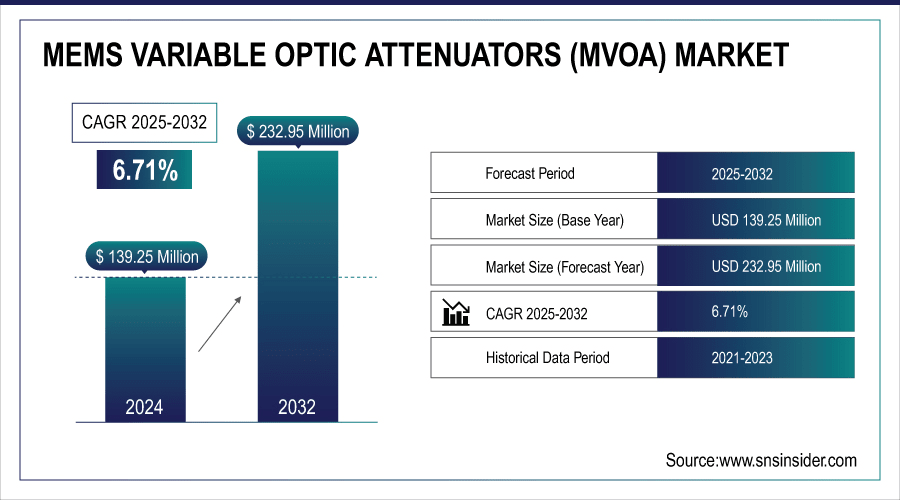
The MEMS Variable Optic Attenuators (mVOA) Market Size was valued at USD 139.25 million in 2024 and is expected to reach USD 232.95 million by 2032 and grow at a CAGR of 6.71 % over the forecast period 2025-2032.

The global market is driving strong growth based on growing optical network installations, escalating bandwidth needs and the cloud required signal attenuation and control accuracy that the mVOA provides, making the mVOA a key element in several high growth markets. The growing 5G momentum, surging demand in data centers and proliferation of photonics in IoT and AI are additionally driving global demand.
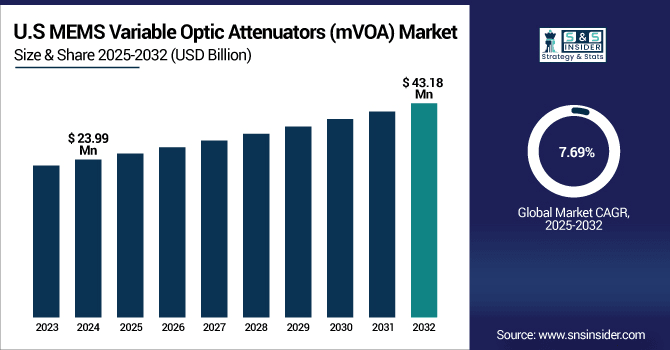
The U.S. MEMS Variable Optic Attenuators (mVOA) Market size was USD 23.99 million in 2024 and is expected to reach USD 43.18 million by 2032, growing at a CAGR of 7.69 % over the forecast period of 2025–2032.

The US MEMS Variable Optic Attenuators (mVOA) Market growth is fueled by high-speed internet demand, larger fiber optic networks, and quick 5G uptake. These developments demand highly accurate optical signal control and are driving an increasing demand in the telecom infrastructure and data transmission space for mVOA’s. Furthermore, growing deployment of defense communications and cloud services are also driving the market growth.
Market Dynamics

Key Drivers:

  • Growing demand for compact, low-power optical components in advanced telecom infrastructure accelerates mVOA market growth.

Compact and power-efficient components are increasingly demanded in the next-generation telecom infrastructure, for high density integration and lowering system cost. The MEMS-based VOAs, small in size and low in power consumption, are ideal devices to meet the demands. High mechanical stability and rapid response time make the two platforms good candidates for 5G, FTTH and other high-speed data transmission applications. As worldwide optical networks advance, more MEMS-based components are being included by operators, and this is driving demand and a market for mVOAs in high-performance telecommunications systems.

According to research, MEMS VOAs typically consume up to 50% less power compared to traditional VOAs, reducing operational costs and heat generation.

Restrain:

  • Complex packaging and reliability challenges hinder widespread deployment across varying environmental conditions.

Advanced packaging technologies are necessary for MEMS-based optical attenuators to ensure device performance and to protect delicate microstructures from environmental factors, such as temperature changes, humidity, and mechanical vibration. Long-term reliability in severe environments especially when installed outdoors or in industrial settings, has yet to be effectively addressed. In addition, the packaging must accommodate low insertion loss and accurate alignment, adding to the complexity. These reliability and packaging constraints can limit deployment in applications that require ultra-ruggedized devices, hindering the market penetration into the larger industrial and defense applications.

Opportunities:

  • Increasing integration of photonic components in AI, IoT, and quantum computing offers new application avenues for mVOAs.

Integrating optical systems in AI, IoT, quantum computing and other next-generation devices is advancing, generating new needs for precision optical control. Such advanced photonic circuits can be well-adapted by the MEMS VOAs, which offer a fast-response time and high-accurate attenuation. The new areas can only be realized with small-footprint, low-latency, and high dynamic-range components for signal control and management, and mVOAs will be a key part of the hardware that can meet these requirements. As these sectors continue to develop, there is a huge, undervalued market potential for ground-breaking new applications of mVOA, outside of traditional telecom.

According to research, Low-latency optical components like MEMS VOAs can reduce data transmission delays by up to 50% compared to electronic-only systems.

Challenges:

  • Technological complexity in MEMS design and fabrication leads to longer development cycles and higher defect rates.

The complexity of MEMS micro-fabrication and design processes is a major contributing factor to lengthy product development cycles. Obtaining the necessary accuracy in the use of moving parts at the micro level requires sophisticated machinery and quality checks at every step. This complexity results in increased defect rates and decreased yields especially as production is scaled. As a consequence, it is difficult for vendors to balance performance and cost, delaying time-to-market and causing innovation cycles to lock down for highly competitive mVOA market.

Segment Analysis:

By Type

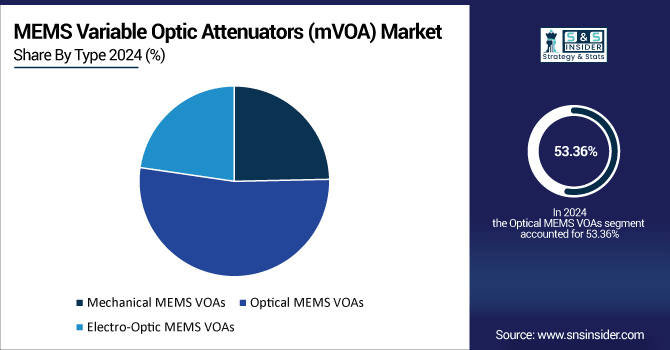
Optical MEMS VOAs segment dominated the MEMS Variable Optic Attenuators (mVOA) Market in 2024 with a revenue share of 53.36%. This is because the design and manufacturing process of these filters is expected to be accurate/compact and these filters to be used in high density wavelength division multiplexing (DWDM) systems, respectively. These properties make them good candidates for application in the emerging advanced optical communication networks where they are used as tunable optical filters. Their minimal power consumption and ease of integration in complex photonic circuits continue to fuel their demand in high data rate (and high speed network environments such as telecom and enterprise infrastructure applications.

Mechanical MEMS VOAs segment is expected to grow at the fastest CAGR of 7.98% from 2025 to 2032 due to their simpler structures, lower cost, and applicability to simple optical attenuation tasks. Players such as Accelink Technologies are also increasingly adding products in this space to support regional network’s cost-sensitive demands. These attenuators are widely used in small and medium form-factor pluggable devices, and in low-cost markets. They perform very well in milder environments, require minimal maintenance, and attract manufacturers’ interest.
By Application

The telecommunications segment held the largest revenue share of 41.20% in 2024, because of the significance of mVOAs in order to preserve signal quality in growing fiber optic networks. Due to increasingly high requirements for broadband and high-speed mobile services, thuse the mVOA are more and more deployed by telecom operators for intelligent signal processing and dynamic power control. In such applications (which support 5G-based next process for next generation network) their support to real-time network is necessary from real-time performance perspective for getting high quality of transmission.

The data centers segment is projected to grow at the fastest CAGR of 8.35% from 2025 to 2032, driven by the massive growth in cloud computing, AI workloads and hyperscale storage demand. MEMS Variable Optic Attenuators (mVOA) Companies like Coherent Corp. (formerly II‐VI Incorporated) provide precision MEMS VOAs specifically designed for high status density. The mVOAs play a key role in maximizing the optical signal routing, power balancing and system performance of high-density data applications. Their capacity to control the optical power very precisely allows greater energy efficiency, but also faster data transfer.

By End-Use Industry

Telecommunications service providers dominated the MEMS Variable Optic Attenuators (mVOA) Market share of 33.89%  in 2024, because of extensive implementation of fiber-optic networks and high demand for flexible signal management devices. mVOAs help these operators improve the quality of the network, lower latency, and deliver a consistent level of service.  As carriers further scale up 5G / IPTV and broadband infrastructure, they are rolling out mVOAs as a way to provide advanced traffic load balance and bandwidth scaling capabilities, whether in urban or rural deployments.

The government and defense segment is expected to grow at the fastest CAGR of 8.11% from 2025 to 2032, due to increasing expenditure on safe, high-speed communication systems. Helping to enable these applications, EMCORE Corporation is now offering specialized optical MEMS devices for defense applications. Precise and reliable optical control is required for military and defense applications, to include surveillance and satellite, and tactical communication networks. MEMS VOAs combine the performance, smallness, and ruggedness required for mission critical services.

Regional Analysis:

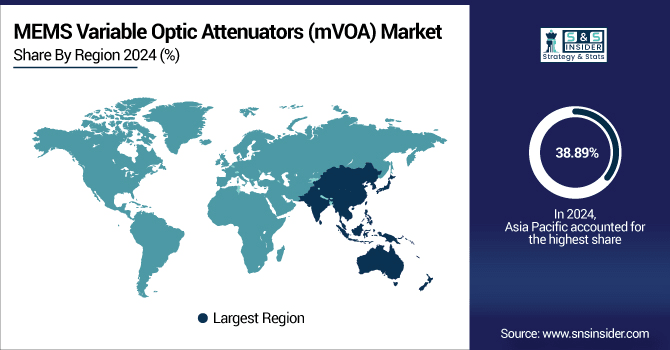
Asia Pacific dominated the MEMS Variable Optic Attenuators (mVOA) Market with the highest revenue share of about 38.89% in 2024. This is driven by rapid growth in telecom sector, ongoing fiber optic deployment and huge presence of electronics manufacturing in countries such as China, Japan and South Korea. Governments in the area are in the process of heavy investment in the next-generation network infrastructure, based on 5G and optical broadband. Moreover a large pool of skilled labor and cost effective production environment gives a further leg up to Asia Pacific in the global mVOA market.
  • China leads the Asia Pacific MEMS Variable Optic Attenuators (mVOA) market due to its strong telecommunications infrastructure, vast 5G roll-out, strong government backing, and the existence of leading manufacturers of optical components to scale up production and provide faster technology uptake.

North America is projected to witness the fastest CAGR of 8.31% from 2025 to 2032, fueled by its sophisticated technology environment and accelerated pace of digital adoption. Increasing data center expansion, and increasing deployment of 5G networks and government investments in secure communication systems are driving the demand for mVOA. The U.S. has many of the world’s top manufacturers of optical components and R&D centers, encouraging innovation and performance capable solutions. Strategic alignments and defence communications requirements also enhance the region's potential for long-term growth.

  • US dominance in North America MEMS Variable Optic Attenuators market is attributed to advanced technology infrastructure, extensive fiber optic networks and high government investments in the secure communication. Its development centers and large industry parties promote the development and application of advanced optical solutions and serve as an engine for the growth of the market.

Europe is a major market for the MEMS Variable Optic Attenuators (mVOA), due to the rising investments in telecom infrastructure and smart city programs. Robust emphasis on innovation, favorable government initiatives and increasing penetration of fiber optic networks across nations such as Germany, France and UK stimulate demand. These characteristics of the region also help to pave the way for the growth of the market, due to their focus on energy-saving and high-performance optical devices.

  • Germany has the highest market share in the European MEMS Variable Optic Attenuators (mVOA) market with its well-developed telecom infrastructure and huge amount of R&D funding. Early implementation of fiber optic networks and emphasis on innovation are boosting the demand for high-performance optical components in a wide range of industries.

The Middle East & Africa MEMS Variable Optic Attenuators is being aided by the growing telecom infrastructure in UAE and Saudi Arabia and backed by smart city projects. In Latin America, Brazil is leading and expanding the adoption with broadband networks, with investments to upgrade optical communications technology packages in countries like Argentina and other countries to cope with increasing data demand.

Key Players:

Major Key Players in MEMS Variable Optic Attenuators (mVOA) Market are Lumentum Holdings Inc., II-VI Incorporated (Coherent Inc.), Finisar Corporation, Furukawa Electric Co., Ltd., Oplink Communications, Gould Fiber Optics, Micron Optics (Luna Innovations), Aurrion, Inc. (Juniper Networks), Avago Technologies (Broadcom Inc.), NeoPhotonics Corporation and others.

Recent Development:

  • June 2024, Accelink Technologies: Launched Low-Insertion-Loss MEMS VOAs tailored for data centers, improving optical attenuation precision, reducing signal loss, and supporting the expanding demand for faster, reliable high-speed telecom network infrastructure.

  • August 2023, EMCORE Corporation: Introduced Advanced MEMS Optical Modulators and VOAs to enhance telecom network performance by improving signal quality, dynamic range, and enabling efficient optical power control in fiber optic systems.

MEMS Variable Optic Attenuators Market Report Scope:

Report Attributes Details
Market Size in 2024 USD 139.25 Million 
Market Size by 2032 USD 232.95 Million 
CAGR CAGR of 6.71% From 2025 to 2032
Base Year 2024
Forecast Period 2025-2032
Historical Data 2021-2023
Report Scope & Coverage Market Size, Segments Analysis, Competitive Landscape, Regional Analysis, DROC & SWOT Analysis, Forecast Outlook
Key Segments • By Type (Mechanical MEMS VOAs, Optical MEMS VOAs, Electro-Optic MEMS VOAs)
• By Application (Telecommunications, Data Centers, Cable Television, Military and Aerospace, Medical Devices)
• By End-Use Industry (Telecommunications Service Providers, Government and Defense, CATV service providers, Enterprise Networks)
Regional Analysis/Coverage North America (US, Canada, Mexico), Europe (Germany, France, UK, Italy, Spain, Poland, Turkey, Rest of Europe), Asia Pacific (China, India, Japan, South Korea, Singapore, Australia,Taiwan, Rest of Asia Pacific), Middle East & Africa (UAE, Saudi Arabia, Qatar, South Africa, Rest of Middle East & Africa), Latin America (Brazil, Argentina, Rest of Latin America)
Company Profiles Lumentum Holdings Inc., II-VI Incorporated (Coherent Inc.), Finisar Corporation, Furukawa Electric Co., Ltd., Oplink Communications, Gould Fiber Optics, Micron Optics (Luna Innovations), Aurrion, Inc. (Juniper Networks), Avago Technologies (Broadcom Inc.), NeoPhotonics Corporation

Frequently Asked Questions

Ans: The MEMS Variable Optic Attenuators (mVOA) Market is expected to grow at a CAGR of 6.71 % from 2025-2032.

Ans: The MEMS Variable Optic Attenuators (mVOA) Market size was USD 139.25 million in 2024 and is expected to reach USD 232.95 million by 2032.

Ans: The major growth factor of the MEMS Variable Optic Attenuators (mVOA) Market is the increasing demand for high-speed data transmission and expanding telecom networks.

Ans: Optical MEMS VOAs segment dominated the MEMS Variable Optic Attenuators (mVOA) Market.

Ans: Asia Pacific dominated the MEMS Variable Optic Attenuators (mVOA) Market in 2024.

Table of Contents

1. Introduction

1.1 Market Definition

1.2 Scope (Inclusion and Exclusions)

1.3 Research Assumptions

2. Executive Summary

2.1 Market Overview

2.2 Regional Synopsis

2.3 Competitive Summary

3. Research Methodology

3.1 Top-Down Approach

3.2 Bottom-up Approach

3.3. Data Validation

3.4 Primary Interviews

4. Market Dynamics Impact Analysis

4.1 Market Driving Factors Analysis

4.1.1 Drivers

4.1.2 Restraints

4.1.3 Opportunities

4.1.4 Challenges

4.2 PESTLE Analysis

4.3 Porter’s Five Forces Model

5. Statistical Insights and Trends Reporting

5.1 MEMS VOA-enabled Edge Computing Bandwidth Efficiency

5.2 MEMS VOA-enabled Edge Computing Bandwidth Efficiency

5.3 Environmental Noise Immunity Statistics

6. Competitive Landscape

6.1 List of Major Companies, By Region

6.2 Market Share Analysis, By Region

6.3 Product Benchmarking

6.3.1 Product specifications and features

6.3.2 Pricing

6.4 Strategic Initiatives

6.4.1 Marketing and promotional activities

6.4.2 Distribution and Supply Chain Strategies

6.4.3 Expansion plans and new Product launches

6.4.4 Strategic partnerships and collaborations

6.5 Technological Advancements

6.6 Market Positioning and Branding

7. MEMS Variable Optic Attenuators (mVOA) Market Segmentation By Type

7.1 Chapter Overview

7.2 Mechanical MEMS VOAs

7.2.1 Mechanical MEMS VOAs Market Trends Analysis (2021-2032)

7.2.2 Mechanical MEMS VOAs Market Size Estimates and Forecasts to 2032 (USD Million)

7.3 Optical MEMS VOAs

     7.3.1 Optical MEMS VOAs Market Trends Analysis (2021-2032)

           7.3.2 Optical MEMS VOAs Market Size Estimates and Forecasts to 2032 (USD Million)

7.4 Electro-Optic MEMS VOAs

     7.4.1 Electro-Optic MEMS VOAs Market Trends Analysis (2021-2032)

           7.4.2 Electro-Optic MEMS VOAs Market Size Estimates and Forecasts to 2032 (USD Million)

8. MEMS Variable Optic Attenuators (mVOA) Market Segmentation By Application

8.1 Chapter Overview

8.2 Telecommunications

     8.2.1 Telecommunications Market Trend Analysis (2021-2032)

           8.2.2 Telecommunications Market Size Estimates and Forecasts to 2032 (USD Million)

8.3 Data Centers

     8.3.1 Data Centers Market Trend Analysis (2021-2032)

           8.3.2 Data Centers Market Size Estimates and Forecasts to 2032 (USD Million)

8.4 Cable Television

     8.4.1 Cable Television Market Trend Analysis (2021-2032)

           8.4.2 Cable Television Market Size Estimates and Forecasts to 2032 (USD Million)

8.5 Military and Aerospace

     8.5.1 Military and Aerospace Market Trend Analysis (2021-2032)

           8.5.2 Military and Aerospace Market Size Estimates and Forecasts to 2032 (USD Million)

8.6 Medical Devices

     8.6.1 Medical Devices Market Trend Analysis (2021-2032)

           8.6.2 Medical Devices Market Size Estimates and Forecasts to 2032 (USD Million)

9. MEMS Variable Optic Attenuators (mVOA) Market Segmentation By End-Use Industry

9.1 Chapter Overview

9.2 Telecommunications Service Providers

        9.2.1 Telecommunications Service Providers Market Trends Analysis (2021-2032)

9.2.2 Telecommunications Service Providers Market Size Estimates and Forecasts to 2032 (USD Million)

9.3 Goverment and Defense

        9.3.1 Goverment and Defense Market Trends Analysis (2021-2032)

9.3.2 Goverment and Defense Market Size Estimates and Forecasts to 2032 (USD Million)

9.4 CATV service providers

        9.4.1 CATV service providers Market Trends Analysis (2021-2032)

9.4.2 CATV service providers Market Size Estimates and Forecasts to 2032 (USD Million)

9.5 Enterprise Networks

        9.5.1 Enterprise Networks Market Trends Analysis (2021-2032)

9.5.2 Enterprise Networks Market Size Estimates and Forecasts to 2032 (USD Million)

10. Regional Analysis

10.1 Chapter Overview

10.2 North America

10.2.1 Trends Analysis

10.2.2 North America MEMS Variable Optic Attenuators (mVOA) Market Estimates and Forecasts, by Country (2021-2032) (USD Million)

10.2.3 North America MEMS Variable Optic Attenuators (mVOA) Market Estimates and Forecasts, By Type (2021-2032) (USD Million) 

10.2.4 North America MEMS Variable Optic Attenuators (mVOA) Market Estimates and Forecasts, By Application (2021-2032) (USD Million)

10.2.5 North America MEMS Variable Optic Attenuators (mVOA) Market Estimates and Forecasts, By End-Use Industry (2021-2032) (USD Million)

10.2.6 USA

10.2.6.1 USA MEMS Variable Optic Attenuators (mVOA) Market Estimates and Forecasts, By Type (2021-2032) (USD Million)

10.2.6.2 USA MEMS Variable Optic Attenuators (mVOA) Market Estimates and Forecasts, By Application (2021-2032) (USD Million)

10.2.6.3 USA MEMS Variable Optic Attenuators (mVOA) Market Estimates and Forecasts, By End-Use Industry (2021-2032) (USD Million)

10.2.7 Canada

10.2.7.1 Canada MEMS Variable Optic Attenuators (mVOA) Market Estimates and Forecasts, By Type (2021-2032) (USD Million)

10.2.7.2 Canada MEMS Variable Optic Attenuators (mVOA) Market Estimates and Forecasts, By Application (2021-2032) (USD Million)

10.2.7.3 Canada MEMS Variable Optic Attenuators (mVOA) Market Estimates and Forecasts, By End-Use Industry (2021-2032) (USD Million)

10.2.8 Mexico

10.2.8.1 Mexico MEMS Variable Optic Attenuators (mVOA) Market Estimates and Forecasts, By Type (2021-2032) (USD Million)

10.2.8.2 Mexico MEMS Variable Optic Attenuators (mVOA) Market Estimates and Forecasts, By Application (2021-2032) (USD Million)

10.2.8.3 Mexico MEMS Variable Optic Attenuators (mVOA) Market Estimates and Forecasts, By End-Use Industry (2021-2032) (USD Million)

10.3 Europe

10.3.1 Trends Analysis

10.3.2 Europe MEMS Variable Optic Attenuators (mVOA) Market Estimates and Forecasts, by Country (2021-2032) (USD Million)

10.3.3 Europe MEMS Variable Optic Attenuators (mVOA) Market Estimates and Forecasts, By Type (2021-2032) (USD Million) 

10.3.4 Europe MEMS Variable Optic Attenuators (mVOA) Market Estimates and Forecasts, By Application (2021-2032) (USD Million)

10.3.5 Europe MEMS Variable Optic Attenuators (mVOA) Market Estimates and Forecasts, By End-Use Industry(2021-2032) (USD Million)

10.3.6 Germany

10.3.1.6.1 Germany MEMS Variable Optic Attenuators (mVOA) Market Estimates and Forecasts, By Type (2021-2032) (USD Million)

10.3.1.6.2 Germany MEMS Variable Optic Attenuators (mVOA) Market Estimates and Forecasts, By Application (2021-2032) (USD Million)

10.3.1.6.3 Germany MEMS Variable Optic Attenuators (mVOA) Market Estimates and Forecasts, By End-Use Industry (2021-2032) (USD Million)

10.3.7 France

10.3.7.1 France MEMS Variable Optic Attenuators (mVOA) Market Estimates and Forecasts, By Type (2021-2032) (USD Million)

10.3.7.2 France a MEMS Variable Optic Attenuators (mVOA) Market Estimates and Forecasts, By Application (2021-2032) (USD Million)

10.3.7.3 France MEMS Variable Optic Attenuators (mVOA) Market Estimates and Forecasts, By End-Use Industry (2021-2032) (USD Million)

10.3.8 UK

10.3.8.1 UK MEMS Variable Optic Attenuators (mVOA) Market Estimates and Forecasts, By Type (2021-2032) (USD Million)

10.3.8.2 UK MEMS Variable Optic Attenuators (mVOA) Market Estimates and Forecasts, By Application (2021-2032) (USD Million)

10.3.8.3 UK MEMS Variable Optic Attenuators (mVOA) Market Estimates and Forecasts, By End-Use Industry (2021-2032) (USD Million)

10.3.9 Italy

10.3.9.1 Italy MEMS Variable Optic Attenuators (mVOA) Market Estimates and Forecasts, By Type (2021-2032) (USD Million)

10.3.9.2 Italy MEMS Variable Optic Attenuators (mVOA) Market Estimates and Forecasts, By Application (2021-2032) (USD Million)

10.3.9.3 Italy MEMS Variable Optic Attenuators (mVOA) Market Estimates and Forecasts, By End-Use Industry (2021-2032) (USD Million)

10.3.10 Spain

10.3.10.1 Spain MEMS Variable Optic Attenuators (mVOA) Market Estimates and Forecasts, By Type (2021-2032) (USD Million)

10.3.10.2 Spain MEMS Variable Optic Attenuators (mVOA) Market Estimates and Forecasts, By Application (2021-2032) (USD Million)

10.3.10.3 Spain MEMS Variable Optic Attenuators (mVOA) Market Estimates and Forecasts, By End-Use Industry (2021-2032) (USD Million)

10.3.12 Poland

10.3.12.1 Poland MEMS Variable Optic Attenuators (mVOA) Market Estimates and Forecasts, by Country (2021-2032) (USD Million)

10.3.12.1 Poland MEMS Variable Optic Attenuators (mVOA) Market Estimates and Forecasts, By Type (2021-2032) (USD Million) 

10.3.12.3 Poland MEMS Variable Optic Attenuators (mVOA) Market Estimates and Forecasts, By Application (2021-2032) (USD Million)

10.3.12.3 Poland MEMS Variable Optic Attenuators (mVOA) Market Estimates and Forecasts, By End-Use Industry (2021-2032) (USD Million)

10.3.13 Turkey

10.3.13.1 Turkey MEMS Variable Optic Attenuators (mVOA) Market Estimates and Forecasts, By Type (2021-2032) (USD Million)

10.3.13.2 Turkey MEMS Variable Optic Attenuators (mVOA) Market Estimates and Forecasts, By Application (2021-2032) (USD Million)

10.3.13.3 Turkey MEMS Variable Optic Attenuators (mVOA) Market Estimates and Forecasts, By End-Use Industry (2021-2032) (USD Million)

10.3.14 Rest of Europe

10.3.14.1 Rest of Europe MEMS Variable Optic Attenuators (mVOA) Market Estimates and Forecasts, By Type (2021-2032) (USD Million)

10.3.14.2 Rest of Europe MEMS Variable Optic Attenuators (mVOA) Market Estimates and Forecasts, By Application (2021-2032) (USD Million)

10.3.14.3 Rest of Europe MEMS Variable Optic Attenuators (mVOA) Market Estimates and Forecasts, By End-Use Industry(2021-2032) (USD Million)

10.4 Asia-Pacific

10.4.1 Trends Analysis

  10.4.2 Asia-Pacific MEMS Variable Optic Attenuators (mVOA) Market Estimates and Forecasts, by Country (2021-2032) (USD Million)

 10.4.3 Asia-Pacific MEMS Variable Optic Attenuators (mVOA) Market Estimates and Forecasts, By Type (2021-2032) (USD Million) 

 10.4.4 Asia-Pacific MEMS Variable Optic Attenuators (mVOA) Market Estimates and Forecasts, By Application (2021-2032) (USD Million)

 10.4.5 Asia-Pacific MEMS Variable Optic Attenuators (mVOA) Market Estimates and Forecasts, By End-Use Industry (2021-2032) (USD Million)

10.4.6 China

10.4.6.1 China MEMS Variable Optic Attenuators (mVOA) Market Estimates and Forecasts, By Type (2021-2032) (USD Million)

10.4.6.2 China MEMS Variable Optic Attenuators (mVOA) Market Estimates and Forecasts, By Application (2021-2032) (USD Million)

10.4.6.3 China MEMS Variable Optic Attenuators (mVOA) Market Estimates and Forecasts, By End-Use Industry (2021-2032) (USD Million)

10.4.7 India

10.4.7.1 India MEMS Variable Optic Attenuators (mVOA) Market Estimates and Forecasts, By Type (2021-2032) (USD Million)

10.4.7.2 India MEMS Variable Optic Attenuators (mVOA) Market Estimates and Forecasts, By Application (2021-2032) (USD Million)

10.4.7.3 India MEMS Variable Optic Attenuators (mVOA) Market Estimates and Forecasts, By End-Use Industry (2021-2032) (USD Million)

10.4.8 Japan

10.4.8.1 Japan MEMS Variable Optic Attenuators (mVOA) Market Estimates and Forecasts, By Type (2021-2032) (USD Million)

10.4.8.2 Japan MEMS Variable Optic Attenuators (mVOA) Market Estimates and Forecasts, By Application (2021-2032) (USD Million)

10.4.8.3 Japan MEMS Variable Optic Attenuators (mVOA) Market Estimates and Forecasts, By End-Use Industry (2021-2032) (USD Million)

10.4.9 South Korea

10.4.9.1 South Korea MEMS Variable Optic Attenuators (mVOA) Market Estimates and Forecasts, By Type (2021-2032) (USD Million)

10.4.9.2 South Korea MEMS Variable Optic Attenuators (mVOA) Market Estimates and Forecasts, By Application (2021-2032) (USD Million)

10.4.9.3 South Korea MEMS Variable Optic Attenuators (mVOA) Market Estimates and Forecasts, By End-Use Industry (2021-2032) (USD Million)

10.4.10 Singapore

10.4.10.1 Singapore MEMS Variable Optic Attenuators (mVOA) Market Estimates and Forecasts, By Type (2021-2032) (USD Million)

10.4.10.2 Singapore MEMS Variable Optic Attenuators (mVOA) Market Estimates and Forecasts, By Application (2021-2032) (USD Million)

10.4.10.3 Singapore MEMS Variable Optic Attenuators (mVOA) Market Estimates and Forecasts, By End-Use Industry (2021-2032) (USD Million)

10.4.11 Australia

10.4.11.1 Australia MEMS Variable Optic Attenuators (mVOA) Market Estimates and Forecasts, By Type (2021-2032) (USD Million)

10.4.11.2 Australia MEMS Variable Optic Attenuators (mVOA) Market Estimates and Forecasts, By Application (2021-2032) (USD Million)

10.4.11.3 Australia MEMS Variable Optic Attenuators (mVOA) Market Estimates and Forecasts, By End-Use Industry (2021-2032) (USD Million)

10.4.12 Taiwan

10.4.12.1 Taiwan MEMS Variable Optic Attenuators (mVOA) Market Estimates and Forecasts, By Type (2021-2032) (USD Million)

10.4.12.2 Taiwan MEMS Variable Optic Attenuators (mVOA) Market Estimates and Forecasts, By Application (2021-2032) (USD Million)

10.4.12.3 Taiwan MEMS Variable Optic Attenuators (mVOA) Market Estimates and Forecasts, By End-Use Industry (2021-2032) (USD Million)

10.4.13 Rest of Asia-Pacific

10.4.13.1 Rest of Asia-Pacific MEMS Variable Optic Attenuators (mVOA) Market Estimates and Forecasts, By Type (2021-2032) (USD Million)

10.4.13.2 Rest of Asia-Pacific MEMS Variable Optic Attenuators (mVOA) Market Estimates and Forecasts, By Application (2021-2032) (USD Million)

10.4.13.3 Rest of Asia-Pacific MEMS Variable Optic Attenuators (mVOA) Market Estimates and Forecasts, By End-Use Industry (2021-2032) (USD Million)

10.5 Middle East and Africa

10.5.1 Trends Analysis

10.5.2 Middle East and Africa East MEMS Variable Optic Attenuators (mVOA) Market Estimates and Forecasts, by Country (2021-2032) (USD Million)

10.5.3Middle East and Africa MEMS Variable Optic Attenuators (mVOA) Market Estimates and Forecasts, By Type (2021-2032) (USD Million) 

10.5.4 Middle East and Africa MEMS Variable Optic Attenuators (mVOA) Market Estimates and Forecasts, By Application (2021-2032) (USD Million)

10.5.5 Middle East and Africa MEMS Variable Optic Attenuators (mVOA) Market Estimates and Forecasts, By End-Use Industry (2021-2032) (USD Million)

10.5.6 UAE

10.5.6.1 UAE MEMS Variable Optic Attenuators (mVOA) Market Estimates and Forecasts, By Type (2021-2032) (USD Million)

10.5.6.2 UAE MEMS Variable Optic Attenuators (mVOA) Market Estimates and Forecasts, By Application (2021-2032) (USD Million)

10.5.6.3 UAE MEMS Variable Optic Attenuators (mVOA) Market Estimates and Forecasts, By End-Use Industry (2021-2032) (USD Million)

10.5.7 Saudi Arabia

10.5.7.1 Saudi Arabia MEMS Variable Optic Attenuators (mVOA) Market Estimates and Forecasts, By Type (2021-2032) (USD Million)

10.5.7.2 Saudi Arabia MEMS Variable Optic Attenuators (mVOA) Market Estimates and Forecasts, By Application (2021-2032) (USD Million)

10.5.7.3 Saudi Arabia MEMS Variable Optic Attenuators (mVOA) Market Estimates and Forecasts, By End-Use Industry (2021-2032) (USD Million)

10.5.8 Qatar

10.5.8.1 Qatar MEMS Variable Optic Attenuators (mVOA) Market Estimates and Forecasts, By Type (2021-2032) (USD Million)

10.5.8.2 Qatar MEMS Variable Optic Attenuators (mVOA) Market Estimates and Forecasts, By Application (2021-2032) (USD Million)

10.5.8.3 Qatar MEMS Variable Optic Attenuators (mVOA) Market Estimates and Forecasts, By End-Use Industry (2021-2032) (USD Million)

10.5.9 South Africa

10.5.9 1 South Africa MEMS Variable Optic Attenuators (mVOA) Market Estimates and Forecasts, By Type (2021-2032) (USD Million)

10.5.9 2 South Africa MEMS Variable Optic Attenuators (mVOA) Market Estimates and Forecasts By Application (2021-2032) (USD Million)

10.5.9 3 South Africa MEMS Variable Optic Attenuators (mVOA) Market Estimates and Forecasts, By End-Use Industry (2021-2032) (USD Million)

10.5.10 Rest of Middle East & Africa

10.5.10.1 Rest of Middle East & Africa MEMS Variable Optic Attenuators (mVOA) Market Estimates and Forecasts, By Type (2021-2032) (USD Million)

10.5.10.2 Rest of Middle East & Africa MEMS Variable Optic Attenuators (mVOA) Market Estimates and Forecasts, By Application (2021-2032) (USD Million)

10.5.10.3 Rest of Middle East & Africa MEMS Variable Optic Attenuators (mVOA) Market Estimates and Forecasts, By End-Use Industry (2021-2032) (USD Million)

10.6 Latin America

10.6.1 Trends Analysis

10.6.2 Latin America MEMS Variable Optic Attenuators (mVOA) Market Estimates and Forecasts, by Country (2021-2032) (USD Million)

10.6.3 Latin America MEMS Variable Optic Attenuators (mVOA) Market Estimates and Forecasts, By Type (2021-2032) (USD Million) 

10.6.4 Latin America MEMS Variable Optic Attenuators (mVOA) Market Estimates and Forecasts, By Application (2021-2032) (USD Million)

10.6.5 Latin America MEMS Variable Optic Attenuators (mVOA) Market Estimates and Forecasts, By End-Use Industry (2021-2032) (USD Million)

10.6.6 Brazil

10.6.6.1 Brazil MEMS Variable Optic Attenuators (mVOA) Market Estimates and Forecasts, By Type (2021-2032) (USD Million)

10.6.6.2 Brazil MEMS Variable Optic Attenuators (mVOA) Market Estimates and Forecasts, By Application (2021-2032) (USD Million)

10.6.6.3 Brazil MEMS Variable Optic Attenuators (mVOA) Market Estimates and Forecasts, By End-Use Industry (2021-2032) (USD Million)

10.6.7 Argentina

10.6.7.1 Argentina MEMS Variable Optic Attenuators (mVOA) Market Estimates and Forecasts, By Type (2021-2032) (USD Million)

10.6.7.2 Argentina MEMS Variable Optic Attenuators (mVOA) Market Estimates and Forecasts, By Application (2021-2032) (USD Million)

10.6.7.3 Argentina MEMS Variable Optic Attenuators (mVOA) Market Estimates and Forecasts, By End-Use Industry (2021-2032) (USD Million)

10.6.8 Rest of Latin America

10.6.8.1 Rest of Latin America MEMS Variable Optic Attenuators (mVOA) Market Estimates and Forecasts, By Type (2021-2032) (USD Million)

10.6.8.2 Rest of Latin America MEMS Variable Optic Attenuators (mVOA) Market Estimates and Forecasts, By Application (2021-2032) (USD Million)

10.6.8.3 Rest of Latin America MEMS Variable Optic Attenuators (mVOA) Market Estimates and Forecasts, By End-Use Industry (2021-2032) (USD Million)

12. Company Profiles

12.1 Lumentum Holdings Inc.

          12.1.1 Company Overview

12.1.2 Financial

12.1.3 Products/ Services Offered

12.1.4 SWOT Analysis

12.2 II-VI Incorporated (Coherent Inc.)

           12.2.1 Company Overview

12.2.2 Financial

12.2.3 Products/ Services Offered

12.2.4 SWOT Analysis

12.3 Finisar Corporation

          12.3.1 Company Overview

12.3.2 Financial

12.3.3 Products/ Services Offered

12.3.4 SWOT Analysis

12.4 Furukawa Electric Co., Ltd.

          12.4.1 Company Overview

12.4.2 Financial

12.4.3 Products/ Services Offered

12.4.4 SWOT Analysis

12.5 Oplink Communications

          12.5.1 Company Overview

12.5.2 Financial

12.5.3 Products/ Services Offered

12.5.4 SWOT Analysis

12.6 Gould Fiber Optics

            12.6.1 Company Overview

12.6.2 Financial

12.6.3 Products/ Services Offered

12.6.4 SWOT Analysis

12.7 Micron Optics (Luna Innovations)

          12.7.1 Company Overview

12.7.2 Financial

12.7.3 Products/ Services Offered

12.7.4 SWOT Analysis

12.8 Aurrion, Inc. (Juniper Networks)

12.8.1 Company Overview

12.8.2 Financial

12.8.3 Products/ Services Offered

12.8.4 SWOT Analysis

12.9 Avago Technologies (Broadcom Inc.)

12.9.1 Company Overview

12.9.2 Financial

12.9.3 Products/ Services Offered

12.9.4 SWOT Analysis

12.10 NeoPhotonics Corporation

12.10.1 Company Overview

12.10.2 Financial

12.10.3 Products/ Services Offered

12.10.4 SWOT Analysi

12. Use Cases and Best Practices

13. Conclusion

An accurate research report requires proper strategizing as well as implementation. There are multiple factors involved in the completion of good and accurate research report and selecting the best methodology to compete the research is the toughest part. Since the research reports we provide play a crucial role in any company’s decision-making process, therefore we at SNS Insider always believe that we should choose the best method which gives us results closer to reality. This allows us to reach at a stage wherein we can provide our clients best and accurate investment to output ratio.

Each report that we prepare takes a timeframe of 350-400 business hours for production. Starting from the selection of titles through a couple of in-depth brain storming session to the final QC process before uploading our titles on our website we dedicate around 350 working hours. The titles are selected based on their current market cap and the foreseen CAGR and growth.


The 5 steps process:

Step 1: Secondary Research:

Secondary Research or Desk Research is as the name suggests is a research process wherein, we collect data through the readily available information. In this process we use various paid and unpaid databases which our team has access to and gather data through the same. This includes examining of listed companies’ annual reports, Journals, SEC filling etc. Apart from this our team has access to various associations across the globe across different industries. Lastly, we have exchange relationships with various university as well as individual libraries.

Secondary Research

Step 2: Primary Research

When we talk about primary research, it is a type of study in which the researchers collect relevant data samples directly, rather than relying on previously collected data.  This type of research is focused on gaining content specific facts that can be sued to solve specific problems. Since the collected data is fresh and first hand therefore it makes the study more accurate and genuine.

We at SNS Insider have divided Primary Research into 2 parts.

Part 1 wherein we interview the KOLs of major players as well as the upcoming ones across various geographic regions. This allows us to have their view over the market scenario and acts as an important tool to come closer to the accurate market numbers. As many as 45 paid and unpaid primary interviews are taken from both the demand and supply side of the industry to make sure we land at an accurate judgement and analysis of the market.

This step involves the triangulation of data wherein our team analyses the interview transcripts, online survey responses and observation of on filed participants. The below mentioned chart should give a better understanding of the part 1 of the primary interview.

Primary Research

Part 2: In this part of primary research the data collected via secondary research and the part 1 of the primary research is validated with the interviews from individual consultants and subject matter experts.

Consultants are those set of people who have at least 12 years of experience and expertise within the industry whereas Subject Matter Experts are those with at least 15 years of experience behind their back within the same space. The data with the help of two main processes i.e., FGDs (Focused Group Discussions) and IDs (Individual Discussions). This gives us a 3rd party nonbiased primary view of the market scenario making it a more dependable one while collation of the data pointers.

Step 3: Data Bank Validation

Once all the information is collected via primary and secondary sources, we run that information for data validation. At our intelligence centre our research heads track a lot of information related to the market which includes the quarterly reports, the daily stock prices, and other relevant information. Our data bank server gets updated every fortnight and that is how the information which we collected using our primary and secondary information is revalidated in real time.

Data Bank Validation

Step 4: QA/QC Process

After all the data collection and validation our team does a final level of quality check and quality assurance to get rid of any unwanted or undesired mistakes. This might include but not limited to getting rid of the any typos, duplication of numbers or missing of any important information. The people involved in this process include technical content writers, research heads and graphics people. Once this process is completed the title gets uploader on our platform for our clients to read it.

Step 5: Final QC/QA Process:

This is the last process and comes when the client has ordered the study. In this process a final QA/QC is done before the study is emailed to the client. Since we believe in giving our clients a good experience of our research studies, therefore, to make sure that we do not lack at our end in any way humanly possible we do a final round of quality check and then dispatch the study to the client.

Key Segments: 

By Type

    • Mechanical MEMS VOAs

    • Optical MEMS VOAs

    • Electro-Optic MEMS VOAs

By Application

    • Telecommunications

    • Data Centers

    • Cable Television

    • Military and Aerospace

    • Medical Devices

By End-Use Industry

  • Telecommunications Service Providers

  • Government and Defense

  • CATV service providers

  • Enterprise Networks

Request for Segment Customization as per your Business Requirement: Segment Customization Request

Regional Coverage: 

North America

  • US

  • Canada

  • Mexico

Europe

  • Germany

  • France

  • UK

  • Italy

  • Spain

  • Poland

  • Turkey

  • Rest of Europe

Asia Pacific

  • China

  • India

  • Japan

  • South Korea

  • Singapore

  • Australia

  • Taiwan

  • Rest of Asia Pacific

Middle East & Africa

  • UAE

  • Saudi Arabia

  • Qatar

  • South Africa

  • Rest of Middle East & Africa

Latin America

  • Brazil

  • Argentina

  • Rest of Latin America

Request for Country Level Research Report: Country Level Customization Request

Available Customization 

With the given market data, SNS Insider offers customization as per the company’s specific needs. The following customization options are available for the report: 

  • Detailed Volume Analysis 

  • Criss-Cross segment analysis (e.g. Product X Application) 

  • Competitive Product Benchmarking 

  • Geographic Analysis 

  • Additional countries in any of the regions 

  • Customized Data Representation 

  • Detailed analysis and profiling of additional market players

Explore Key Insights 


  • Analyzes market trends, forecasts, and regional dynamics
  • Covers core offerings, innovations, and industry use cases
  • Profiles major players, value chains, and strategic developments
  • Highlights innovation trends, regulatory impacts, and growth opportunities
Request an Analyst Call