MLOps Market Report Scope and Overview:
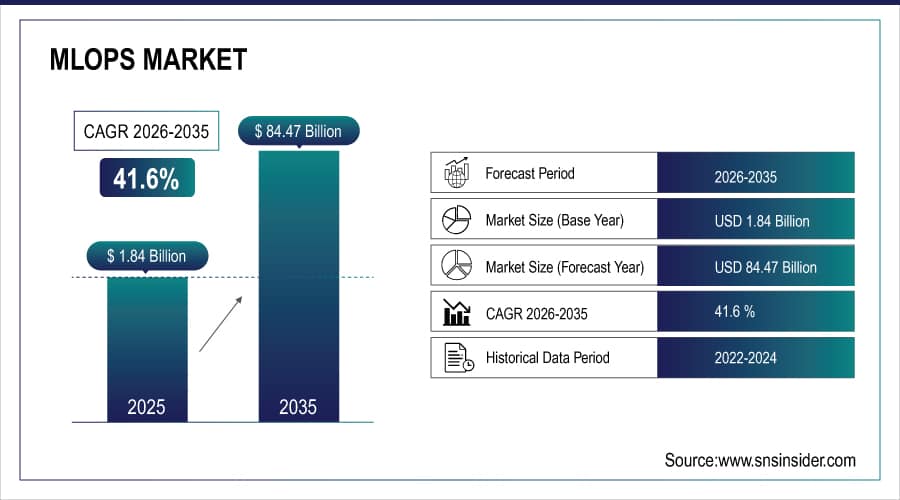
The MLOps Market size was valued at USD 1.84 Billion in 2025 and is projected to reach USD 84.47 Billion by 2035, growing at a CAGR of 41.6% during 2026-2035.
The ability to integrate MLOps with existing DevOps is becoming more of a standard practice among organizations aiming to enhance the effectiveness of their machine learning work. By adopting DevOps practices, organizations can improve the agility and reliability of their machine learning deployments. This integration includes several practices that make MLOps a part of DevOps, such as the use of version control to provide insights into the changes in machine learning models and data and allow for the reversal of changes. Next, the use of CI/CD pipelines enables automated testing and deployment processes and quick iteration as well as minimal deployment issues or downtime.
The process of rolling out updates ensures that models are always tested against performance metrics, and deploying them is their final validation step. Last, monitoring models that are already in production reveals such issues as data drift or model degradation and allows for the maintenance of optimum performance. By combining MLOps with DevOps, organizations can create a positive, encouraging, and innovative culture that allows them to deliver more effective and coherent machine learning solutions.
The U.S. Bureau of Labor Statistics projects that employment in computer and information technology occupations, which includes AI and ML fields, will grow 15% from 2021 to 2032, much faster than the average for all occupations, highlighting the increasing relevance of these technologies in business.
With the rising realization of the transformative effects of artificial intelligence and machine learning on enhancing business innovation and operational efficiency, there is an accelerating demand for MLOps solutions. The latter is indispensable for streamlining the deployment, monitoring, and management of ML models at scale. Since businesses aspire to derive competitive advantage from data-driven insights, one can no longer ignore the complexity of effectively managing multiple models in production. MLOps is a structured framework that harnesses best practices from development and operations, implying that the models are not only deployed fast but also constantly monitored whether they effectively and reliably perform. According to a 2022 report by the National Institute of Standards and Technology (NIST), 61% of U.S. businesses reported adopting AI technologies, with many indicating that these technologies are critical for enhancing efficiency and operational processes.
MLOps Market Size and Forecast:
-
Market Size in 2025: USD 1.84 Billion
-
Market Size by 2035: USD 84.47 Billion
-
CAGR: 41.6% (2026–2035)
-
Base Year: 2025
-
Forecast Period: 2026–2035
-
Historical Data: 2022–2024
To Get More Information On MLOps Market - Request Free Sample Report
MLOps Market Highlights:
-
Real‑world MLOps implementations such as DXC’s platform for Bayernwerk demonstrate how operationalizing ML models with MLOps pipelines enables faster, scalable, and reliable AI solutions for enterprises, improving accuracy and operational efficiency.
-
Enterprise adoption of custom MLOps platforms allows organizations to tailor workflows for their specific needs, streamline the ML lifecycle (from data processing to deployment), and foster cross‑team collaboration and efficiency.
-
Custom MLOps platforms enhance model monitoring, management, and automated retraining, reducing manual effort and enabling rapid iteration of ML models in production.
-
Oracle’s ML Applications represents the next era of MLOps delivery by standardizing end‑to‑end AI/ML integration, simplifying lifecycle management, observability, and versioning through unified APIs and deployment abstractions.
-
Snowflake’s end‑to‑end ML workflows unify data preparation, feature engineering, model training, deployment, monitoring, and lineage tracking in a single platform, reducing data movement and operational complexity.
-
Integrated capabilities such as feature stores, model registries, and ML lineage in Snowflake enable scalable model governance, reproducibility, and secure MLOps pipelines across the ML lifecycle.
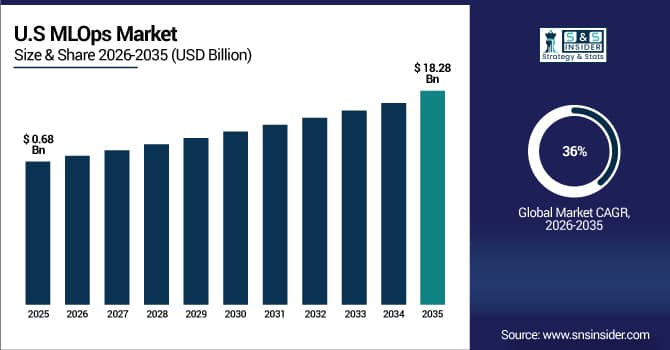
The U.S. MLOps Market is witnessing rapid growth, driven by widespread adoption of automated machine learning lifecycle tools, model monitoring, and deployment platforms across enterprises. In 2025, the market is estimated at approximately USD 0.68 billion and is projected to expand at a CAGR of around 36%, reaching nearly USD 18.28 billion by 2035. North America, led by the U.S., represents a significant share of the global MLOps market, reflecting the region’s strong focus on AI innovation, cloud integration, and enterprise-scale AI operations.
MLOps Market Drivers:
-
Growing demand for cloud-based MLOps solutions.
The increasing demand for cloud-based MLOps solutions that can help companies organize their machine learning operations. Due to the growing adoption of AI and ML technologies among various organizations, the issue of managing multiple ML models has become especially relevant. Cloud-based MLOps solutions provide companies with a seamless way to address this problem. Firstly, they ensure high efficiency and scalability of the infrastructure. Thus, based on the volume of uploaded data, models, and required computational capacity, organizations dynamically manage resources implemented in the cloud, gaining considerable benefits in terms of managing the workload. Secondly, by running all necessary tools in the cloud, the platforms enhance collaboration between data scientists, engineers, and business specialists.
It is because of the nature of cloud environments, knowledge workers can access the necessary tools from any location to run their experiments. The sphere of machine learning, as well as business in general, is characterized by the demand for high speed, hence the ability to quickly conduct experiments and adjust models. Finally, cloud providers can ensure the highest level of security and design robust compliance frameworks. In conclusion, the adoption of AI and ML will only increase in the upcoming years, and the demand for cloud-based MLOps platforms is expected to grow as well.
A report from the National Institute of Standards and Technology (NIST) noted that over 70% of organizations are integrating AI into their cloud-based platforms, reflecting the growing reliance on cloud environments for AI and machine learning operations.
MLOps Market Restraints:
-
Lack of awareness about MLOps among many organizations.
One of the most substantial constraints to machine learning practices and technologies is the lack of awareness about MLOps in many organizations. Despite the increasing recognition of artificial intelligence and machine learning as potent tools for helping companies expand and improve their operations MAI21, many companies, particularly small and medium enterprises, do not have adequate reasons to learn about the benefits of MLOps, which can result from a variety of factors. Some of these include a scarcity of educational opportunities, a lack of experience in data science, or the absence of a compelling case demonstrating the advantages of MLOps. Accordingly, decision-makers might undervalue the role such an operation framework may play in the process of deploying, monitoring, and managing ML models.
MLOps Market Opportunities:
-
Demand for MLOps tools and solutions presents opportunities for companies to develop and provide innovative MLOps tools and platforms.
Edge computing is a new paradigm for computing that brings computation and storage closer to the data source. This is creating new opportunities for MLOps, as it allows organizations to deploy and run ML models at the edge. The advent of DNA microarray technology made possible screening a relatively large number of SNPs simultaneously. This technology is crucial in population screening for susceptibility to multifactorial diseases. Technology is very useful in the diagnosis of hemoglobinopathies simultaneously. DNA sequences can be tested on one slide and multiple people evaluated at a relatively low cost. Understanding various single nucleotide polymorphisms present in each of the multiple genes evaluated would not have been possible a few years ago. DNA microarray technology has enabled a revolution in the genetic testing of a variety of diseases.
MLOps Market Segment Analysis:
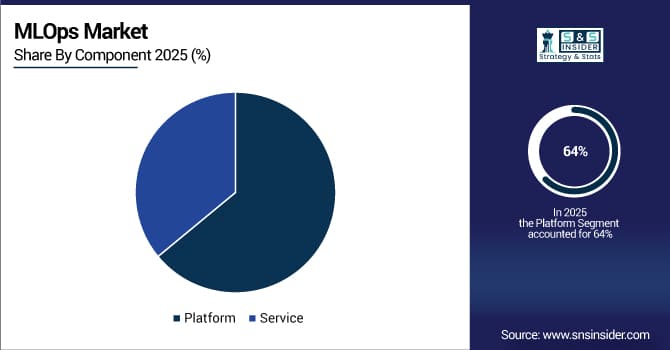
By Component
The platform segment held the largest market share of over 64% as of 2025. MLOps platforms are offered as comprehensive tools with a variety of integrated services, covering the whole range of tasks necessary to support this life cycle. In this way, data preparation, model training, deployment, and monitoring can all be carried out with such solutions, including such vital stages as model training and data preparation. They help enhance the collaboration of data scientists, engineers, IT departments, and others, ensuring that all of the parties involved experience simplified and more facilitated operations. More importantly, this approach contributes to a substantial decrease in time needed to start running machine learning applications or models, and, providing such features as version control, automated tests, and CI/CD, platforms also contribute to the reliability, scalability, and stability of the solutions offered.
By Deployment
The cloud segment held the largest market share around 42% in 2025. Cloud-based solutions are widespread nowadays due to the scalability and flexibility they provide. This is a feature an organization can manage and deploy machine learning solutions without the necessity of having a vast on-the-ground facility. Speaking of scalability, for example, it is important for enterprises with a vast workload and huge datasets as cloud solutions smoothly allocate necessary resources and maximize them to meet the demand. In addition, companies that supply clouds might offer a range of tools stretching from data storage to training and model facilitating its deployment, thus, appealing to businesses due to the wide options available. In addition, the cloud is a proper environment for collaboration since it is easily accessible to professionals from different parts of the world
By End-Use
IT & Telecom segment held the largest market share around 30% in 2025. IT and telecom are dominant in their specific features that make the demand for solutions and products they have very high. It can mainly be explained by the intensive development of such technologies as cloud computing, artificial intelligence, the Internet of Things, etc., that require robust IT and telecom solutions. Companies operating in the segment have to look for new and more efficient ways of working, seek to cut costs and improve the quality of products and services. The current trend for digital communication and the across-the-board introduction of 5G encourages those companies to create new products and services, hence, leading to the further development of their MLOps.
MLOps Market Regional Analysis:
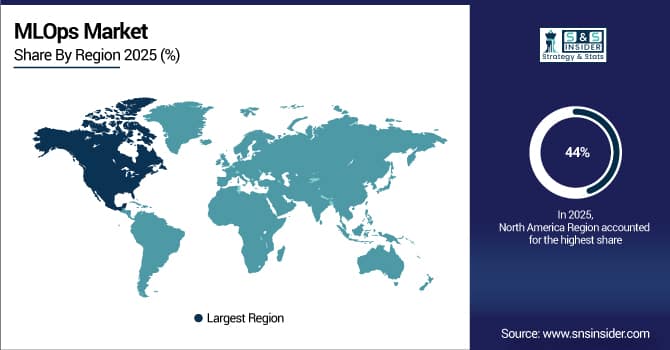
North America MLOps Market Trends:
North America dominated the market in 2025, accounting for over 44% of the worldwide revenue. Due to Al's strong R&D capacities in developed economies, research institutions, and numerous top Al firms situated in this area. It is projected that North America will see profitable growth prospects as a result of the rising investment in cutting-edge technologies to improve customer experience and business processes. Additionally, over the past few years, the region has made significant investments in technology related to aluminumw2 and has strong R&D skills in the field. To assist the advancement of the field, they have also implemented policies. For instance, open-source business Allegro AI announced in December 2022 that it had passed a significant growth milestone, setting new benchmarks in user base, revenue, and collaborations. The company also announced opening its first office in the U.S. to meet the high demand for its platform.
Get Customized Report as Per Your Business Requirement - Enquiry Now
Asia-Pacific MLOps Market Trends:
Asia Pacific is expected to have the highest CAGR over the forecast period. Cloud computing in the area is expanding quickly, with major businesses like Amazon Web Services, Inc., Microsoft, and Google increasing their presence there. As enterprises take use of cloud infrastructure's scalability and flexibility, cloud-based MLOps solutions are anticipated to experience increasing adoption in the region. Additionally, governments and companies in the APAC region are making significant investments in AI and machine learning. This investment increases demand for MLOps solutions, which enable businesses to rapidly build and use machine learning models.
Europe MLOps Market Trends:
Europe accounted for a significant share of the global MLOps market in 2025, driven by strong AI research, digital transformation initiatives, and widespread adoption of cloud computing. Countries such as Germany, the UK, and France are investing heavily in AI and machine learning capabilities. Governments are supporting AI innovation through funding programs, regulatory frameworks, and research collaborations, which is increasing demand for enterprise-grade MLOps platforms. The region is also seeing growth in startups and technology providers focused on automating ML workflows, model deployment, and monitoring.
Latin America MLOps Market Trends:
Latin America is emerging as a growing market for MLOps solutions due to increasing digitalization, adoption of cloud services, and rising AI initiatives across industries such as finance, healthcare, and retail. Brazil and Mexico are leading the region in AI investments and technology adoption. Enterprises are increasingly implementing MLOps platforms to manage ML lifecycle efficiently, reduce operational costs, and improve scalability. Government-backed programs and collaborations with global AI providers are further supporting market expansion in this region.
Middle East & Africa MLOps Market Trends:
The Middle East & Africa region is witnessing steady growth in MLOps adoption, supported by smart city initiatives, AI-driven business transformations, and increasing cloud infrastructure deployments. Countries such as the UAE, Saudi Arabia, and South Africa are investing in AI and machine learning to enhance public services, industrial automation, and customer experiences. MLOps platforms are gaining traction as enterprises and government entities focus on accelerating AI model deployment, governance, and performance monitoring. Strategic partnerships with global technology providers are also boosting market growth in this region.
MLOps Market Competitive Landscape:
IBM (International Business Machines Corporation), established in 1911 and headquartered in Armonk, New York, is a global technology and consulting company. It provides cloud computing, AI solutions, hybrid cloud platforms, and enterprise software services, helping businesses and governments optimize operations, security, and innovation worldwide through AI, data analytics, and quantum computing.
-
In Jan 2026, IBM has launched Sovereign Core, a platform giving enterprises and governments secure access to AI while maintaining data sovereignty. The platform allows approved open and proprietary models, supporting compliance, operational autonomy, and faster AI adoption.
H2O.ai, founded in 2012, is a global AI cloud platform company on a mission to democratize artificial intelligence and machine learning. It provides enterprise AI tools—including automated machine learning and generative AI solutions—and serves over 20,000 organizations worldwide, enabling secure, scalable model development, deployment, and innovation
-
On October 28, 2025, H2O.ai announced integrations with NVIDIA Nemotron models, NIM microservices, and GPU-accelerated AI Blueprints to accelerate secure, enterprise-grade AI deployments. The Flood Intelligence Blueprint uses multi-agent AI and AutoML to forecast and mitigate flood risks in real time for governments and organizations.
MLOps Market Key Players:
-
IBM Corporation
-
GAVS Technologies
-
Amazon Web Services, Inc.
-
Databricks, Inc.
-
DataRobot, Inc.
-
Microsoft Corporation
-
Cloudera, Inc.
-
Akira AI
-
Alteryx
-
Google LLC
-
H2O.ai
-
NVIDIA Corporation
-
Tecton
-
Paperspace
-
Kubeflow
-
MLflow
-
Seldon Technologies
-
ClearML
-
Weight & Biases
-
Neptune.ai
| Report Attributes | Details |
|---|---|
| Market Size in 2025 | USD 2.61 Billion |
| Market Size by 2035 | USD 84.47 Billion |
| CAGR | CAGR of 41.6% From 2026 to 2035 |
| Base Year | 2025 |
| Forecast Period | 2026-2035 |
| Historical Data | 2022-2024 |
| Report Scope & Coverage | Market Size, Segments Analysis, Competitive Landscape, Regional Analysis, DROC & SWOT Analysis, Forecast Outlook |
| Key Segments | • By Component (Platform, Service) • By Deployment Mode (On-Premise, Cloud) • By Organization Size (Large Enterprises, Small and Medium-sized Enterprises) • By End-Use Vertical (IT, Telecom Services, Government, BFSI, Retail, Consumer Goods, Transportation, Others) |
| Regional Analysis/Coverage | North America (US, Canada), Europe (Germany, UK, France, Italy, Spain, Russia, Poland, Rest of Europe), Asia Pacific (China, India, Japan, South Korea, Australia, ASEAN Countries, Rest of Asia Pacific), Middle East & Africa (UAE, Saudi Arabia, Qatar, South Africa, Rest of Middle East & Africa), Latin America (Brazil, Argentina, Mexico, Colombia, Rest of Latin America). |
| Company Profiles | IBM Corporation, GAVS Technologies, Amazon Web Services, Inc., Databricks, Inc., DataRobot, Inc., Microsoft Corporation, Cloudera, Inc., Akira AI, Alteryx, Google LLC, H2O.ai, NVIDIA Corporation, Tecton, Paperspace, Kubeflow, MLflow, Seldon Technologies, ClearML, Weight & Biases, Neptune.ai |
Get in Touch
