Neem Extracts Market Report Scope & Overview:
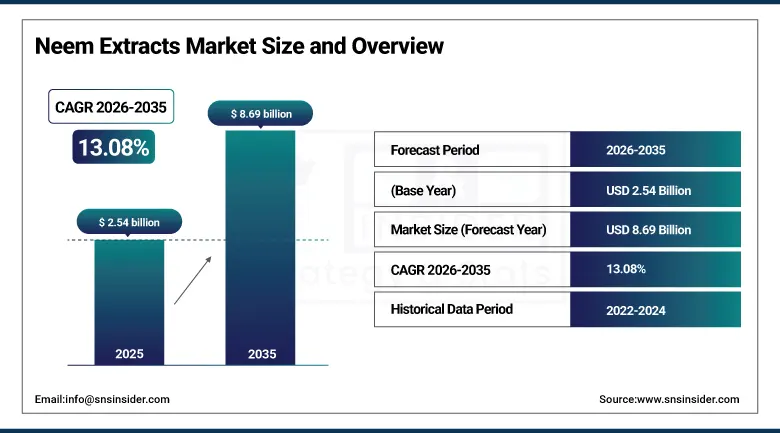
The Neem Extracts Market was valued at USD 2.54 billion in 2025 and is expected to reach USD 8.69 billion by 2035, growing at a CAGR of 13.08% from 2026–2035.
The neem extracts market encompasses the global industry for bioactive compounds derived from various parts of the neem tree (Azadirachta indica), including seeds, leaves, bark, and fruit, that contain potent concentrations of azadirachtin, nimbin, nimbidin, gedunin, and other terpenoids and limonoids with documented pesticidal, antimicrobial, anti-inflammatory, antifungal, and immunomodulatory properties. Neem extracts are utilized across an extraordinarily diverse application spectrum spanning bio-based crop protection and soil amendment in sustainable agriculture, active ingredient formulation in natural skincare, haircare, and oral care personal care products, herbal medicine and dietary supplement manufacturing in the pharmaceuticals and nutraceuticals sector, and natural preservative and flavor applications in food and beverage. The market’s growth is structurally underpinned by the global transition away from synthetic chemical inputs in agriculture, personal care, and healthcare toward nature-derived, sustainable, and toxicologically benign alternatives that satisfy escalating consumer demand for clean-label, organic-certified, and environmentally responsible products across all major consuming geographies.
The neem extracts market’s 13.08% compound annual growth rate (CAGR) from 2026 to 2035 indicates a clear trend toward the alignment of growth in the scope of organic farming, change towards natural ingredients in personal care products, revival of herbal medicine, and climate change-induced demand for organic crop protection input, making neem extract among the most commercially active substances in the botanical sector. In 2024, multiple indie brands introduced their neem-containing serums and soaps for people with sensitive skin on Amazon and Whole Foods platforms, which is an indication of how deep into mainstream retail the neem-based products have entered. Seed extracts represent the largest share of the market with over 40% of the total due to high content of azadirachtin and extensive agricultural application, whereas leading suppliers of neem extracts include E.I.D. Parry, GreeNeem Agri, and Agro Extracts, operating out of India.
Market Size and Forecast
- Study Period: 2022–2035
- Market Size (2026E): USD 2.87 Billion
- Market Size (2035): USD 8.69 Billion
- CAGR: 13.08% from 2026 to 2035
- Fastest Growing Region: Asia Pacific
- Largest Region: Asia Pacific
To Get more information on Neem Extracts Market - Request Free Sample Report
Neem Extracts Market Trends
- Rising global adoption of organic farming practices is increasing demand for neem-based bio-pesticides and bio-fertilizers as sustainable crop protection solutions.
- Growing consumer preference for herbal skincare, haircare, and personal care products is accelerating the use of neem extracts in cosmetic formulations.
- Increasing utilization of neem extracts in Ayurvedic medicine, nutraceuticals, and herbal pharmaceutical products is supporting market expansion globally.
- Expanding use of neem cake and neem oil as organic soil conditioners and natural pest control agents is driving sustainable agriculture applications.
- Government support for bio-based agricultural inputs and herbal product manufacturing is encouraging commercialization and export growth of neem-derived products.
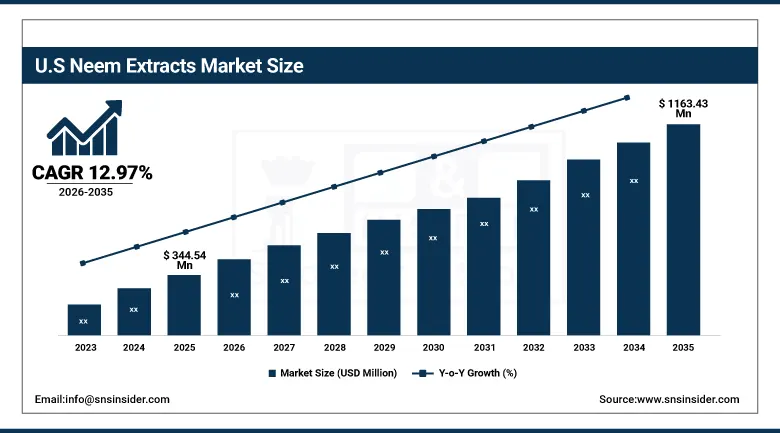
The U.S. Neem Extracts Market Size Outlook
The U.S. Neem Extracts Market was valued at approximately USD 344.54 million in 2025 and is expected to reach USD 1,163.43 million by 2035, growing at a CAGR of approximately 12.97%, driven by increasing consumer demand for organic personal care products, rising dietary supplement utilization of neem-based herbal formulations, and growing organic agriculture adoption under USDA National Organic Program certification.
The United States serves as the primary country for the North American neem extracts market and as the largest importer of neem extract ingredients in the world due to the FDA’s GRAS status accorded to some of its components which make them widely applicable in the manufacture of dietary items; additionally, the large number of cosmetic products incorporating neem extracts as key ingredients in the formulation of personal care items distributed by Whole Foods and Amazon among other wellness stores. Moreover, the agricultural industry of the United States applies a number of neem azadirachtin-based pesticides such as Azatin, Aza-Direct, and Neemix within the production of certified organic fruits, vegetables, and plants wherein effectiveness against aphids, whiteflies, thrips, and Lepidoptera larvae is proven.
In the year 2024, several indie brands of skincare products were introduced in Whole Foods and Amazon containing neem extracts used for treating eczema and acne affected skin.
Neem Extracts Market Segment Analysis
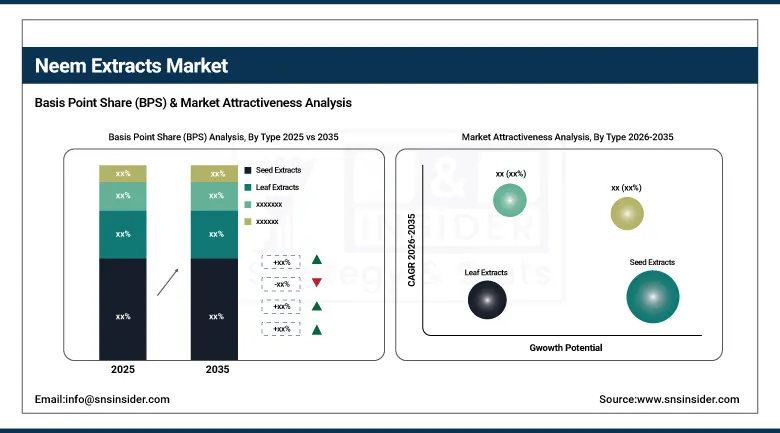
- By Type, seed extracts dominated with approximately 40% revenue share in 2025, driven by their high azadirachtin concentration and wide agricultural bio-pesticide application; leaf extracts are the fastest-growing type at the highest CAGR, driven by personal care and pharmaceutical sector adoption of leaf extract’s antioxidant, antibacterial, and anti-inflammatory properties.
- By Application, agriculture & farming led with the largest revenue share in 2025, accounting for approximately 42% of market revenues through bio-pesticide, bio-fertilizer, and nematicide deployments; personal care & cosmetics is the fastest-growing application driven by clean-label consumer trends and organic skincare brand proliferation.
- By Form, oil dominated with approximately 38% share in 2025, reflecting neem oil’s established utility across agricultural spray formulations and personal care product bases; powder is the fastest-growing form driven by nutraceutical supplement capsule and tablet manufacturing.
- By Distribution Channel, direct sales/B2B dominated with the largest revenue share driven by institutional agricultural and pharmaceutical procurement; online retail is the fastest-growing distribution channel as direct-to-consumer natural product brands scale through e-commerce platforms.
By Type: Seed Extracts dominate, Leaf Extracts fastest-growing
Seed extract products accounted for around 40% market share in the global neem extracts market in 2025 owing to their relatively higher azadirachtin content and wide usage in various bio-pesticide applications in agriculture industry. Seed extracts of the neem tree are extensively used in organic farming for controlling insects and pests owing to their powerful pesticide content.
Neem leaf extracts are expected to witness the highest CAGR during 2026-2035 on account of rising demand from personal care, cosmetics, and pharmaceutical end-user industries. These products have powerful properties of antioxidants, anti-bacterial, and anti-inflammatory nature, thus widely used in nutraceutical products and hair care formulations.
By Application: Agriculture leads, Personal Care fastest-growing
Agriculture & farming accounted for the largest revenue share in 2025, representing approximately 42% of market revenues through growing deployment of neem-based bio-pesticides, bio-fertilizers, and nematicides. Rising global organic farming activities and increasing restrictions on synthetic agrochemicals continue to strengthen demand for neem-derived agricultural solutions.
Personal care & cosmetics is expected to be the fastest-growing application segment through 2035, supported by rising consumer preference for herbal and clean-label beauty products. Neem extracts are increasingly incorporated into skincare, haircare, soaps, and oral care products due to their antimicrobial and skin-soothing benefits.
By Form, Oil Dominated the Market in 2025, While Powder is the Fastest-Growing Segment
The oil category will dominate the market for neem extract in 2025 accounting for 38% share, due to extensive usage of neem oil in agricultural spray preparations, personal care products, and for various therapeutic purposes. The oil form of neem continues to gain significant preference in terms of crop protection, insect repellents, skin care treatments, and herbal medicine formulations.
The powder form segment will be the fastest growing one till 2035, owing to rising demand from the nutraceuticals, pharmaceuticals, and dietary supplement production industries. Neem powder form is gaining popularity in various formulations including capsules, tablets, herbal teas, and wellness products due to its convenience and extended shelf-life.
By Distribution Channel, Direct Sales/B2B Dominated the Market in 2025, While Online Retail is the Fastest-Growing Segment
Direct sales/B2B led the market in 2025 due to heavy buying from agrarian companies, drug manufacturers, and skin care product manufacturers. Purchasing from institutions and bulk supplies will continue to fuel robust B2B sales for industrial use.
Online retail is expected to lead in terms of growth rate in distribution channels until 2035 due to the increased penetration of wellness and organic skin care products online. Increasing internet usage by consumers, direct-to-consumer sales models, and increasing availability of herbal products around the world are boosting online sales of neem extract.
Regional Analysis
|
Region |
Major Country |
Share within Region, 2025 (%) |
|---|---|---|
|
North America |
United States |
~84% |
|
Europe |
Germany |
~26% |
|
Asia Pacific |
India |
~58% |
|
Middle East & Africa |
South Africa |
~27% |
|
Latin America |
Brazil |
~43% |
North America Neem Extracts Market Insights
North America is the second-largest neem extracts market, dominated by the United States’ large organic agriculture sector, mature natural personal care market, and well-developed dietary supplement industry that collectively consume substantial neem extract volumes imported primarily from Indian manufacturers. The USDA National Organic Program’s acceptance of azadirachtin-based biopesticides as certified organic crop protection inputs provides a regulatory foundation for sustained U.S. agricultural neem extract demand, while the FDA’s GRAS listing for certain neem components enables broad dietary supplement and food-grade applications.
Get Customized Report as per Your Business Requirement - Enquiry Now
Europe Neem Extracts Market Insights
Europe represents a growing neem extracts market where the EU’s Farm to Fork strategy targeting 25% organic farming area by 2030 and 50% reduction in synthetic pesticide use by 2030 is creating structural regulatory demand for neem-based biopesticide alternatives, and the region’s strong natural cosmetics sector led by Germany, France, and the Netherlands provides a premium market for certified organic neem ingredients in Cosmos-certified and Ecocert-validated personal care formulations. The European Food Safety Authority’s approval of azadirachtin (Margosa extract) as an active substance under EU Regulation provides the regulatory framework for agricultural deployment.
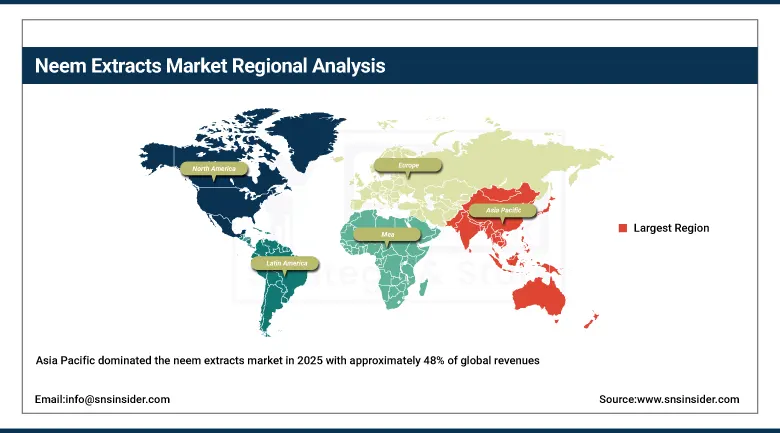
Asia Pacific Neem Extracts Market Insights
Asia Pacific dominated the neem extracts market in 2025 with approximately 48% of global revenues, anchored by India’s status as the world’s primary neem tree cultivation and extract production nation, India’s 7.3 million hectares of organic farmland generating captive bio-pesticide demand, and the region’s extensive traditional medicine ecosystems including India’s Ayurveda, Indonesia’s Jamu, and China’s herbal medicine traditions that have sustained neem extract utilization across pharmaceutical and personal care applications for millennia. India’s National AYUSH Mission investment and the government’s Pradhan Mantri Fasal Bima Yojana crop insurance program’s promotion of integrated pest management using bio-pesticides are structurally reinforcing neem agricultural demand. Asia Pacific is simultaneously the fastest-growing region, with China, Thailand, and Vietnam’s organic farming expansion and growing premium natural personal care markets accelerating neem extract consumption beyond the Indian domestic base.
Latin America & Middle East and Africa Neem Extracts Market Insights
Latin America and the Middle East & Africa represent growing neem extract markets where tropical and subtropical agricultural systems, traditional herbal medicine practices, and expanding natural personal care markets are driving adoption. Brazil leads Latin American market development through its large tropical fruit and vegetable export agriculture requiring biopesticide inputs for international market access, growing domestic organic farming certification programs, and expanding natural cosmetics brands incorporating neem in product formulations. South Africa leads Sub-Saharan African market development through its established neem tree cultivation programs and commercial biopesticide distribution network serving export-oriented horticultural production.
Market Dynamics
Growth Drivers: Global organic agriculture expansion, clean-label consumer movement, and herbal medicine resurgence driving sustained demand
The first major catalyst behind the development of neem extracts market will be the growing trend among policymakers and consumers worldwide towards lower levels of chemicals in agriculture, personal care, and healthcare applications that sees neem as a unique and highly diverse botanical solution suitable for several industry transitions. As demonstrated by the 75.8 million hectares of organic agriculture area reported by the FAO for 2023, the European Union’s “From Farm to Fork” initiative’s mandate to reduce pesticide usage by 2030, and the Indian government’s Pradhan Mantri Krishi Sinchai Yojana program for sustainable agriculture, regulatory and strategic factors contribute to significant demand for neem extracts that does not depend on changes in commodity prices. The current trend of the global natural personal care market towards the use of botanical and organic ingredients, with about 60% of new product introductions using plant-derived active ingredients, represents another growth vector for this demand.
Restraints: Supply concentration in India, quality standardization challenges, and regulatory variability across markets constraining growth
The neem extracts market faces structural constraints from geographic supply concentration in India, where seasonal neem seed availability, monsoon-dependent harvest variability, logistical infrastructure limitations in rural collection areas, and inconsistent extraction facility quality standards create supply reliability and product quality consistency challenges for industrial buyers requiring certified specification compliance across large-volume procurement programs. Regulatory variability across markets with the EU, U.S., and Australia maintaining different maximum residue limits and registration requirements for azadirachtin-based agricultural products creates market access complexity for Indian exporters and limits the speed at which new agricultural application registrations can be secured across multiple export markets simultaneously.
Opportunities: Premium functional food ingredients, veterinary health applications, and integrated pest management program expansion creating long-term growth
The neem extracts market’s most significant growth opportunity beyond its established application base lies in the expansion into functional food and nutraceutical ingredient applications, where neem extract’s documented anti-diabetic, immunomodulatory, and anti-inflammatory bioactivities position it for integration into evidence-based dietary supplement formulations targeting metabolic health, immune support, and inflammatory condition management in the rapidly growing global nutraceutical market. Veterinary health represents a substantial adjacent opportunity, as neem-based ectoparasiticide formulations for tick, flea, and mite control in companion animals and livestock offer an organic-compatible alternative to synthetic parasiticides that is attracting investment from animal health companies responding to pet owner demand for natural veterinary care options.
Recent Developments:
- 2025: E.I.D. Parry (India) Limited, a subsidiary of Murugappa Group, continued expanding its neem extract production and processing capacity at its Tamil Nadu facilities in response to growing global demand for pharmaceutical-grade and agricultural-grade neem extracts, reinforcing India’s position as the world’s primary neem extract manufacturing hub serving both domestic and international market requirements.
- 2025: Trifolio-M GmbH in Germany advanced the registration and commercialization of its NeemAzal-T/S azadirachtin-based biopesticide formulation across additional EU member state markets, expanding European agricultural access to certified organic neem-derived crop protection inputs aligned with EU Farm to Fork pesticide reduction mandate compliance requirements.
- 2024: Himalaya Herbal Healthcare expanded its neem-based personal care product portfolio with new neem leaf extract face wash and anti-acne treatment formulations distributed through international retail channels across Europe, North America, and the Middle East, demonstrating the continuing premiumization of neem personal care products in export markets beyond the traditional Indian domestic consumer base.
- 2024: GreeNeem Agri Pvt. Ltd. (India) launched a new range of standardized neem extract powders and granules for organic fertilizer and soil treatment applications specifically formulated for the European organic farming market’s Cosmos and ECOCERT quality standards, reflecting the increasing export market sophistication required by international institutional buyers.
Neem Extracts Market Key Players are:
- E.I.D. Parry (India) Limited (Murugappa Group)
- GreeNeem Agri Pvt. Ltd.
- Agro Extracts Limited
- Parker Biotech Pvt. Ltd.
- Fortune Biotech Ltd.
- Ozone Biotech Pvt. Ltd.
- PJ Margo Pvt. Ltd.
- Trifolio-M GmbH
- Certis USA LLC
- Neeming Australia Pty Ltd
- Himalaya Drug Company
- Organic India Pvt. Ltd.
- Neem Biotech Ltd.
- Futureco Bioscience
- Dhanuka Agritech Ltd.
- Sumitomo Chemical India Ltd.
- Krishna Organics
- Ajay Bio-Tech Ltd.
- SUN BIONATURALS (INDIA) PRIVATE LTD.
- IFC Ltd.
Neem Extracts Market Report Scope:
| Report Attributes | Details |
|---|---|
| Market Size in 2025 | USD 2.54 Billion |
| Market Size by 2035 | USD 8.69 Billion |
| CAGR | CAGR of 13.08% From 2026 to 2035 |
| Base Year | 2025 |
| Forecast Period | 2026-2035 |
| Historical Data | 2022-2024 |
| Report Scope & Coverage | Market Size, Segments Analysis, Competitive Landscape, Regional Analysis, DROC & SWOT Analysis, Forecast Outlook |
| Key Segments | •By Type (Seed Extracts, Leaf Extracts, Bark Extracts, Fruit Extracts) •By Form (Oil, Powder, Liquid Extract, Cake) •By Application (Agriculture & Farming, Personal Care & Cosmetics, Pharmaceuticals & Nutraceuticals, Food & Beverage, Animal Feed & Veterinary, Others) •By Distribution Channel (Direct Sales / B2B, Online Retail, Specialty Health Stores, Pharmacies, Supermarkets & Hypermarkets) |
| Regional Analysis/Coverage | North America (US, Canada), Europe (Germany, UK, France, Italy, Spain, Russia, Poland, Rest of Europe), Asia Pacific (China, India, Japan, South Korea, Australia, ASEAN Countries, Rest of Asia Pacific), Middle East & Africa (UAE, Saudi Arabia, Qatar, South Africa, Rest of Middle East & Africa), Latin America (Brazil, Argentina, Mexico, Colombia, Rest of Latin America). |
| Company Profiles | E.I.D. Parry (India) Limited (Murugappa Group), GreeNeem Agri Pvt. Ltd., Agro Extracts Limited, Parker Biotech Pvt. Ltd., Fortune Biotech Ltd., Ozone Biotech Pvt. Ltd., PJ Margo Pvt. Ltd., Trifolio-M GmbH, Certis USA LLC, Neeming Australia Pty Ltd, Himalaya Drug Company, Organic India Pvt. Ltd., Neem Biotech Ltd., Futureco Bioscience, Dhanuka Agritech Ltd., Sumitomo Chemical India Ltd., Krishna Organics, Ajay Bio-Tech Ltd., SUN BIONATURALS (INDIA) PRIVATE LTD., and IFC Ltd. |
Frequently Asked Questions
Asia Pacific dominated the market with approximately 48% share in 2025, supported by large-scale neem cultivation and growing organic agriculture demand in India.
Agriculture & Farming led the market with approximately 42% revenue share due to increasing use of neem-based bio-pesticides and organic farming inputs.
Seed Extracts dominated the market in 2025 with over 40% revenue share, driven by strong demand in bio-pesticide and personal care applications.
The Neem Extracts Market was valued at USD 2.54 billion in 2025 and is expected to reach USD 8.69 billion by 2035.
The Neem Extracts Market is expected to grow at a CAGR of 13.08% from 2026 to 2035.
Get in Touch
