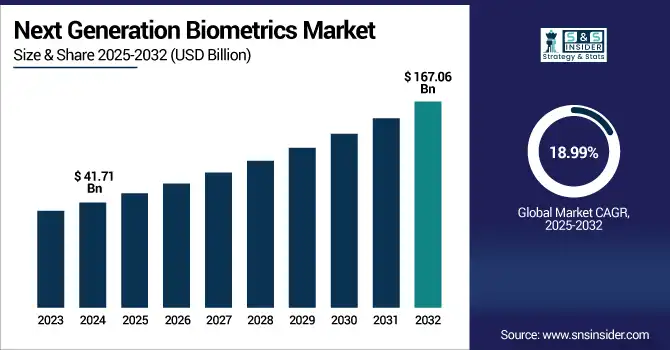
The Next Generation Biometrics Market size was valued at USD 41.71 billion in 2024 and is expected to reach USD 167.06 billion by 2032 and grow at a CAGR of 18.99% over the forecast period 2025-2032.
The global market is thoroughly segmented by technology, application, deployment model, end-user, region, and key market dynamics in terms of drivers, restraints, opportunities, and challenges. Ongoing adoption is being fueled by an increasing demand for secure and contactless authentication, and the rising implementation of biometrics in government, defense, and enterprise systems. Continuous technological advancements and technological initiatives for digital identity are also some factors supporting high Next generation biometrics market growth globally.
For instance, biometric systems are estimated to reduce identity fraud incidents by over 50% compared to traditional methods.
The U.S. Next Generation Biometrics Market size was USD 9.62 billion in 2024 and is expected to reach USD 37.36 billion by 2032, growing at a CAGR of 18.54% over the forecast period of 2025–2032.
The U.S. market is poised to witness a 12.5% growth fueled by stringent national security mandates, increased deployment of biometric systems for border control and e-governance, and early adoption of advanced technologies. The company already has a substantial tech architecture and expanding demand for secure identity verification in the banking and healthcare sectors also bodes well. The U.S. Biometrics market is fueling novel development of Next Generation Biometrics as continued public & private sector investments on advanced authentication solutions receive significant traction.
For instance, nearly 90% of smartphones in the U.S. support biometric authentication methods, including fingerprint and facial ID.
Key Drivers:
Widespread Use of Biometrics in Consumer Devices and Enterprise Authentication for Improved Access Control
Use of biometrics in consumer electronics has become the norm for secure and user-friendly authentication methods in devices such as smartphones, wearables, and laptops. The financial services and fintech sectors are also using both facial and fingerprint biometrics for fraud detection and safer banking. Moreover, enterprises are employing biometric access control systems at critical infrastructure and sites for protection against unauthorized access. The increasing commercial adoption of biometrics, particularly mobile-based authentication, is certainly stimulating volume demand and innovation in embedded biometric sensors and software.
For instance, around 65% of fintech apps globally now offer biometric logins as a primary or optional authentication method.
Restraints:
Data Privacy Concerns and Ethical Challenges Associated with the Storage and Use of Biometric Information
Since biometric data cannot be issued again, like a password, its hacking has led to many security and identity stealing issues. As it has become more popular these issues have extended the discussions around consent, surveillance overreach and ownership of data. Privacy blowback It has also caused cases of unconsented facial recognition usage, data leaks, and algorithmic discrimination. Even as the deployment of biometrics accelerates, lack of trust remains a major barrier in regions lacking sound data protection legislation and legal and regulatory uncertainty continues to act as a brake on wider adoption, particularly for civil applications, globally.
Opportunities:
Technological Innovations in AI and Multimodal Biometric Systems for More Accurate and Secure Authentication
There is a whole new technological frontier out there for the biometrics market. The recognition of biometrics is getting more accurate, faster, and contextual performance enhancement are all made possible through AI and deep learning algorithms even if you are fairly in the noise or low-light environment. A new multimodal system that combines face, voice, and iris data provides higher authentication reliability and helps reduce false positives. Advancements you will catch a glimpse of in law enforcement, surveillance and enterprise level cybersecurity. High growth niches will be available for vendors developing edge ai enabled biometric solutions and frictionless authentication systems.
For instance, multimodal biometric systems can reduce false acceptance rates (FAR) by up to 80% compared to unimodal systems.
Challenges:
Increasing Spoofing Threats and Rapid Obsolescence of Biometric Systems in an Evolving Security Landscape
The widespread availability of biometric systems is a breeding ground for risks such as spoofing, deepfake manipulation, and cyberattacks on biometric databases. More and more, attackers are finding ways to bypass facial recognition security systems, for example by using mask attacks or fingerprint replication. Most existing deployments do not have real-time liveness and anti-spoofing support. In addition, systems can quickly become obsolete, particularly in areas with delayed procurement cycles, as innovation moves at a rapid pace. This is a relentless pressure to both vendors and end-users to keep upgrading, protecting, and testing these biometric systems for new threats. Next Generation Biometrics Market trends highlight rising demand for anti-spoofing capabilities.
By Type of Biometric Technology
Fingerprint Recognition dominated the Next Generation Biometrics Market share by 34.20% in 2024. Fingerprint Recognition has become widely used in a large number of mobile devices and government ID programs as well as access control systems. Companies such as IDEMIA can be found in large-scale fingerprinting solution available for law enforcement and border control agencies. It is a reliable, easy-to-use, and cost-effective tool that is suitable for large-scale implementation. Billions of smartphones come embedded with fingerprint scanners; they are also used for ATMs, the office and border control.
Facial Recognition is projected to have the highest CAGR of 20.21% during the forecast period of 2024 to 2032. One of the most preferred biometric characteristics due to its contactless and fast verification speed, which is utilized more in surveillance, airports and mobile authentication. NEC Corporation has been instrumental in implementing facial recognition systems in international airports and police agencies around the world. Its rapid market expansion is driven by increasing adoption in the public safety, banking and retail industries along with smart city applications.
By Application
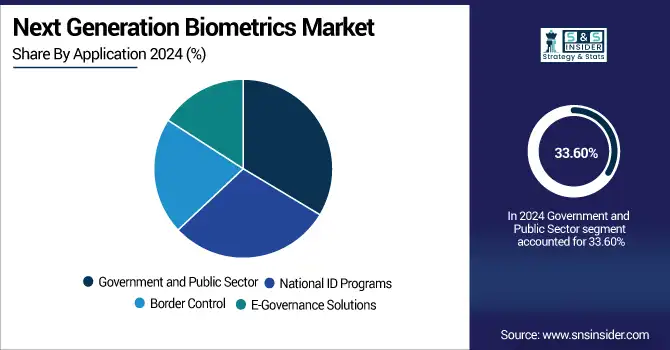
In 2024, Government and Public Sector had the largest revenue share of 33.60% of the market as it includes large-scale deployments as national security, law enforcement civil administration and public welfare distribution. Secure identity and surveillance systems from Thales Group assist various marriage programs through the government. In countries with large and constantly changing populations, such as those in Asia and Africa, biometric systems can make sectors like defense, immigration, and public benefits more transparent, reduce fraud, and help in service delivery.
The National ID Programs segment is expected to be the fastest growing segment with a CAGR of 20.59% during 2024–2032. Biometric national ID programs are being rolled out in parts of Asia, Africa and Latin America by governments looking to promote digital identity, rationalize citizen services and facilitate financial inclusion. MorphoTrust USA, a division of IDEMIA, which has participated in national ID and driving license programs. These programs are key to building a greater governed and more universal access to livelihoods.
By Deployment Model
On-Premise deployment dominated the Next Generation Biometrics Market in 2024, which led the way with a share of 24.60%; this is due to the continued preference for on-premise deployment in secure and regulated environments. On-premise is likely favored by defense, government, and critical infrastructure sectors which would prefer to keep their data in-house. Organizations such as Bio-key International implement on-premise biometric authentication for law enforcement and enterprise networks. Deployments like this will always be around sensitive, personal data where maximum data protection and compliance through localized processing is required.
Cloud-Based is projected to rise with the fastest CAGR of 21.95% during 2024 to 2032. Cloud-based biometrics are scalable, remote, and economical. Companies such as Aware, Inc., are providing biometric-as-a-service platforms which are pushing cloud adoption across the banking, travel, and telecom industries. The accelerating spread of mobile onboarding, eKYC, and digital services is transforming cloud infrastructure into an essential facilitator of biometric segmentation throughout the world economy. Next Generation Biometrics Market analysis shows rising demand for cloud scalability.
By End-User
Defense sector was accounted for 28.30% revenue share in 2024, which is significantly higher than the other market and owing to high scale application of biometrics in surveillance, access control, and national security. Accurate high-speed recognition system is essential for military and intelligence agencies. BAE Systems has sophisticated biometric solutions designed for combat and military identification. Biometric technology ruggedization/anti-tamper requirements driven in this direction are reflected in continuing strong market leadership in defense investment and volume.
The education segment is projected to expand at the highest CAGR of 21.27% during 2024 to 2032. From secure attendance taking, to identity verification and entry points to facilities, schools and universities have adopted biometrics at an increasing rate. The biometric attendance system is used in education institutes internationally and ZKTeco is one of the key providers of this technology. Biometric platforms that are convenient to use and secure for both students and schools have increased as we move beyond COVID lockdowns and shift towards safer, more seamless access to and services within our campuses.
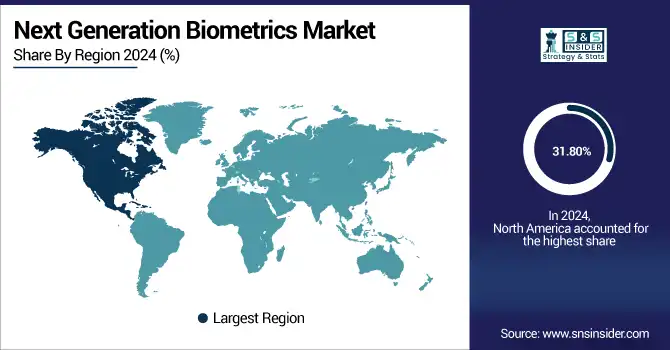
The North America market led the global industry in 2024, as it accounted for the largest revenue share of 31.80%. The growth in Asia Pacific is attributed to early adoption of advanced biometric technologies, high government expenditure, and a well-established security infrastructure. High demand, especially in the fields of defense, border control, financial services, and healthcare fuels continuous market growth. In the U.S. and Canada, the ubiquity of leading biometric technology providers and robust data protection regulations further enables widespread deployment in both public and private sector use cases.
The U.S. dominates the North American biometrics market due to strong government investment in homeland security, widespread deployment in border control, and rapid adoption across banking, healthcare, and consumer electronics, supported by advanced infrastructure and key biometric technology providers.
Asia Pacific region is anticipated to be the fastest growing CAGR of 19.92% during the period of 2024 to 2032. Good demand driven by rapid digital transformation, high population density and growing government identity programs. Biometric authentication for financial services, citizen ID, and public benefits are being launched in countries including India, China, Indonesia, and the Philippines; Strong mobile penetration across the region organized smart city projects and rising security concerns will drive adoption in all verticals across the region.
China leads the Asia Pacific biometrics market owing to large-scale government surveillance programs, widespread facial recognition deployment, integration in fintech and smartphones, and massive public sector initiatives, driven by strong domestic companies and favorable regulatory frameworks supporting technology implementation.
Europe is a significant region in the Next Generation Biometrics Market, due to rising demand for secure identity verification in border control, banking, and healthcare. Regulations are the driving forces to create the enabling environments for trusted biometric adoptions like EU push for digital ID frameworks and data privacy regulation like GDPR. Germany, the UK, and France are pouring millions into government sector biometrics systems.
Germany leads the European biometrics market due to strong government initiatives, advanced industrial infrastructure, and widespread use in border control and digital ID programs. Its focus on data protection and early adoption of AI-powered biometric systems further drives its dominance.
Middle East & Africa is led by the UAE, owing to its highly developed digital identity programs, smart city projects, and biometric-based immigration and border security systems. Brazil is at the forefront of wide-scale biometric adoption in voting, banking and law enforcement in Latin America, powered by government support and the full implementation of digital transformation initiatives.
Major Key Players in Next Generation Biometrics companies are Thales Group, IDEMIA, NEC Corporation, ASSA ABLOY, Fujitsu Limited, Suprema Inc., Bio-Key International Inc., Cognitec Systems GmbH, Aware Inc., HID Global (an ASSA ABLOY brand), Synaptics Incorporated, Precise Biometrics, Dermalog Identification Systems GmbH, Fingerprint Cards AB, ZKTeco Co. Ltd., Gemalto N.V. (a Thales company), ImageWare Systems Inc., IriTech Inc., Daon Inc. and Secunet Security Networks AG and others.
In January 2025, IDEMIA launched its F.CODE Biometric Payment Card Enrollment Device, a USB‑C dongle that enables fingerprint enrollment directly via a user’s smartphone (iOS or Android), facilitating seamless onboarding and eliminating PIN entry during contactless payments.
In February 2025, NEC unveiled digital signature technology that performs facial biometric authentication without storing facial images by generating cryptographic keys from fluctuating facial data, enhancing privacy and reducing risk of data leakage.
Report Attributes | Details |
---|---|
Market Size in 2024 | USD 41.71 Billion |
Market Size by 2032 | USD 167.06 Billion |
CAGR | CAGR of 18.99% From 2025 to 2032 |
Base Year | 2024 |
Forecast Period | 2025-2032 |
Historical Data | 2021-2023 |
Report Scope & Coverage | Market Size, Segments Analysis, Competitive Landscape, Regional Analysis, DROC & SWOT Analysis, Forecast Outlook |
Key Segments | • By Type of Biometric Technology (Fingerprint Recognition, Facial Recognition, Iris Recognition, Voice Recognition, Vein Recognition and Gait Recognition) • By Application (Government and Public Sector, National ID Programs, Border Control and E-Governance Solutions) • By Deployment Model (On-Premise, Hardware Solutions, Software Solutions, Cloud-Based, Hybrid Solutions and Fully Managed Services) • By End-User (Telecommunications, Automotive, Education, Manufacturing and Defense) |
Regional Analysis/Coverage | North America (US, Canada, Mexico), Europe (Germany, France, UK, Italy, Spain, Poland, Turkey, Rest of Europe), Asia Pacific (China, India, Japan, South Korea, Singapore, Australia,Taiwan, Rest of Asia Pacific), Middle East & Africa (UAE, Saudi Arabia, Qatar, South Africa, Rest of Middle East & Africa), Latin America (Brazil, Argentina, Rest of Latin America) |
Company Profiles | Thales Group, IDEMIA, NEC Corporation, ASSA ABLOY, Fujitsu Limited, Suprema Inc., Bio-Key International Inc., Cognitec Systems GmbH, Aware Inc., HID Global (an ASSA ABLOY brand), Synaptics Incorporated, Precise Biometrics, Dermalog Identification Systems GmbH, Fingerprint Cards AB, ZKTeco Co. Ltd., Gemalto N.V. (a Thales company), ImageWare Systems Inc., IriTech Inc., Daon Inc. and Secunet Security Networks AG. |
Ans: The Next Generation Biometrics Market is expected to grow at a CAGR of 18.99% from 2025-2032.
Ans: The Next Generation Biometrics Market size was USD 41.71 Billion in 2024 and is expected to reach USD 167.06 Billion by 2032.
Ans: The major growth factor is rising demand for secure, contactless authentication across government, financial, and enterprise digital identity systems.
Ans: The On-Premise segment dominated the Next Generation Biometrics Market in 2024.
Ans: North America dominated the Next Generation Biometrics Market in 2024.
Table Of Contents
1. Introduction
1.1 Market Definition & Scope
1.2 Research Assumptions & Abbreviations
1.3 Research Methodology
2. Executive Summary
2.1 Market Snapshot
2.2 Market Absolute $ Opportunity Assessment & Y-o-Y Analysis, 2021–2032
2.3 Market Size & Forecast, By Segmentation, 2021–2032
2.3.1 Market Size By Type of Biometric Technology
2.3.2 Market Size By Application
2.3.3 Market Size By Deployment Model
2.3.4 Market Size By End-User
2.4 Market Share & Bps Analysis By Region, 2024
2.5 Industry Growth Scenarios – Conservative, Likely & Optimistic
2.6 Industry CxO’s Perspective
3. Market Overview
3.1 Market Dynamics
3.1.1 Drivers
3.1.2 Restraints
3.1.3 Opportunities
3.1.4 Key Market Trends
3.2 Industry PESTLE Analysis
3.3 Key Industry Forces (Porter’s) Impacting Market Growth
3.4 Industry Supply Chain Analysis
3.4.1 Raw Material Suppliers
3.4.2 Manufacturers
3.4.3 Distributors/Suppliers
3.4.4 Customers/End-Users
3.5 Industry Life Cycle Assessment
3.6 Parent Market Overview
3.7 Market Risk Assessment
4. Statistical Insights & Trends Reporting
4.1 Adoption & Penetration Statistics
4.1.1 Overview
4.1.2 Adoption Rates by Industry (Government, BFSI, Healthcare, Consumer Electronics)
4.1.3 Biometric Usage Penetration in End-User Applications
4.1.4 Device-Level Biometric Integration Trends (Smartphones, Laptops, Wearables)
4.1.5 Deployment Statistics Across Authentication Use Cases
4.2 Authentication Success & Failure Rates
4.2.1 Overview
4.2.2 False Acceptance Rate (FAR) vs. False Rejection Rate (FRR) Comparison
4.2.3 Success Rate by Biometric Modality (Fingerprint, Facial, Iris, Voice)
4.2.4 Real-World Authentication Accuracy Metrics
4.2.5 Performance Gaps in High-Risk Use Cases (Banking, Border Control)
4.3 Technology Performance Metrics
4.3.1 Overview
4.3.2 Recognition Speed Benchmarks by Modality
4.3.3 Accuracy Under Environmental Constraints (Low Light, Noise, Obstruction)
4.3.4 Power Consumption Metrics in Embedded Biometric Devices
4.3.5 Multi-Modal System Efficiency Metrics
4.4 Integration & Deployment Stats
4.4.1 Overview
4.4.2 Cloud vs. On-Premise Biometric Deployment Ratios
4.4.3 Deployment Timeframes by Sector (Banking, Law Enforcement, Airports)
4.4.4 Integration Rates with Mobile Devices and Enterprise Platforms
4.4.5 Biometric-as-a-Service Utilization Across End-User Segments
4.5 R&D and Patent Activity
4.5.1 Overview
4.5.2 Patent Filing Volume by Company and Region
4.5.3 Emerging Innovation Areas (Edge AI, Behavioral Biometrics, Contactless Tech)
4.5.4 Government-Funded Biometric R&D Projects
4.5.5 Collaborative R&D and Academic Contributions
5. Next Generation Biometrics Market Segmental Analysis & Forecast, By Type of Biometric Technology, 2021 – 2032, Value (Usd Billion)
5.1 Introduction
5.2 Fingerprint Recognition
5.2.1 Key Trends
5.2.2 Market Size & Forecast, 2021 – 2032
5.3 Facial Recognition
5.3.1 Key Trends
5.3.2 Market Size & Forecast, 2021 – 2032
5.4 Iris Recognition
5.4.1 Key Trends
5.4.2 Market Size & Forecast, 2021 – 2032
5.5 Voice Recognition
5.5.1 Key Trends
5.5.2 Market Size & Forecast, 2021 – 2032
5.6 Vein Recognition
5.6.1 Key Trends
5.6.2 Market Size & Forecast, 2021 – 2032
5.7 Gait Recognition
5.7.1 Key Trends
5.7.2 Market Size & Forecast, 2021 – 2032
6. Next Generation Biometrics Market Segmental Analysis & Forecast, By Application, 2021 – 2032, Value (Usd Billion)
6.1 Introduction
6.2 Government and Public Sector
6.2.1 Key Trends
6.2.2 Market Size & Forecast, 2021 – 2032
6.3 National ID Programs
6.3.1 Key Trends
6.3.2 Market Size & Forecast, 2021 – 2032
6.4 Border Control
6.4.1 Key Trends
6.4.2 Market Size & Forecast, 2021 – 2032
6.5 E-Governance Solutions
6.5.1 Key Trends
6.5.2 Market Size & Forecast, 2021 – 2032
7. Next Generation Biometrics Market Segmental Analysis & Forecast, By Deployment Model, 2021 – 2032, Value (Usd Billion)
7.1 Introduction
7.2 On-Premise
7.2.1 Key Trends
7.2.2 Market Size & Forecast, 2021 – 2032
7.3 Hardware Solutions
7.3.1 Key Trends
7.3.2 Market Size & Forecast, 2021 – 2032
7.4 Software Solutions
7.4.1 Key Trends
7.4.2 Market Size & Forecast, 2021 – 2032
7.5 Cloud-Based
7.5.1 Key Trends
7.5.2 Market Size & Forecast, 2021 – 2032
7.6 Hybrid Solutions
7.6.1 Key Trends
7.6.2 Market Size & Forecast, 2021 – 2032
7.7 Fully Managed Services
7.7.1 Key Trends
7.7.2 Market Size & Forecast, 2021 – 2032
8. Next Generation Biometrics Market Segmental Analysis & Forecast, By End-User, 2021 – 2032, Value (Usd Billion)
8.1 Introduction
8.2 Telecommunications
8.2.1 Key Trends
8.2.2 Market Size & Forecast, 2021 – 2032
8.3 Automotive
8.3.1 Key Trends
8.3.2 Market Size & Forecast, 2021 – 2032
8.4 Education
8.4.1 Key Trends
8.4.2 Market Size & Forecast, 2021 – 2032
8.5 Manufacturing
8.5.1 Key Trends
8.5.2 Market Size & Forecast, 2021 – 2032
8.6 Defense
8.6.1 Key Trends
8.6.2 Market Size & Forecast, 2021 – 2032
9. Next Generation Biometrics Market Segmental Analysis & Forecast By Region, 2021 – 2025, Value (Usd Billion)
9.1 Introduction
9.2 North America
9.2.1 Key Trends
9.2.2 Next Generation Biometrics Market Size & Forecast, By Type of Biometric Technology, 2021 – 2032
9.2.3 Next Generation Biometrics Market Size & Forecast, By Application, 2021 – 2032
9.2.4 Next Generation Biometrics Market Size & Forecast, By Deployment Model, 2021 – 2032
9.2.5 Next Generation Biometrics Market Size & Forecast, By End-User, 2021 – 2032
9.2.6 Next Generation Biometrics Market Size & Forecast, By Country, 2021 – 2032
9.2.6.1 USA
9.2.6.1.1 Next Generation Biometrics Market Size & Forecast, By Type of Biometric Technology, 2021 – 2032
9.2.6.1.2 Next Generation Biometrics Market Size & Forecast, By Application, 2021 – 2032
9.2.6.1.3 Next Generation Biometrics Market Size & Forecast, By Deployment Model, 2021 – 2032
9.2.6.1.4 Next Generation Biometrics Market Size & Forecast, By End-User, 2021 – 2032
9.2.6.2 Canada
9.2.6.2.1 Next Generation Biometrics Market Size & Forecast, By Type of Biometric Technology, 2021 – 2032
9.2.6.2.2 Next Generation Biometrics Market Size & Forecast, By Application, 2021 – 2032
9.2.6.2.3 Next Generation Biometrics Market Size & Forecast, By Deployment Model, 2021 – 2032
9.2.6.2.4 Next Generation Biometrics Market Size & Forecast, By End-User, 2021 – 2032
9.3 Europe
9.3.1 Key Trends
9.3.2 Next Generation Biometrics Market Size & Forecast, By Type of Biometric Technology, 2021 – 2032
9.3.3 Next Generation Biometrics Market Size & Forecast, By Application, 2021 – 2032
9.3.4 Next Generation Biometrics Market Size & Forecast, By Deployment Model, 2021 – 2032
9.3.5 Next Generation Biometrics Market Size & Forecast, By End-User, 2021 – 2032
9.3.6 Next Generation Biometrics Market Size & Forecast, By Country, 2021 – 2032
9.3.6.1 Germany
9.3.6.1.1 Next Generation Biometrics Market Size & Forecast, By Type of Biometric Technology, 2021 – 2032
9.3.6.1.2 Next Generation Biometrics Market Size & Forecast, By Application, 2021 – 2032
9.3.6.1.3 Next Generation Biometrics Market Size & Forecast, By Deployment Model, 2021 – 2032
9.3.6.1.4 Next Generation Biometrics Market Size & Forecast, By End-User, 2021 – 2032
9.3.6.2 UK
9.3.6.2.1 Next Generation Biometrics Market Size & Forecast, By Type of Biometric Technology, 2021 – 2032
9.3.6.2.2 Next Generation Biometrics Market Size & Forecast, By Application, 2021 – 2032
9.3.6.2.3 Next Generation Biometrics Market Size & Forecast, By Deployment Model, 2021 – 2032
9.3.6.2.4 Next Generation Biometrics Market Size & Forecast, By End-User, 2021 – 2032
9.3.6.3 France
9.3.6.3.1 Next Generation Biometrics Market Size & Forecast, By Type of Biometric Technology, 2021 – 2032
9.3.6.3.2 Next Generation Biometrics Market Size & Forecast, By Application, 2021 – 2032
9.3.6.3.3 Next Generation Biometrics Market Size & Forecast, By Deployment Model, 2021 – 2032
9.3.6.3.4 Next Generation Biometrics Market Size & Forecast, By End-User, 2021 – 2032
9.3.6.4 Italy
9.3.6.4.1 Next Generation Biometrics Market Size & Forecast, By Type of Biometric Technology, 2021 – 2032
9.3.6.4.2 Next Generation Biometrics Market Size & Forecast, By Application, 2021 – 2032
9.3.6.4.3 Next Generation Biometrics Market Size & Forecast, By Deployment Model, 2021 – 2032
9.3.6.4.4 Next Generation Biometrics Market Size & Forecast, By End-User, 2021 – 2032
9.3.6.5 Spain
9.3.6.5.1 Next Generation Biometrics Market Size & Forecast, By Type of Biometric Technology, 2021 – 2032
9.3.6.5.2 Next Generation Biometrics Market Size & Forecast, By Application, 2021 – 2032
9.3.6.5.3 Next Generation Biometrics Market Size & Forecast, By Deployment Model, 2021 – 2032
9.3.6.5.4 Next Generation Biometrics Market Size & Forecast, By End-User, 2021 – 2032
9.3.6.6 Russia
9.3.6.6.1 Next Generation Biometrics Market Size & Forecast, By Type of Biometric Technology, 2021 – 2032
9.3.6.6.2 Next Generation Biometrics Market Size & Forecast, By Application, 2021 – 2032
9.3.6.6.3 Next Generation Biometrics Market Size & Forecast, By Deployment Model, 2021 – 2032
9.3.6.6.4 Next Generation Biometrics Market Size & Forecast, By End-User, 2021 – 2032
9.3.6.7 Poland
9.3.6.7.1 Next Generation Biometrics Market Size & Forecast, By Type of Biometric Technology, 2021 – 2032
9.3.6.7.2 Next Generation Biometrics Market Size & Forecast, By Application, 2021 – 2032
9.3.6.7.3 Next Generation Biometrics Market Size & Forecast, By Deployment Model, 2021 – 2032
9.3.6.7.4 Next Generation Biometrics Market Size & Forecast, By End-User, 2021 – 2032
9.3.6.8 Rest of Europe
9.3.6.8.1 Next Generation Biometrics Market Size & Forecast, By Type of Biometric Technology, 2021 – 2032
9.3.6.8.2 Next Generation Biometrics Market Size & Forecast, By Application, 2021 – 2032
9.3.6.8.3 Next Generation Biometrics Market Size & Forecast, By Deployment Model, 2021 – 2032
9.3.6.8.4 Next Generation Biometrics Market Size & Forecast, By End-User, 2021 – 2032
9.4 Asia-Pacific
9.4.1 Key Trends
9.4.2 Next Generation Biometrics Market Size & Forecast, By Type of Biometric Technology, 2021 – 2032
9.4.3 Next Generation Biometrics Market Size & Forecast, By Application, 2021 – 2032
9.4.4 Next Generation Biometrics Market Size & Forecast, By Deployment Model, 2021 – 2032
9.4.5 Next Generation Biometrics Market Size & Forecast, By End-User, 2021 – 2032
9.4.6 Next Generation Biometrics Market Size & Forecast, By Country, 2021 – 2032
9.4.6.1 China
9.4.6.1.1 Next Generation Biometrics Market Size & Forecast, By Type of Biometric Technology, 2021 – 2032
9.4.6.1.2 Next Generation Biometrics Market Size & Forecast, By Application, 2021 – 2032
9.4.6.1.3 Next Generation Biometrics Market Size & Forecast, By Deployment Model, 2021 – 2032
9.4.6.1.4 Next Generation Biometrics Market Size & Forecast, By End-User, 2021 – 2032
9.4.6.2 India
9.4.6.2.1 Next Generation Biometrics Market Size & Forecast, By Type of Biometric Technology, 2021 – 2032
9.4.6.2.2 Next Generation Biometrics Market Size & Forecast, By Application, 2021 – 2032
9.4.6.2.3 Next Generation Biometrics Market Size & Forecast, By Deployment Model, 2021 – 2032
9.4.6.2.4 Next Generation Biometrics Market Size & Forecast, By End-User, 2021 – 2032
9.4.6.3 Japan
9.4.6.3.1 Next Generation Biometrics Market Size & Forecast, By Type of Biometric Technology, 2021 – 2032
9.4.6.3.2 Next Generation Biometrics Market Size & Forecast, By Application, 2021 – 2032
9.4.6.3.3 Next Generation Biometrics Market Size & Forecast, By Deployment Model, 2021 – 2032
9.4.6.3.4 Next Generation Biometrics Market Size & Forecast, By End-User, 2021 – 2032
9.4.6.4 South Korea
9.4.6.4.1 Next Generation Biometrics Market Size & Forecast, By Type of Biometric Technology, 2021 – 2032
9.4.6.4.2 Next Generation Biometrics Market Size & Forecast, By Application, 2021 – 2032
9.4.6.4.3 Next Generation Biometrics Market Size & Forecast, By Deployment Model, 2021 – 2032
9.4.6.4.4 Next Generation Biometrics Market Size & Forecast, By End-User, 2021 – 2032
9.4.6.5 Australia
9.4.6.5.1 Next Generation Biometrics Market Size & Forecast, By Type of Biometric Technology, 2021 – 2032
9.4.6.5.2 Next Generation Biometrics Market Size & Forecast, By Application, 2021 – 2032
9.4.6.5.3 Next Generation Biometrics Market Size & Forecast, By Deployment Model, 2021 – 2032
9.4.6.5.4 Next Generation Biometrics Market Size & Forecast, By End-User, 2021 – 2032
9.4.6.6 ASEAN Countries
9.4.6.6.1 Next Generation Biometrics Market Size & Forecast, By Type of Biometric Technology, 2021 – 2032
9.4.6.6.2 Next Generation Biometrics Market Size & Forecast, By Application, 2021 – 2032
9.4.6.6.3 Next Generation Biometrics Market Size & Forecast, By Deployment Model, 2021 – 2032
9.4.6.6.4 Next Generation Biometrics Market Size & Forecast, By End-User, 2021 – 2032
9.4.6.7 Rest of Asia-Pacific
9.4.6.7.1 Next Generation Biometrics Market Size & Forecast, By Type of Biometric Technology, 2021 – 2032
9.4.6.7.2 Next Generation Biometrics Market Size & Forecast, By Application, 2021 – 2032
9.4.6.7.3 Next Generation Biometrics Market Size & Forecast, By Deployment Model, 2021 – 2032
9.4.6.7.4 Next Generation Biometrics Market Size & Forecast, By End-User, 2021 – 2032
9.5 Latin America
9.5.1 Key Trends
9.5.2 Next Generation Biometrics Market Size & Forecast, By Type of Biometric Technology, 2021 – 2032
9.5.3 Next Generation Biometrics Market Size & Forecast, By Application, 2021 – 2032
9.5.4 Next Generation Biometrics Market Size & Forecast, By Deployment Model, 2021 – 2032
9.5.5 Next Generation Biometrics Market Size & Forecast, By End-User, 2021 – 2032
9.5.6 Next Generation Biometrics Market Size & Forecast, By Country, 2021 – 2032
9.5.6.1 Brazil
9.5.6.1.1 Next Generation Biometrics Market Size & Forecast, By Type of Biometric Technology, 2021 – 2032
9.5.6.1.2 Next Generation Biometrics Market Size & Forecast, By Application, 2021 – 2032
9.5.6.1.3 Next Generation Biometrics Market Size & Forecast, By Deployment Model, 2021 – 2032
9.5.6.1.4 Next Generation Biometrics Market Size & Forecast, By End-User, 2021 – 2032
9.5.6.2 Argentina
9.5.6.2.1 Next Generation Biometrics Market Size & Forecast, By Type of Biometric Technology, 2021 – 2032
9.5.6.2.2 Next Generation Biometrics Market Size & Forecast, By Application, 2021 – 2032
9.5.6.2.3 Next Generation Biometrics Market Size & Forecast, By Deployment Model, 2021 – 2032
9.5.6.2.4 Next Generation Biometrics Market Size & Forecast, By End-User, 2021 – 2032
9.5.6.3 Mexico
9.5.6.3.1 Next Generation Biometrics Market Size & Forecast, By Type of Biometric Technology, 2021 – 2032
9.5.6.3.2 Next Generation Biometrics Market Size & Forecast, By Application, 2021 – 2032
9.5.6.3.3 Next Generation Biometrics Market Size & Forecast, By Deployment Model, 2021 – 2032
9.5.6.3.4 Next Generation Biometrics Market Size & Forecast, By End-User, 2021 – 2032
9.5.6.4 Colombia
9.5.6.4.1 Next Generation Biometrics Market Size & Forecast, By Type of Biometric Technology, 2021 – 2032
9.5.6.4.2 Next Generation Biometrics Market Size & Forecast, By Application, 2021 – 2032
9.5.6.4.3 Next Generation Biometrics Market Size & Forecast, By Deployment Model, 2021 – 2032
9.5.6.4.4 Next Generation Biometrics Market Size & Forecast, By End-User, 2021 – 2032
9.5.6.5 Rest of Latin America
9.5.6.5.1 Next Generation Biometrics Market Size & Forecast, By Type of Biometric Technology, 2021 – 2032
9.5.6.5.2 Next Generation Biometrics Market Size & Forecast, By Application, 2021 – 2032
9.5.6.5.3 Next Generation Biometrics Market Size & Forecast, By Deployment Model, 2021 – 2032
9.5.6.5.4 Next Generation Biometrics Market Size & Forecast, By End-User, 2021 – 2032
9.6 Middle East & Africa
9.6.1 Key Trends
9.6.2 Next Generation Biometrics Market Size & Forecast, By Type of Biometric Technology, 2021 – 2032
9.6.3 Next Generation Biometrics Market Size & Forecast, By Application, 2021 – 2032
9.6.4 Next Generation Biometrics Market Size & Forecast, By Deployment Model, 2021 – 2032
9.6.5 Next Generation Biometrics Market Size & Forecast, By End-User, 2021 – 2032
9.6.6 Next Generation Biometrics Market Size & Forecast, By Country, 2021 – 2032
9.6.6.1 UAE
9.6.6.1.1 Next Generation Biometrics Market Size & Forecast, By Type of Biometric Technology, 2021 – 2032
9.6.6.1.2 Next Generation Biometrics Market Size & Forecast, By Application, 2021 – 2032
9.6.6.1.3 Next Generation Biometrics Market Size & Forecast, By Deployment Model, 2021 – 2032
9.6.6.1.4 Next Generation Biometrics Market Size & Forecast, By End-User, 2021 – 2032
9.6.6.2 Saudi Arabia
9.6.6.2.1 Next Generation Biometrics Market Size & Forecast, By Type of Biometric Technology, 2021 – 2032
9.6.6.2.2 Next Generation Biometrics Market Size & Forecast, By Application, 2021 – 2032
9.6.6.2.3 Next Generation Biometrics Market Size & Forecast, By Deployment Model, 2021 – 2032
9.6.6.2.4 Next Generation Biometrics Market Size & Forecast, By End-User, 2021 – 2032
9.6.6.3 Qatar
9.6.6.3.1 Next Generation Biometrics Market Size & Forecast, By Type of Biometric Technology, 2021 – 2032
9.6.6.3.2 Next Generation Biometrics Market Size & Forecast, By Application, 2021 – 2032
9.6.6.3.3 Next Generation Biometrics Market Size & Forecast, By Deployment Model, 2021 – 2032
9.6.6.3.4 Next Generation Biometrics Market Size & Forecast, By End-User, 2021 – 2032
9.6.6.4 Egypt
9.6.6.4.1 Next Generation Biometrics Market Size & Forecast, By Type of Biometric Technology, 2021 – 2032
9.6.6.4.2 Next Generation Biometrics Market Size & Forecast, By Application, 2021 – 2032
9.6.6.4.3 Next Generation Biometrics Market Size & Forecast, By Deployment Model, 2021 – 2032
9.6.6.4.4 Next Generation Biometrics Market Size & Forecast, By End-User, 2021 – 2032
9.6.6.5 South Africa
9.6.6.5.1 Next Generation Biometrics Market Size & Forecast, By Type of Biometric Technology, 2021 – 2032
9.6.6.5.2 Next Generation Biometrics Market Size & Forecast, By Application, 2021 – 2032
9.6.6.5.3 Next Generation Biometrics Market Size & Forecast, By Deployment Model, 2021 – 2032
9.6.6.5.4 Next Generation Biometrics Market Size & Forecast, By End-User, 2021 – 2032
9.6.6.6 Rest of Middle East & Africa
9.6.6.6.1 Next Generation Biometrics Market Size & Forecast, By Type of Biometric Technology, 2021 – 2032
9.6.6.6.2 Next Generation Biometrics Market Size & Forecast, By Application, 2021 – 2032
9.6.6.6.3 Next Generation Biometrics Market Size & Forecast, By Deployment Model, 2021 – 2032
9.6.6.6.4 Next Generation Biometrics Market Size & Forecast, By End-User, 2021 – 2032
10. Competitive Landscape
10.1 Key Players' Positioning
10.2 Competitive Developments
10.2.1 Key Strategies Adopted (%), By Key Players, 2024
10.2.2 Year-Wise Strategies & Development, 2021 – 2025
10.2.3 Number Of Strategies Adopted By Key Players, 2024
10.3 Market Share Analysis, 2024
10.4 Product/Service & Application Benchmarking
10.4.1 Product/Service Specifications & Features By Key Players
10.4.2 Product/Service Heatmap By Key Players
10.4.3 Application Heatmap By Key Players
10.5 Industry Start-Up & Innovation Landscape
10.6 Key Company Profiles
10.6.1 Thales Group
10.6.1.1 Company Overview & Snapshot
10.6.1.2 Product/Service Portfolio
10.6.1.3 Key Company Financials
10.6.1.4 SWOT Analysis
10.6.2 IDEMIA
10.6.2.1 Company Overview & Snapshot
10.6.2.2 Product/Service Portfolio
10.6.2.3 Key Company Financials
10.6.2.4 SWOT Analysis
10.6.3 NEC Corporation
10.6.3.1 Company Overview & Snapshot
10.6.3.2 Product/Service Portfolio
10.6.3.3 Key Company Financials
10.6.3.4 SWOT Analysis
10.6.4 ASSA ABLOY
10.6.4.1 Company Overview & Snapshot
10.6.4.2 Product/Service Portfolio
10.6.4.3 Key Company Financials
10.6.4.4 SWOT Analysis
10.6.5 Fujitsu Limited
10.6.5.1 Company Overview & Snapshot
10.6.5.2 Product/Service Portfolio
10.6.5.3 Key Company Financials
10.6.5.4 SWOT Analysis
10.6.6 Suprema Inc.
10.6.6.1 Company Overview & Snapshot
10.6.6.2 Product/Service Portfolio
10.6.6.3 Key Company Financials
10.6.6.4 SWOT Analysis
10.6.7 Bio-Key International Inc.
10.6.7.1 Company Overview & Snapshot
10.6.7.2 Product/Service Portfolio
10.6.7.3 Key Company Financials
10.6.7.4 SWOT Analysis
10.6.8 Cognitec Systems GmbH
10.6.8.1 Company Overview & Snapshot
10.6.8.2 Product/Service Portfolio
10.6.8.3 Key Company Financials
10.6.8.4 SWOT Analysis
10.6.9 Aware Inc.
10.6.9.1 Company Overview & Snapshot
10.6.9.2 Product/Service Portfolio
10.6.9.3 Key Company Financials
10.6.9.4 SWOT Analysis
10.6.10 HID Global
10.6.10.1 Company Overview & Snapshot
10.6.10.2 Product/Service Portfolio
10.6.10.3 Key Company Financials
10.6.10.4 SWOT Analysis
10.6.11 Synaptics Incorporated
10.6.11.1 Company Overview & Snapshot
10.6.11.2 Product/Service Portfolio
10.6.11.3 Key Company Financials
10.6.11.4 SWOT Analysis
10.6.12 Precise Biometrics
10.6.12.1 Company Overview & Snapshot
10.6.12.2 Product/Service Portfolio
10.6.12.3 Key Company Financials
10.6.12.4 SWOT Analysis
10.6.13 Dermalog Identification Systems GmbH
10.6.13.1 Company Overview & Snapshot
10.6.13.2 Product/Service Portfolio
10.6.13.3 Key Company Financials
10.6.13.4 SWOT Analysis
10.6.14 Fingerprint Cards AB
10.6.14.1 Company Overview & Snapshot
10.6.14.2 Product/Service Portfolio
10.6.14.3 Key Company Financials
10.6.14.4 SWOT Analysis
10.6.15 ZKTeco Co. Ltd.
10.6.15.1 Company Overview & Snapshot
10.6.15.2 Product/Service Portfolio
10.6.15.3 Key Company Financials
10.6.15.4 SWOT Analysis
10.6.16 Gemalto N.V.
10.6.16.1 Company Overview & Snapshot
10.6.16.2 Product/Service Portfolio
10.6.16.3 Key Company Financials
10.6.16.4 SWOT Analysis
10.6.17 ImageWare Systems Inc.
10.6.17.1 Company Overview & Snapshot
10.6.17.2 Product/Service Portfolio
10.6.17.3 Key Company Financials
10.6.17.4 SWOT Analysis
10.6.18 IriTech Inc.
10.6.18.1 Company Overview & Snapshot
10.6.18.2 Product/Service Portfolio
10.6.18.3 Key Company Financials
10.6.18.4 SWOT Analysis
10.6.19 Daon Inc.
10.6.19.1 Company Overview & Snapshot
10.6.19.2 Product/Service Portfolio
10.6.19.3 Key Company Financials
10.6.19.4 SWOT Analysis
10.6.20 Secunet Security Networks AG
10.6.20.1 Company Overview & Snapshot
10.6.20.2 Product/Service Portfolio
10.6.20.3 Key Company Financials
10.6.20.4 SWOT Analysis
11. Analyst Recommendations
11.1 SNS Insider Opportunity Map
11.2 Industry Low-Hanging Fruit Assessment
11.3 Market Entry & Growth Strategy
11.4 Analyst Viewpoint & Suggestions On Market Growth
12. Assumptions
13. Disclaimer
14. Appendix
14.1 List Of Tables
14.2 List Of Figures
An accurate research report requires proper strategizing as well as implementation. There are multiple factors involved in the completion of good and accurate research report and selecting the best methodology to compete the research is the toughest part. Since the research reports we provide play a crucial role in any company’s decision-making process, therefore we at SNS Insider always believe that we should choose the best method which gives us results closer to reality. This allows us to reach at a stage wherein we can provide our clients best and accurate investment to output ratio.
Each report that we prepare takes a timeframe of 350-400 business hours for production. Starting from the selection of titles through a couple of in-depth brain storming session to the final QC process before uploading our titles on our website we dedicate around 350 working hours. The titles are selected based on their current market cap and the foreseen CAGR and growth.
The 5 steps process:
Step 1: Secondary Research:
Secondary Research or Desk Research is as the name suggests is a research process wherein, we collect data through the readily available information. In this process we use various paid and unpaid databases which our team has access to and gather data through the same. This includes examining of listed companies’ annual reports, Journals, SEC filling etc. Apart from this our team has access to various associations across the globe across different industries. Lastly, we have exchange relationships with various university as well as individual libraries.
Step 2: Primary Research
When we talk about primary research, it is a type of study in which the researchers collect relevant data samples directly, rather than relying on previously collected data. This type of research is focused on gaining content specific facts that can be sued to solve specific problems. Since the collected data is fresh and first hand therefore it makes the study more accurate and genuine.
We at SNS Insider have divided Primary Research into 2 parts.
Part 1 wherein we interview the KOLs of major players as well as the upcoming ones across various geographic regions. This allows us to have their view over the market scenario and acts as an important tool to come closer to the accurate market numbers. As many as 45 paid and unpaid primary interviews are taken from both the demand and supply side of the industry to make sure we land at an accurate judgement and analysis of the market.
This step involves the triangulation of data wherein our team analyses the interview transcripts, online survey responses and observation of on filed participants. The below mentioned chart should give a better understanding of the part 1 of the primary interview.
Part 2: In this part of primary research the data collected via secondary research and the part 1 of the primary research is validated with the interviews from individual consultants and subject matter experts.
Consultants are those set of people who have at least 12 years of experience and expertise within the industry whereas Subject Matter Experts are those with at least 15 years of experience behind their back within the same space. The data with the help of two main processes i.e., FGDs (Focused Group Discussions) and IDs (Individual Discussions). This gives us a 3rd party nonbiased primary view of the market scenario making it a more dependable one while collation of the data pointers.
Step 3: Data Bank Validation
Once all the information is collected via primary and secondary sources, we run that information for data validation. At our intelligence centre our research heads track a lot of information related to the market which includes the quarterly reports, the daily stock prices, and other relevant information. Our data bank server gets updated every fortnight and that is how the information which we collected using our primary and secondary information is revalidated in real time.
Step 4: QA/QC Process
After all the data collection and validation our team does a final level of quality check and quality assurance to get rid of any unwanted or undesired mistakes. This might include but not limited to getting rid of the any typos, duplication of numbers or missing of any important information. The people involved in this process include technical content writers, research heads and graphics people. Once this process is completed the title gets uploader on our platform for our clients to read it.
Step 5: Final QC/QA Process:
This is the last process and comes when the client has ordered the study. In this process a final QA/QC is done before the study is emailed to the client. Since we believe in giving our clients a good experience of our research studies, therefore, to make sure that we do not lack at our end in any way humanly possible we do a final round of quality check and then dispatch the study to the client.
Key Segments:
By Type of Biometric Technology
Fingerprint Recognition
Facial Recognition
Iris Recognition
Voice Recognition
Vein Recognition
Gait Recognition
By Application
Government and Public Sector
National ID Programs
Border Control
E-Governance Solutions
By Deployment Model
On-Premise
Hardware Solutions
Software Solutions
Cloud-Based
Hybrid Solutions
Fully Managed Services
By End-User
Telecommunications
Automotive
Education
Manufacturing
Defense
Request for Segment Customization as per your Business Requirement: Segment Customization Request
Regional Coverage:
North America
US
Canada
Europe
Germany
UK
France
Italy
Spain
Russia
Poland
Rest of Europe
Asia Pacific
China
India
Japan
South Korea
Australia
ASEAN Countries
Rest of Asia Pacific
Middle East & Africa
UAE
Saudi Arabia
Qatar
South Africa
Rest of Middle East & Africa
Latin America
Brazil
Argentina
Mexico
Colombia
Rest of Latin America
Request for Country Level Research Report: Country Level Customization Request
Available Customization
With the given market data, SNS Insider offers customization as per the company’s specific needs. The following customization options are available for the report:
Detailed Volume Analysis
Criss-Cross segment analysis (e.g. Product X Application)
Competitive Product Benchmarking
Geographic Analysis
Additional countries in any of the regions
Customized Data Representation
Detailed analysis and profiling of additional market players