Oilfield Scale Inhibitor Market Report Scope & Overview:
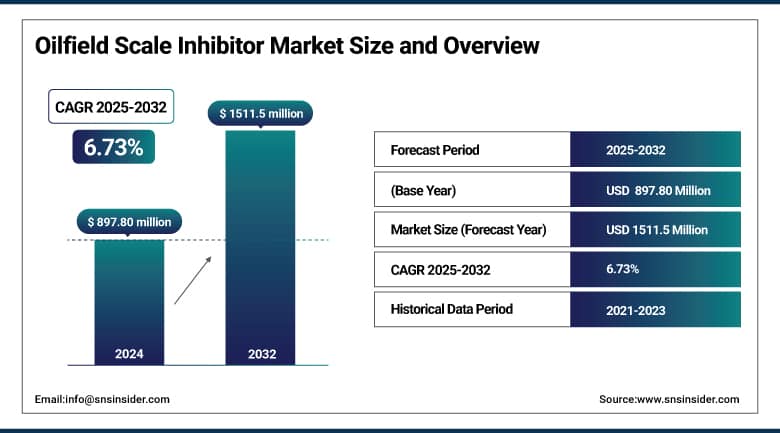
The Oilfield Scale Inhibitor Market size was USD 897.80 Million in 2024 and is expected to reach USD 1511.55 Million by 2032, growing at a CAGR of 6.73% over the forecast period of 2025-2032.
Oilfield scale inhibitor market analysis highlights that the surge in shale gas and tight oil production is significantly contributing to market expansion. Expanding shale gas and tight oil production, especially from North America, as the unconventional methods used to extract these resources are more complex and demand higher levels of planning and activity. Most shale and tight oil wells use horizontal drilling and hydraulic fracturing to contact large surface areas of formation water and other fluids injected into the well. This complexity increases the potential for scale calcium carbonate, barium sulfate, and other minerals that can block pipelines, decrease formation permeability, and decrease equipment efficiency. Frequent, accurate, and cost-effective application of scale inhibitors becomes necessary to maintain critical flow rates and protect high-value infrastructure, driving the oilfield scale inhibitor market growth.
To Get More Information On Oilfield Scale Inhibitor Market - Request Free Sample Report
According to the U.S. Energy Information Administration (EIA), 78% of total U.S. dry natural gas production (equivalent to 37.87 trillion cubic feet of dry gas) came from shale in 2023 (EIA, 2023). The resulting prevalence of shale gas is intimately linked to the intricate extraction methodologies (horizontal drilling, hydraulic fracturing) that exponentially enhance the likelihood of scale development, showing the necessity of high-frequency, technically advanced scale inhibition treatments.
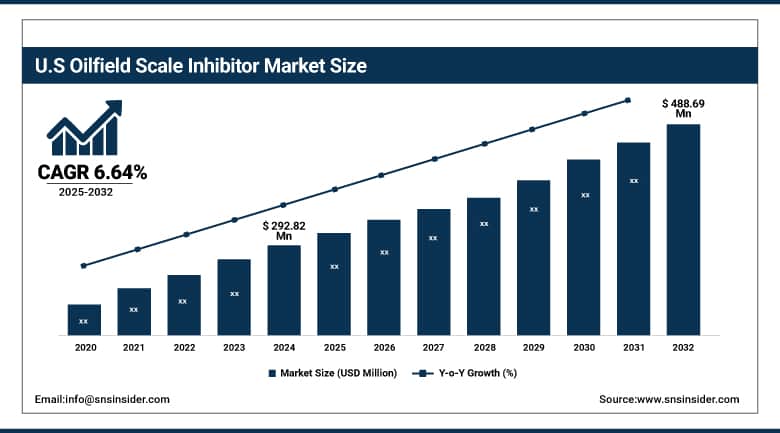
The U.S. Oilfield Scale Inhibitor Market size was USD 292.82 million in 2024 and is expected to reach USD 488.69 million by 2032, growing at a CAGR of 6.64% over the forecast period of 2025-2032. It is due to the U.S. having a mature oilfield services sector and readily available technology and investment for EOR and water management. Coupled with stringent regulatory requirements for equipment performance and environmental protection, these factors lead to stable demand for high-performance scale inhibitors, thereby making the U.S. the leading national market for such materials globally.
Market Dynamics:
Drivers
-
Increased Water Injection and Produced Water Reuse Drive the Market Growth.
The growing deployment of water injection and produced water reuse is among the important factors fueling the growth of the oilfield scale inhibitor market. In EOR and pressure maintenance schemes, water is routinely injected into reservoirs to ensure maximum hydrocarbon recovery. While produced water recycling is nothing new, pressure on the industry to reuse water because of expanding environmental regulations and rising cost-efficient goals has propelled oilfield operations into reusing produced water. Yet, both water injection and produced water reuse carry high contents of calcium, barium, and strontium into the production system. These minerals commonly react with sulfate or carbonate ions to create scale deposits that can clog pipelines, damage machinery, and decrease permeability in reservoirs.
Halliburton Labs has partnered with Espiku to pilot a modular water recycling system in the Permian Basin. Developed by the Australian-owned new-tech company, the proprietary process purifies produced water via a three-step non-fouling evaporation and condensation system.
Restrain
-
High Cost of Advanced Scale Inhibitor Chemicals May Hamper the Market Growth.
The high expense of advanced scale inhibitor chemicals is one of the main restraining factors expected to hamper the oilfield scale inhibitor market growth. With rising exploration and production complexity in deepwater, HPHT (high-pressure high-temperature) environments, the desire for highly specialized, fit-for-purpose products with increased strength in difficult service conditions has never been higher. These next-generation inhibitors, however, tend to be expensive owing to their complicated synthesis, regulatory requirements, and special handling. The use of these high-performing inhibitors may not fit into operating budgets for many oilfield operators, especially under cost-sensitive markets or low crude oil price periods.
Opportunities
-
Development of Nanotechnology-Based Scale Inhibitors Creates Opportunities In the Market.
A rise in the development of scale inhibitors based on nanotechnology holds a significant opportunity for growth in the global oilfield scale inhibitor market. Conventional scale inhibitors are often plagued with a lack of thermal stability, degradation by chemical interactions, or poor performance at the high-salinity or high-pressure conditions typical of deepwater and unconventional oilfields. Nanotechnology overcomes these limitations with the development of stable, high-surface area, and controlled release formulations. These unique nano-engineered inhibitors could be more efficient in targeting the inhibition of nucleation and growth of scale-forming minerals, such as calcium carbonate and barium sulfate. Also, their small diameter facilitates their distribution through complex well architectures, thus increasing treatment effectiveness while also minimizing the volume of total chemicals used, which drives the oilfield scale inhibitor market trends.
Segmentation Analysis:
By Type
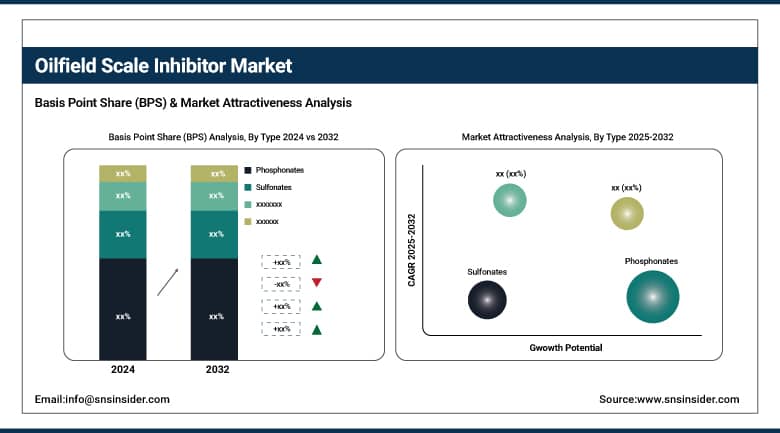
Phosphonates held the largest oilfield scale inhibitor market share, around 46%, in 2024. It is owing to their extremely effective and versatile ability to prevent precipitations of various scale-forming minerals, including calcium carbonate, calcium sulfate, and barium sulfate. These compounds act as chelators, which means they bind to metal ions to prevent precipitation and, consequently, scale formation. In addition, phosphonates feature good hydrolytic and thermal properties, which render them fit for use in deepwater, shale, and other complex oilfield applications where high-temperature and high-pressure conditions prevail.
Sulfonates held a significant oilfield scale inhibitor market share. owing to a high level of dispersing capability and effectiveness in controlling complex scale formations, particularly in a high-salinity and high-temperature environment. The inhibition of the agglomeration and deposition of scale-forming salts, including barium sulfate and strontium sulfate, is of great importance because the deposition of these salts is hard to control by conventional inhibitors. Not only do sulfonates have excellent compatibility with various oilfield fluids, such as brines and drilling muds, but they are also practical for both onshore and offshore applications. They show better performance longevity because of their high chemical stability in extreme reservoir environments and would require minimal, if any, chemical dosing and maintenance.
Regional Analysis:
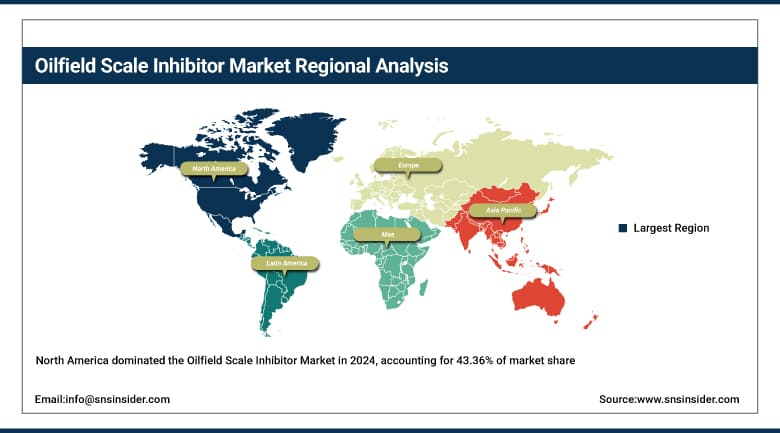
North America held the largest market share, around 43.36%, in 2024. It is owing to its having a relatively larger and well-established technological oil and gas market, especially in the United States. It encompasses extensive resources of natural gas and a number of the world's most productive shale plays, such as the Permian Basin, Eagle Ford, and Bakken, where hydraulic fracturing and horizontal drilling are common. These techniques increase the relatively high chance of scale formation, which in turn significantly increases the requirement for scale inhibitors. In addition, the large scale of North American onshore and offshore exploration and production (E&P) requires more frequent chemical treatment to keep well performance and equipment condition.
In March 2025, Jacam Catalyst expanded its operations from land-based production services to offshore production chemicals, introducing new product development at its Gardendale plant to support 14–15% of U.S. oil and gas production from offshore sources. This expansion builds on the company's existing solutions for treating inhibitors in produced water situations and adds to its use in more challenging injection settings.
Get Customized Report as Per Your Business Requirement - Enquiry Now
Asia Pacific oilfield scale inhibitors market held a significant market share and is the fastest-growing segment in the forecast period. It is due to the rapid development of the oil and gas exploration & production industry in the region, especially China, India, Indonesia, and Malaysia. With industrialization and urbanization bolstering the energy demand in the region, the onshore and offshore drilling projects are rising to cater to the demand. Most of these operations utilize EOR (enhanced oil recovery) and large-scale water injection processes that escalate scale risk, which is expected to increase demand for scale inhibitors. The region also benefits from cheap labor, promotions by the government to increase domestic crude production, and investments in energy infrastructure. At the same time, the growing focus on water reuse and tightening environmental regulations in almost every country across the Asia-Pacific also drives an increased rate of adoption of advanced scale control chemicals there, making it another key region for the global market growth.
Europe held a significant market share in the forecast period. It is due to the mature oil and gas industry, particularly in the countries of Norway, the UK, and Russia, is accounts for a large share of the oilfield scale inhibitor market. In the current climate of high commodity prices, scale inhibitor in oil and gas production in the North Sea, one of the world’s most mature offshore oilfields, is ongoing, but scale formation remains a significant challenge, at high temperature and in extremely harsh marine environments, which requires production on very large scales. This has created a demand for reliable, high-performance scale inhibitors that ensure continuous production and integrity of the equipment. Moreover, the stringent environmental regulations in Europe act as a driving factor for the adoption of eco-friendly and biodegradable chemical formulations, thereby promoting innovation and investments in advanced scale inhibition technologies.
Key Players:
BASF SE, Clariant AG, Dow Inc., Kemira Oyj, Solvay S.A., Halliburton Company, Schlumberger Limited, Baker Hughes Company, Ecolab Inc. (Nalco Champion), Akzo Nobel N.V.
Recent Development:
-
In 2025, BASF announced plans to further expand the production capacity for Basoflux paraffin and scale inhibitor at the Tarragona site. The move is to respond to increasing demand with more eco-friendly aqueous-based inhibitor solutions, with initial customer deliveries expected in early 2025.
-
In 2024, Halliburton released the SureDscale family of fast-acting, non-acid scale dissolvers. The portfolio provides targeted solutions for each scale type, including calcite, gypsum, barite, and strontium sulfate, so operators will reduce downtime associated with clean-up operations.
| Report Attributes | Details |
|---|---|
| Market Size in 2024 | USD 897.80 Million |
| Market Size by 2032 | USD 1511.55 Million |
| CAGR | CAGR of6.73% From 2025 to 2032 |
| Base Year | 2024 |
| Forecast Period | 2025-2032 |
| Historical Data | 2021-2023 |
| Report Scope & Coverage | Market Size, Segments Analysis, Competitive Landscape, Regional Analysis, DROC & SWOT Analysis, Forecast Outlook |
| Key Segments | •By Type (Phosphonates, Carboxylate/Acrylate, Sulfonates, Others) |
| Regional Analysis/Coverage | North America (US, Canada, Mexico), Europe (Germany, France, UK, Italy, Spain, Poland, Turkey, Rest of Europe), Asia Pacific (China, India, Japan, South Korea, Singapore, Australia, Rest of Asia Pacific), Middle East & Africa (UAE, Saudi Arabia, Qatar, South Africa, Rest of Middle East & Africa), Latin America (Brazil, Argentina, Rest of Latin America) |
| Company Profiles | BASF SE, Clariant AG, Dow Inc., Kemira Oyj, Solvay S.A., Halliburton Company, Schlumberger Limited, Baker Hughes Company, Ecolab Inc. (Nalco Champion), Akzo Nobel N.V. |
Frequently Asked Questions
Ans: North America led the Oilfield Scale Inhibitor Market in the region with the highest revenue share in 2024.
Ans: Increased water injection and produced water reuse drive the market growth.
Ans: Phosphonates will grow rapidly in the Oilfield Scale Inhibitor Market from 2025 to 2032.
Ans: The expected CAGR of the global Oilfield Scale Inhibitor Market during the forecast period is 6.73%
Ans: The Oilfield Scale Inhibitor Market was valued at USD 897.80 million in 2024.
Get in Touch
