Green Ammonia Market Report Scope & Overview:
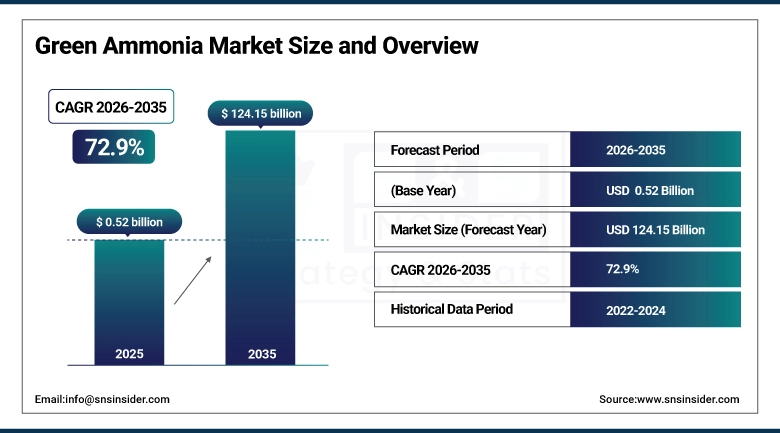
The Green Ammonia Market size was valued at USD 0.52 billion in 2025 and is expected to reach USD 124.15 billion by 2035, growing at a CAGR of 72.9% over the forecast period of 2026–2035.
The global green ammonia market trend reflects a structural shift in ammonia production from fossil-fuel-based steam methane reforming toward water electrolysis powered by renewable energy. The growth of the market is driven by tightening carbon regulations, national net-zero commitments, and growing demand for green fertilizers and clean maritime fuel. This trend is also driven by the accelerating commercialization of alkaline water electrolysis and proton exchange membrane technologies alongside falling renewable electricity costs, as governments and industrial buyers across agriculture, energy, and chemical sectors increase long-term offtake commitments for green ammonia, generating steady expansion in both large-scale export-oriented projects in the Middle East and distributed production facilities across Europe, Asia Pacific, and North America.
For instance, in June 2024, Yara International officially inaugurated its 24 MW renewable hydrogen plant at Herøya, Norway, built by Linde Engineering using ITM Power’s proton exchange membrane technology, making it the largest green hydrogen electrolysis facility in commercial operation in Europe at the time of launch, with annual production capacity of 20,500 metric tons of green ammonia.
Green Ammonia Market Size and Forecast:
-
Market Size in 2025: USD 0.52 billion
-
Market Size by 2035: USD 124.15 billion
-
CAGR: 72.9% from 2026 to 2035
-
Base Year: 2025
-
Forecast Period: 2026–2035
-
Historical Data: 2022–2024
To Get more information on Green Ammonia Market - Request Free Sample Report
Green Ammonia Market Trends
-
Alkaline water electrolysis accounts for more than 48% of installed green ammonia production capacity in 2025 due to its lower capital cost and proven reliability at scale, while proton exchange membrane systems are gaining share in projects requiring flexible load-following to match intermittent solar and wind inputs.
-
Electrolyzer costs have declined approximately 30% over the past three years driven by manufacturing scale-up in China and Europe, improving the cost competitiveness of green ammonia relative to conventional gray ammonia, particularly in regions with low-cost renewable electricity.
-
Solid oxide electrolysis technology is gaining attention in industrial integration use cases due to its high electrical efficiency and compatibility with waste heat recovery from ammonia synthesis, though supply chain constraints are limiting commercial deployment relative to alkaline and PEM systems.
-
The International Maritime Organization’s 2023 GHG Strategy, which sets interim emissions reduction targets of at least 20% by 2030 and 70% by 2040 versus 2008 levels, is progressively increasing shipping industry demand for ammonia as a zero-carbon bunker fuel alternative.
-
Vertically integrated project models combining renewable generation, electrolysis, ammonia synthesis, storage, and export terminals are becoming the preferred development structure, as leading developers seek to reduce exposure to power price volatility and simplify project financing arrangements.
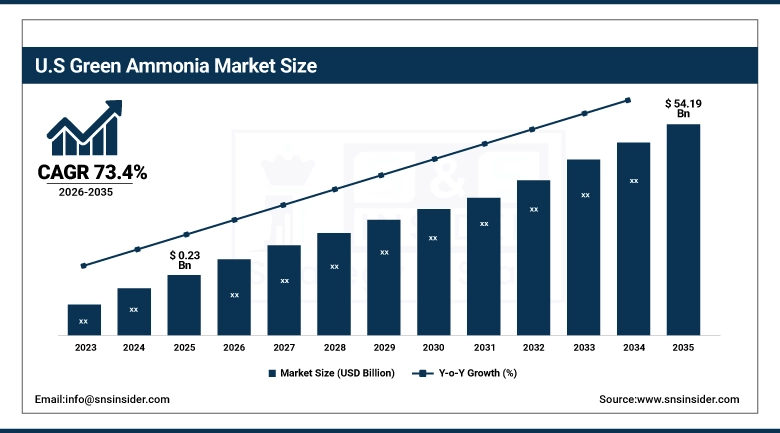
The U.S. Green Ammonia Market is estimated at USD 0.23 billion in 2025 and is expected to reach USD 54.19 billion by 2035, growing at a CAGR of 73.4% from 2026–2035.
The United States is positioned as both a significant production hub and a potential exporter of green ammonia, supported by the Inflation Reduction Act’s clean hydrogen production tax credit of up to USD 3 per kilogram, regional hydrogen hub designations that include ammonia as an end use, and abundant wind and solar resources in the Gulf Coast, Midwest, and Southwest. CF Industries’ Donaldsonville complex in Louisiana and OCI’s Beaumont facility in Texas represent the initial wave of U.S. large-scale low-carbon ammonia capacity targeting international markets, with green ammonia production integrated into planned electrolyzer expansions for green hydrogen infrastructure across the country.
Green Ammonia Market Growth Drivers:
-
Government Decarbonization Mandates and Renewable Energy Cost Reductions are Driving the Green Ammonia Market Growth
Government decarbonization mandates and renewable energy cost reductions take center stage as growth drivers for the green ammonia market share, as national hydrogen strategies across the EU, Japan, South Korea, Australia, and India are providing policy certainty that enables long-term project financing for green ammonia facilities that require 15–20-year offtake agreements to reach final investment decision. The EU’s mandate under REPowerEU to produce 10 million tonnes of domestic renewable hydrogen annually by 2035, combined with the CBAM carbon border adjustment mechanism coming into full effect in 2026, is creating compliance-driven demand for green ammonia imports from low-cost production zones in the Middle East, North Africa, and Australia. Simultaneously, renewable electricity costs for dedicated solar and wind projects in MENA and Australia have fallen below USD 30 per megawatt-hour in several locations, approaching the threshold at which green ammonia can compete with gray ammonia on a delivered-cost basis without subsidy, broadening the addressable market beyond policy-supported volumes and adding commercially driven project development to the overall market share globally.
For instance, in August 2024, AM Green signed India’s largest electrolyzer order to date with John Cockerill Hydrogen for its one million tonnes per year green ammonia plant in Kakinada, Andhra Pradesh, using 1.3 GW of pressurized alkaline technology electrolyzers powered by 24/7 renewable energy, with phase one production targeted for the second half of 2026.
Green Ammonia Market Restraints:
-
High Production Costs and Electrolyzer Capital Intensity are Hampering the Green Ammonia Market Growth
High production costs and electrolyzer capital intensity are the primary constraints on green ammonia market growth, as green ammonia remains significantly more expensive to produce than conventional gray ammonia in most markets, with the cost differential largely determined by the price of renewable electricity and the capital cost of electrolysis equipment. The cost of green hydrogen via alkaline electrolysis in Germany backed by renewable power purchase agreements was assessed at approximately EUR 8.25 per kilogram in mid-2024, and the subsequent compression, nitrogen separation, and Haber-Bosch synthesis steps add further capital and operating costs that make green ammonia uneconomical without policy support in the majority of markets. In India, policy studies show that large numbers of planned projects are delayed due to challenges in securing affordable renewable power at the prices required for commercial viability, illustrating how the economics of green ammonia remain dependent on grid conditions and subsidy frameworks that vary substantially across geographies and are not uniformly available to developers.
Green Ammonia Market Opportunities:
-
Maritime Fuel Adoption and Long-Term Export Offtake Agreements Drive Future Growth Opportunities for the Green Ammonia Market
The opportunity in maritime fuel adoption and long-term export offtake agreements for the green ammonia market lies in the convergence of IMO emission regulations, Japanese and South Korean import mandates, and the development of ammonia-ready vessel infrastructure that is creating a commercially viable demand anchor for large-scale green ammonia production projects. The IMO’s 2023 GHG Strategy interim targets require shipping operators to progressively reduce emissions, and ammonia’s zero-carbon combustion and compatibility with existing port infrastructure make it one of the most technically feasible scalable maritime fuels for vessels that cannot be economically electrified. Japan’s METI hydrogen strategy sets explicit delivered-cost targets for ammonia imports with government contracts for difference introduced in 2025 to underwrite the price gap against conventional fuel, providing the long-term revenue visibility needed to support multi-billion-dollar green ammonia production investments in Australia, the Middle East, and Southeast Asia that expand addressable market volumes throughout the forecast period.
For instance, in January 2025, Sungrow Hydrogen signed an agreement to supply water electrolysis equipment for ACME’s 320 MW green ammonia project in Oman, with deliveries scheduled for completion in 2025 and initial production of 300 tonnes of green ammonia per day targeted for 2026, demonstrating the acceleration of large-scale Middle East green ammonia export projects toward commercial commissioning.
Green Ammonia Market Segment Analysis
-
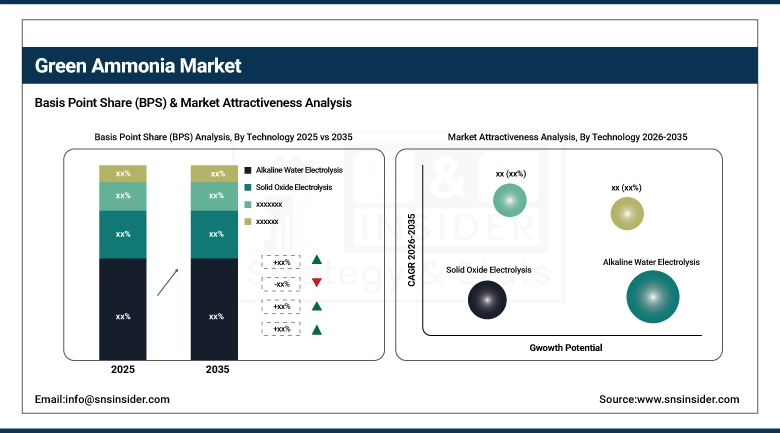
By technology, alkaline water electrolysis held the largest share of approximately 48.56% in 2025, and the solid oxide electrolysis segment is expected to register the highest growth with a CAGR of 31.7%.
-
By capacity, large-scale projects dominated the market with approximately 55.40% share in 2025, while the medium-scale segment is expected to register the highest growth with a CAGR of 74.2%.
-
By application, the fertilizer segment accounted for the leading share of nearly 46.00% in 2025, and the transportation segment is expected to register the highest growth with a CAGR of 78.5%.
-
By end-use industry, agriculture held the dominant share of approximately 44.30% in 2025, and the energy segment is expected to register the highest growth with a CAGR of 80.1%.
By Technology, Alkaline Water Electrolysis Leads the Market, While Solid Oxide Electrolysis Registers Fastest Growth
The alkaline water electrolysis segment accounted for the largest revenue share of approximately 48.56% in 2025, owing to its commercial maturity, lower capital cost relative to PEM systems, and compatibility with the steady-state, baseload renewable power profiles that characterize large-scale solar and wind projects in the Middle East and Australia where the majority of first-generation green ammonia export facilities are being developed. In comparison, the solid oxide electrolysis segment is projected to achieve the highest CAGR of approximately 31.7% over the 2026–2035 period, driven by its substantially higher electrical efficiency compared to conventional electrolyzers, its ability to operate in co-electrolysis mode, and its compatibility with waste heat integration from the exothermic Haber-Bosch ammonia synthesis loop that improves overall system efficiency by 20–30%.
By Capacity, Large-Scale Dominates, while Medium-Scale Registers Fastest Growth
By 2025, the large-scale segment contributed the dominant revenue share of 55.40%, driven by the project economics of green ammonia production that strongly favor scale, as larger facilities can achieve lower levelized costs of ammonia through spreading fixed electrolyzer and synthesis plant costs over greater production volumes and securing more competitive renewable power purchase agreements. The medium-scale segment is projected to grow at the highest CAGR of approximately 74.2% between 2026 and 2035, as technology maturation, modular electrolyzer packages, and government support programs for domestic green fertilizer production in Europe, North America, and South Asia are enabling commercially viable mid-sized facilities of 50–500 tonnes per day capacity that serve regional agricultural customers without requiring long-distance export logistics.
By Application, Fertilizer Segment Dominates, while Transportation Segment Shows Rapid Growth
By 2025, the fertilizer segment contributed the largest revenue share of 46.00%, as agricultural ammonia demand accounts for approximately 80% of global conventional ammonia consumption, providing an established and large-volume end market for green ammonia substitution that fertilizer producers including Yara International, CF Industries, and Fertiberia are actively targeting through electrolyzer integration at existing ammonia plants. The transportation segment is projected to grow at the highest CAGR of approximately 78.5% between 2026 and 2035, driven by increasing adoption of ammonia as a maritime bunker fuel following the IMO’s 2023 GHG Strategy, the commissioning of the first ammonia-fueled vessels, and the development of ammonia bunkering terminal infrastructure, as demonstrated by Yara Clean Ammonia and Azane receiving safety permits to build the world’s first low-emission ammonia bunkering terminal in March 2024.
By End-Use Industry, Agriculture Leads, and Energy Segment Registers Fastest Growth
The agriculture segment accounted for the largest share of the green ammonia market with approximately 44.30% in 2025, reflecting the fertilizer sector’s role as the primary end market for ammonia globally and the growing regulatory and consumer pressure on food producers to reduce the carbon intensity of crop nutrition inputs. The energy segment is projected to register the fastest growth with a CAGR of approximately 80.1% throughout the 2026–2035 forecast period, as Japan’s METI-backed ammonia co-firing program scales from demonstration to commercial deployment across the country’s coal-fired power fleet, supported by government contracts for difference introduced in 2025 that underwrite the cost of imported green ammonia, and as power generation utilities in South Korea and Germany pursue ammonia co-firing as a near-term decarbonization strategy compatible with existing thermal power infrastructure.
Green Ammonia Market Regional Highlights:
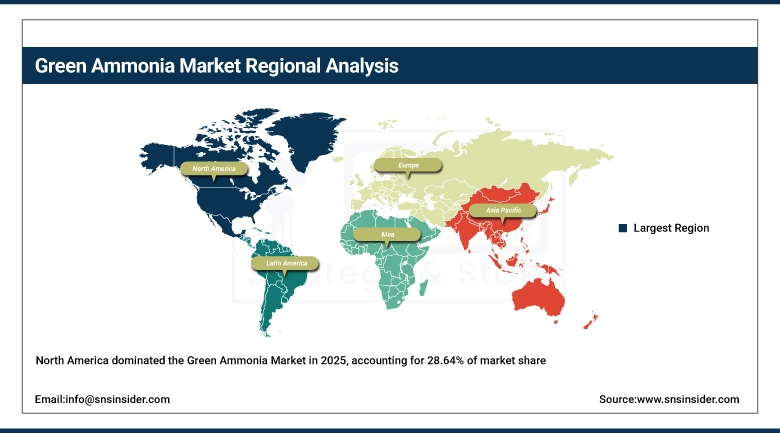
North America Green Ammonia Market Insights:
North America held a revenue share of approximately 28.64% in the green ammonia market in 2025, supported by the Inflation Reduction Act’s clean hydrogen production tax credit of up to USD 3 per kilogram that provides a direct cost subsidy for electrolytic green ammonia production, seven federally designated regional hydrogen hub awards that include ammonia in their production and end-use scope, and an established nitrogen fertilizer industry with existing ammonia infrastructure at facilities operated by CF Industries, Nutrien, and LSB Industries that can be retrofitted or expanded with electrolyzer capacity. EverWind Fuels in Nova Scotia, Canada, is advancing a major green ammonia export project targeting European and Asian markets using wind-powered electrolysis, while OCI’s Beaumont facility in Texas is producing 1.1 million tonnes per year of low-carbon ammonia from 2025 with carbon capture integration planned for 2026, establishing the foundation for the region’s transition toward full green ammonia production capacity.
Get Customized Report as per Your Business Requirement - Enquiry Now
Asia Pacific Green Ammonia Market Insights:
Asia Pacific is the fastest-growing region in the green ammonia market with a CAGR of approximately 80%, driven by Japan’s and South Korea’s state-backed import mandates for green ammonia for power generation co-firing, India’s National Green Hydrogen Mission targeting five million tonnes of green hydrogen production annually by 2035 with green ammonia as a key export product, and China’s concentrated domestic electrolyzer manufacturing base that accounts for the majority of global alkaline electrolyzer production capacity. Japan provides the clearest demand signal in the region, with METI’s hydrogen strategy embedding multi-million-tonne ammonia import targets into long-term energy policy and utility co-firing trials at JERA’s Hekinan station having already validated 20% ammonia heat input at commercial scale in 2024. Australia is emerging as the primary production hub serving Northeast Asian import demand, with multiple large-scale solar and wind-powered green ammonia projects in the Pilbara and other renewable-rich zones advancing through feasibility and final investment decision stages, while Yara Clean Ammonia’s ammonia bunkering pilot in the Pilbara in June 2025 illustrated the region’s growing role in the maritime fuel supply chain.
Europe Green Ammonia Market Insights:
The green ammonia market in Europe is the second-largest regional market, projected to grow from USD 123.6 million in 2025 to USD 24.9 billion by 2035 at a CAGR of 69.1%, driven by the EU Green Deal, REPowerEU renewable hydrogen targets, the Carbon Border Adjustment Mechanism coming into full effect in 2026, and national hydrogen strategies in Germany, Spain, the Netherlands, Denmark, and the UK that are providing regulatory and financial support for domestic green ammonia production and import terminal development. Germany leads European market activity with a 22% national share, with BASF announcing its readiness to produce renewable ammonia at its Ludwigshafen site in March 2025 as the first company in Central Europe to offer ISCC+ certified low-carbon ammonia at commercial scale. Spain’s Iberdrola–Fertiberia Puertollano project and Denmark’s Skovgaard Energy–Topsoe–Vestas dynamic green ammonia plant at Ramme represent distinct models of grid-connected and wind-integrated electrolyzer technology deployment that are informing project design across the broader European market.
Latin America (LATAM) and Middle East & Africa (MEA) Green Ammonia Market Insights:
In Latin America, and Middle East & Africa, the combination of vast renewable energy resources, low-cost solar irradiance, existing port infrastructure, and sovereign investment programs is positioning MENA as the dominant green ammonia export region globally, with Saudi Arabia’s NEOM project targeting 1.2 million tonnes per year of green ammonia production from 2026 using 4 GW of dedicated renewable capacity and Oman’s Hive Energy and Linde project targeting 800,000–900,000 tonnes per year at full operation, which together represent some of the largest planned green ammonia facilities in the world. In May 2025, UEG signed a memorandum of understanding with Alexandria Fertilizers Company in Egypt to collaborate on converting green hydrogen into green ammonia for domestic fertilizer production, illustrating how MEA green ammonia investment is also serving regional agricultural demand in addition to export markets. In Latin America, Unigel in Brazil’s Bahia state is advancing toward approximately 240,000 tonnes per year of green ammonia capacity by 2025, driven by domestic fertilizer demand, Brazil’s ethanol-linked energy transition policy framework, and the country’s competitive renewable electricity costs in its northeast wind corridor.
Green Ammonia Market Competitive Landscape:
Yara International ASA (est. 1905) is the world’s largest nitrogen fertilizer company with revenues of USD 13.9 billion in 2024 and operations in more than 60 countries, and is the most active incumbent fertilizer producer in green ammonia commercialization through its Yara Clean Ammonia subsidiary. The company operates the largest ammonia distribution network globally and is leveraging it to develop supply chains for green and low-carbon ammonia across fertilizer, shipping fuel, and energy carrier markets.
-
In June 2024, Yara officially opened its 24 MW renewable hydrogen plant at Herøya, Norway, built by Linde Engineering using ITM Power PEM electrolyzers, producing 20,500 metric tons of green ammonia annually to supply low-carbon fertilizers under the Yara Climate Choice brand and cutting 41,000 tonnes of CO₂ emissions per year.
Siemens Energy AG (est. 2020) is a global energy technology company operating across power generation, transmission, and industrial decarbonization, and is one of the leading suppliers of electrolysis and ammonia synthesis technology for green ammonia projects. The company provides both PEM electrolyzers through its Silyzer product line and gas turbine infrastructure capable of operating on ammonia-hydrogen blends, positioning it across both the production and end-use sides of the green ammonia value chain.
-
In 2024, Siemens Energy continued expanding its electrolyzer manufacturing capacity in Berlin as part of a multi-year scaling program targeting 3 GW of annual PEM electrolyzer production, supporting growing green ammonia project pipelines in Europe, the Middle East, and North America that have specified Silyzer systems in their electrolysis plant designs.
CF Industries Holdings, Inc. (est. 1946) is the largest nitrogen fertilizer manufacturer in North America, operating nine production complexes in the United States, Canada, and the United Kingdom with total ammonia capacity exceeding eight million tonnes per year. The company is pursuing green ammonia through clean hydrogen integration at its existing facilities, and its Donaldsonville, Louisiana complex is one of the largest single ammonia production sites in the world, providing the infrastructure base for large-scale electrolyzer addition.
-
In 2025, CF Industries advanced its green and blue ammonia production strategy at Donaldsonville as part of its long-term decarbonization roadmap, with electrolyzer capacity additions under evaluation to produce green ammonia for domestic and export markets in line with IRA clean hydrogen production tax credit economics.
Green Ammonia Market Key Players:
-
Yara International ASA
-
Siemens Energy AG
-
CF Industries Holdings, Inc.
-
ThyssenKrupp AG (Uhde)
-
Nel ASA
-
ITM Power PLC
-
ACME Group
-
AM Green Ammonia (Greenko ZeroC)
-
BASF SE
-
Haldor Topsoe A/S (Topsoe)
-
ENGIE SA
-
Ørsted A/S
-
Fertiberia S.A.
-
Nutrien Ltd.
-
EverWind Fuels
-
Scatec ASA
-
Iberdrola S.A.
-
John Cockerill Hydrogen
-
Linde plc
-
ACWA Power
| Report Attributes | Details |
|---|---|
| Market Size in 2025 | USD 0.52 Billion |
| Market Size by 2035 | USD 124.15 Billion |
| CAGR | CAGR of 72.9% From 2026 to 2035 |
| Base Year | 2025 |
| Forecast Period | 2026-2035 |
| Historical Data | 2022-2024 |
| Report Scope & Coverage | Market Size, Segments Analysis, Competitive Landscape, Regional Analysis, DROC & SWOT Analysis, Forecast Outlook |
| Key Segments | •By Technology (Proton Exchange Membrane, Solid Oxide Electrolysis, Alkaline Water Electrolysis) •By Capacity (Small scale, Medium Scale, Large Scale) •By Application (Power Generation, Fertilizer, Refrigeration, Transportation, Others) •By End-Use Industry (Agriculture, Energy, Automotive, Chemical, Others) |
| Regional Analysis/Coverage | North America (US, Canada), Europe (Germany, UK, France, Italy, Spain, Russia, Poland, Rest of Europe), Asia Pacific (China, India, Japan, South Korea, Australia, ASEAN Countries, Rest of Asia Pacific), Middle East & Africa (UAE, Saudi Arabia, Qatar, South Africa, Rest of Middle East & Africa), Latin America (Brazil, Argentina, Mexico, Colombia, Rest of Latin America). |
| Company Profiles |
Yara International ASA, Siemens Energy AG, CF Industries Holdings, Inc., ThyssenKrupp AG (Uhde), Nel ASA, ITM Power PLC, ACME Group, AM Green Ammonia (Greenko ZeroC), BASF SE, Haldor Topsoe A/S (Topsoe), ENGIE SA, Ørsted A/S, Fertiberia S.A., Nutrien Ltd., EverWind Fuels, Scatec ASA, Iberdrola S.A., John Cockerill Hydrogen, Linde plc, ACWA Power, and Others. |
Get in Touch
