The on-board Connectivity Market Report Scope & Overview:
To Get More Information on On-board Connectivity Market - Request Sample Report
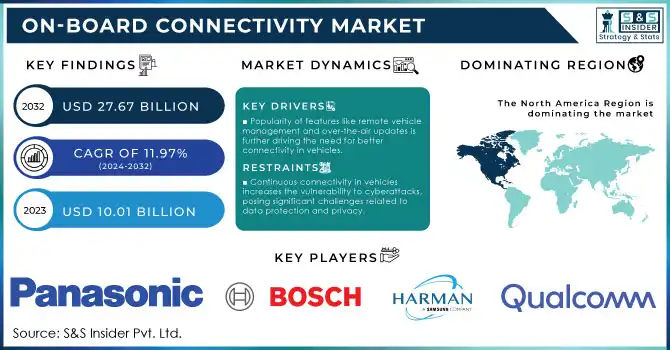
On-board Connectivity Market was valued at USD 10.01 billion in 2023 and is expected to reach USD 27.67 Billion by 2032, growing at a CAGR of 11.97% from 2024-2032.
The On-board Connectivity Market is booming as demand for integration of seamless connectivity in the transportation system particularly in vehicles, would boost the on-board connectivity market. With the advancement of in-car and in-vehicle technologies like in-car Wi-Fi, Bluetooth, satellite communications and vehicle-to-everything (V2X) communications, drivers, and passengers can now utilize real-time data for entertainment, navigation and safety features. One of the main reasons behind this is the increased adoption of Internet of Things (IoT) based technologies in vehicles to create more intelligent and connected transportation systems. Increasing electric and self-driving vehicles also increase the need for reliable, high-speed connectivity for constant navigation, diagnostics, and safety data exchange between vehicles and infrastructure. In the existing century, advent of 5G technology is undoubtedly a game changer for on-board connectivity market. 5G provides high-speed communication as well as lower latency influencing vehicle to infrastructure communication, improving driver assistance systems, allows remote diagnostics, and enables real-time vehicle to vehicle (V2V) communication. Connected car applications, related to remote vehicle management, updates, etc. are becoming more and more commonplace; similarly, market growth is being observed. Particularly in March 2024, the segments grew rapidly when a global automotive manufacture partnered with a leading connectivity provider to launch various in-vehicle services based on high-speed internet and AI powered system. This offer concentrates on smarter navigation and tailored experiences, and mirrors an increasing consumer appetite for next-gen in-car connectivity that delivers seamless integration with a mobile network.
In addition, worldwide regulations are encouraging the use of connectivity in the automotive segment, especially in terms of safety features, such as emergency braking and collision avoidance systems that rely on real-time data exchange. This, in conjunction to the technological development, is partly responsible for the rapid growth of this market segment. The on-board connectivity market is rapidly accelerating due to new technology innovation, the demand for connected vehicle functionality and the nature of transportation changing altogether.
Market Dynamics
Drivers
-
Popularity of features like remote vehicle management and over-the-air updates is further driving the need for better connectivity in vehicles.
-
The adoption of Internet of Things (IoT) technologies is making transportation networks smarter and more interconnected, enhancing connectivity features.
-
The need for continuous connectivity in vehicles to access real-time data, navigation, and entertainment is growing rapidly.
Technological advancements combined with higher consumer expectations are fueling a rapid growth in the demand for constant connectivity in vehicles. As the old way of in-car experience wearing off, new vehicles are becoming more digitally integrated, increasing the demand for easy-to-use connectivity to be able to utilize live traffic data, stream media and interact with real-time navigation systems. Consumers have come to expect that in-car experience mirror the digital experience that they have in their homes and offices, enabling them to remain plugged in to social media, apps, and work-related communication while on the move. Also, the increase in connected car applications such as remote vehicle management and over-the-air (OTA) updates is another contributing factor to this demand. Such services demand seamless, high-bandwidth data streamed to and from the vehicle, once more driving the requirement for high-tech in-vehicle connectivity. With more advanced driver-assistance systems (ADAS), like collision warnings and lane departure notifications that require real-time data through vehicle-to-vehicle (V2V) and vehicle-to-infrastructure (V2I) communication, manufacturers realize the need for connectivity and are building this into cars more than ever.
The growing demand for solutions that ensure continuous connectivity in vehicles has been significantly driven by the widespread adoption of Internet of Things (IoT) technologies. IoT enabled sensors, cameras, and smart devices fitted into the vehicles produce petabytes of data that needs to be continuously transferred and processed to perform the best. In addition, the development of 5G networks will enable real-time high-speed and low-latency communication between vehicles and their environment, because such exchange will be necessary for the operation of autonomous vehicles. Connectivity Needs — Movement towards autonomous vehicles, which depend on instant data exchange for safe navigation its driving the demand for robust and consistent connectivity.
Growing demand for vehicles with consistent connectivity are being driven by changes in vehicle technologies, growing consumer expectations for integrated digital experiences, and the rise of connected and autonomous vehicles. All these aspects are contributing to the robust growth of on-board connectivity market.
Restraints
-
Continuous connectivity in vehicles increases the vulnerability to cyberattacks, posing significant challenges related to data protection and privacy.
-
Inconsistent regulations and varying legal requirements across regions can hinder the seamless deployment of on-board connectivity solutions globally.
-
Integrating advanced connectivity solutions into existing vehicle platforms, especially older models, can be technically complex and costly for automakers.
The on-board connectivity market has significant challenges for automakers, adding advanced connectivity solutions to existing vehicle platforms, in particular older ones. This is mostly due to some older vehicles together with their models missing the required hardware, including sensors, processors, and connectivity modules to enable advanced technologies available in modern cars; e.g., car Wi-Fi, 5G connectivity, or vehicle-to-everything (V2X) communication. Retrofitting these vehicles for such sophisticated systems is capital-intensive and complicated as they require significant upgrades to a vehicle’s electrical and communications infrastructure to accommodate increased data loads and power needs.
Engineering embedded systems on legacy machines is a technically arduous and expensive processing, which requires specialist components, high-end technologies, and skilled labour. Upgrading old vehicles may be prohibitively expensive, particularly in markets where consumers are less likely to pay for upgrades. Also, older models often lack either software or hardware architecture to support new connectivity standards, creating compatibility challenges. These integration complexities can slow the deployment of connected vehicle features, especially in the used car space where a high mass of vehicles would require updates. A range of these technical and financial issues acts as a barrier to further penetration of a more advanced level of on-board connectivity solutions, especially between different classes of vehicles.
Segmentation Analysis
By Type
The solution segment dominated the market and accounted for the largest revenue share in 2023. Due to in-car Wi-Fi, 5G connectivity, and vehicle-to-everything (V2X) communication systems. These enable seamless connectivity among vehicles and within a vehicle for navigation, entertainment and safety, added the release. Additionally, the solution segment will continue to lead due to the increasing adoption of Internet of Things (IoT) devices in vehicles, as well as the rising need for advanced driver assistance systems (ADAS). The steady growth is also being driven by the strong demand from 5G, smart infrastructure, and connected car applications. With consumer expectations of a completely connected driving experience continuing to increase, there will be a continued market for solutions that provide high-bandwidth, low-latency connectivity.
The service segment is expected to register highest CAGR during the forecast period. The rise comes because of the increasing requirements of managed services, maintenance, cloud-based services, and over-the-air (OTA) updates that are fundamental to the functioning of connected vehicles. The more automobiles rely on software and digital solutions, the more they will require upgrades and real-time service support on the field. This expansion is further accelerated by services including remote diagnostics, data analytics and personalized experiences. In the next few years, the service allocated to optimizing in-vehicle experience is expected to grow significantly due to the increasing adoption of autonomous vehicles and the rising in-car connectivity complexities.
By Industry
The transportation segment dominated the on-board connectivity market both in terms of revenue as well as volume in 2023, due to limited supply of and rising end-use industries coupled with increasing demand for advanced systems integrated system that support safety and navigation and vehicle infotainment systems. This change is driven by the scale of connected cars, EVs and self-driving cars. Integration of Connectivity Solutions: Increasing adoption of connectivity solutions such as in-car Wi-Fi, GPS navigation, vehicle-to-everything (V2X) communication and others to allow seamless exchange of information in real-time. Rising infiltration of IoT technologies and the regulatory frame work for vehicle safety also bolsters the growth of this segment. The proven, high-speed connection that will keep the tech rolling will only grow more important over the next few decades, as autonomous and electric cars advance.
Entertainment segment is expected to register highest CAGR during the forecast period. Since consumers have always been on-demand for media consumption and real-time streaming, connected vehicles now provide new forms of internet connectivity, enabling movie, music, and gaming enjoyment while on the go. This growth is supported by the implementation of 5G networks, which offer higher speeds and lower latency. Furthermore, growing demand for personalized in-car entertainment including virtual assistants and content customization is another factor propelling the demand for automotive infotainment over the forecast period. This segment is likely to have significant growth due to the rise in new technology and changing consumer preferences where consumers want in-vehicle entertainment experiences same as at home.
Regional Analysis
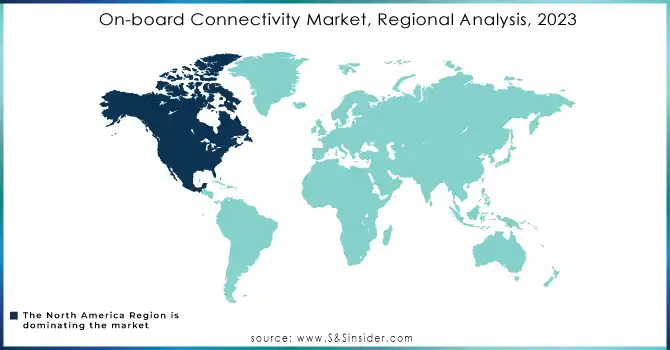
The North America dominated the on-board connectivity market with largest revenue share in 2023, owing to demand for connected vehicles, technological advancement as well as mature automotive infrastructure. Especially in North America, where the U.S. is at the forefront of the evolution also in in-car connectivity solutions like Wi-Fi(R), Navigation And V2X. All of these factors are driving strong connected car feature expectations at the consumer level and the involvement of significant automotive and technology players investing heavily in research and development. Furthermore, the regional growth is projected to increase on account of regulatory initiatives to be directed towards vehicle safety standards coupled with growing presence of electric and autonomous vehicles. Going forward, focus on the automotive IoT adoption in the North America region with an established infrastructure of on-board connectivity, is expected to holds lead over the on-board connectivity market.
The Asia-Pacific is expected to witness the highest growth rate (CAGR) throughout the duration of the forecast period in the on-board connectivity market, owing to the rising production of automobiles, increasing demand of consumers for digital services, and rapid development of 5G technology across the region. China, Japan, and South Korea massive populations and urbanization have exploded connected car services. In particular, China has been throwing massive amounts of cash at smart city initiatives and autonomous car technology, two trends that should increase the demand for connected cars. With infrastructure for 5G capable of streamlining high-bandwidth solutions that range from in-car streaming services to V2X communication, the Asia-Pacific region is primed for significant progress. Such a strong development is likely to position Asia-Pacific as a major contributor to the future growth path of the market.
Do You Need any Customization Research on On-board Connectivity Market - Enquire Now
Key Players
The major key players are
-
Qualcomm – Snapdragon Automotive Connectivity Platform
-
Intel – Automotive 5G Telematics Solutions
-
Harman International (Samsung) – Harman Ignite Platform
-
Robert Bosch GmbH – Connected Vehicle Cloud Services
-
Panasonic Corporation – Panasonic Automotive Connectivity Solutions
-
Continental AG – Telematics Connectivity Module (TCM)
-
Valeo – Valeo Smart Connectivity Module
-
Denso Corporation – Denso V2X (Vehicle-to-Everything) Communication System
-
Sierra Wireless – AirPrime Embedded Modules for Automotive Connectivity
-
ZF Friedrichshafen AG – ZF ProConnect Connectivity Platform
-
NXP Semiconductors – Automotive Connectivity Solutions for V2X
-
AT&T – AT&T Connected Car Platform
-
Vodafone Group – Vodafone Automotive IoT Telematics Solutions
-
Ericsson – Connected Vehicle Cloud
-
Verizon – Hum by Verizon (Connected Car Service)
-
Huawei Technologies – Huawei 5G-V2X Connectivity Solutions
-
Gemalto (Thales Group) – Cinterion IoT Modules for Automotive Connectivity
-
Renesas Electronics – Renesas V2X Communication Solutions
-
LG Electronics – Automotive Communication and Infotainment Solutions
-
Tesla, Inc. – Tesla In-Car Connectivity and OTA (Over-the-Air) Updates
Recent developments
January 2024: Viasat secured a new partnership to provide in-flight internet solutions for multiple airlines in Europe. This partnership aims to enhance the connectivity experience for passengers by delivering faster speeds and broader coverage across European routes
February 2024: Panasonic Avionics expanded its in-flight entertainment offerings by integrating new digital advertising options into its connectivity services. This update aims to help airlines increase revenue streams by personalizing in-flight advertisements while providing passengers with updated content options
| Report Attributes | Details |
| Market Size in 2023 | USD 10.01 billion |
| Market Size by 2032 | USD 27.67 Billion |
| CAGR | CAGR of 11.97% From 2024 to 2032 |
| Base Year | 2023 |
| Forecast Period | 2024-2032 |
| Historical Data | 2020-2022 |
| Report Scope & Coverage | Market Size, Segments Analysis, Competitive Landscape, Regional Analysis, DROC & SWOT Analysis, Forecast Outlook |
| Key Segments | • By Type (Solution, Service) • By Industry (Transportation, Entertainment, Monitoring, Communication) |
| Regional Analysis/Coverage | North America (US, Canada, Mexico), Europe (Eastern Europe [Poland, Romania, Hungary, Turkey, Rest of Eastern Europe] Western Europe] Germany, France, UK, Italy, Spain, Netherlands, Switzerland, Austria, Rest of Western Europe]), Asia Pacific (China, India, Japan, South Korea, Vietnam, Singapore, Australia, Rest of Asia Pacific), Middle East & Africa (Middle East [UAE, Egypt, Saudi Arabia, Qatar, Rest of Middle East], Africa [Nigeria, South Africa, Rest of Africa], Latin America (Brazil, Argentina, Colombia Rest of Latin America) |
| Company Profiles |
Qualcomm, Intel, Harman International (Samsung), Robert Bosch GmbH, Panasonic Corporation, Continental AG, Valeo, Denso Corporation, Sierra Wireless, ZF Friedrichshafen AG, NXP Semiconductors, AT&T. |
| Key Drivers | •Popularity of features like remote vehicle management and over-the-air updates is further driving the need for better connectivity in vehicles. •The adoption of Internet of Things (IoT) technologies is making transportation networks smarter and more interconnected, enhancing connectivity features. •The need for continuous connectivity in vehicles to access real-time data, navigation, and entertainment is growing rapidly. |
| Market Restraints |
•Continuous connectivity in vehicles increases the vulnerability to cyberattacks, posing significant challenges related to data protection and privacy. |
Frequently Asked Questions
On-board Connectivity Market was valued at USD 10.01 billion in 2023 and is expected to reach USD 27.67 Billion by 2032, growing at a CAGR of 11.97% from 2024-2032.
The CAGR of On-board Connectivity Market during the forecast period is of 11.97% from 2024-2032.
The North America dominated the market and represented significant revenue share in 2023
One main growth factor for the On-board Connectivity Market is
- Popularity of features like remote vehicle management and over-the-air updates is further driving the need for better connectivity in vehicles.
Challenges in On-board Connectivity Market are
- Continuous connectivity in vehicles increases the vulnerability to cyberattacks, posing significant challenges related to data protection and privacy.
- Inconsistent regulations and varying legal requirements across regions can hinder the seamless deployment of on-board connectivity solutions globally.
Get in Touch
