Online Video Platform Market Report Scope & Overview:
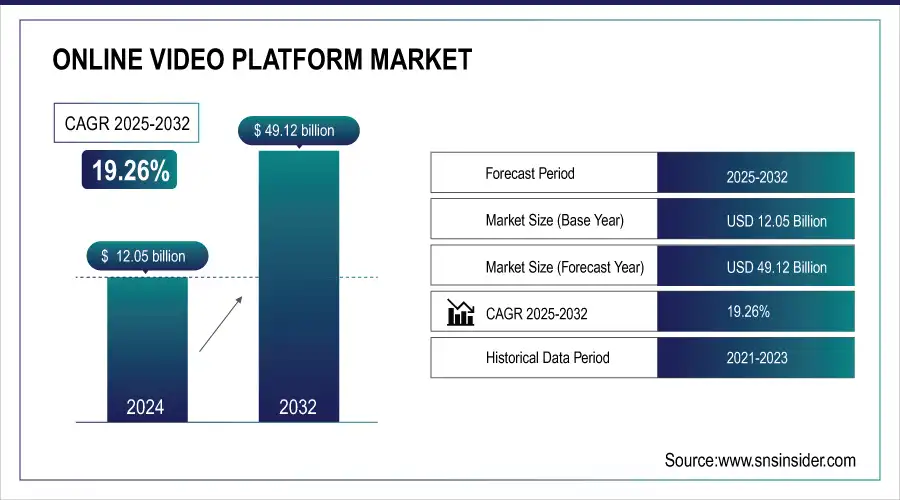
Online Video Platform Market was valued at USD 12.05 billion in 2024 and is expected to reach USD 49.12 billion by 2032, growing at a CAGR of 19.26% from 2025-2032. This report includes key insights into adoption rates, viewership metrics, device usage, technology trends, and investment and funding trends. The market is driven by the increasing demand for streaming services, rising mobile and desktop video consumption, advancements in video delivery technologies, and significant investments from both private and public sectors. The growing emphasis on digital content consumption is fueling the rapid expansion of the online video platform industry.

Get more information on Online Video Platform Market - Request Sample Report
Market Size and Forecast:
-
Market Size in 2024 USD 12.05 Billion
-
Market Size by 2032 USD 49.12 Billion
-
CAGR of 19.26% From 2025 to 2032
-
Base Year 2024
-
Forecast Period 2025-2032
-
Historical Data 2021-2023

Online Video Platform Market Trends:
-
Growing shift from traditional TV to OTT streaming drives demand for on-demand video content.
-
Social media platforms are boosting short-form, live, and interactive video consumption.
-
E-learning and corporate training are increasing the adoption of video-based educational content.
-
AI-powered personalization and analytics enhance user engagement, content recommendations, and retention.
-
Automated video editing and AI-driven content moderation improve production efficiency, compliance, and monetization opportunities.
Online Video Platform Market Growth Drivers:
-
Growing Digital Consumption Boosts Online Video Platforms with Rising OTT Streaming, Social Media Engagement, and E-Learning Adoption
The growing dependence on digital content is fueling the ubiquitous use of online video platforms. OTT streaming services are experiencing exponential growth as viewers move away from traditional television to on-demand video content. Social media platforms too are driving video viewing, with short-form video, live streaming, and interactive content emerging as leading engagement tools. Also, the swift growth of e-learning is driving robust demand for video-based learning, facilitating remote education and corporate training. With companies and content producers looking for effective video distribution and monetization, online video platforms are transforming with AI-powered personalization, analytics, and device-agnostic integration. This continued demand is transforming the digital landscape, establishing video as the central medium for entertainment, education, and advertising.
Online Video Platform Market Restraints:
-
Rising Cyber Threats and Strict Regulations Increase Security Challenges for Online Video Platforms, Raising Compliance Costs and Operational Risks
Growing numbers of cyberattacks and data breaches are placing enormous barriers for online video platforms. With user information becoming a prized asset, platforms are more vulnerable to hacking, phishing, and unauthorized access, which can result in financial and reputational losses. In addition, strict data privacy laws, including GDPR and CCPA, impose strict compliance levels, heightening operational complexities. Maintaining safe content delivery, user anonymity, and regulatory compliance requires ongoing investment in encryption, authentication, and cybersecurity features. These difficulties not only raise costs but also compromise user trust, constraining platform scalability. With governments and regulatory authorities cracking down on data security standards, online video platforms have to chart a shifting course to ensure continued growth while keeping up with regulations.
Online Video Platform Market Opportunities:
-
AI-Driven Personalization Transforms Online Video Platforms with Smart Recommendations, Automated Editing, and Enhanced Content Moderation for Better User Engagement
Artificial intelligence integration is revolutionizing online video platforms by providing extremely personalized and engaging user experiences. AI-powered recommendation algorithms scan viewing habits and interests to recommend content, driving user retention and watch time. Automated video editing software simplifies content production, allowing for quicker creation and higher quality. AI-powered content moderation also helps maintain platform compliance by identifying objectionable content, minimizing human intervention, and enhancing safety. These technologies not only maximize content delivery but also maximize monetization through targeted advertising and subscription. As AI functionality becomes more advanced, online video platforms can take advantage of machine learning and automation to optimize content strategy, enhance viewer engagement, and achieve competitive advantage in the market.
Online Video Platform Market Segment Analysis:
By Component
The Solution segment led the Online Video Platform Market with the largest revenue share of nearly 55% in 2024 because end-to-end video hosting, content management, and monetization solutions are being increasingly adopted. These platforms are being used by businesses, media companies, and content creators for easy video distribution, brand interaction, and revenue generation. The growing need for AI-driven video analytics, automated editing, and recommendation further enhances the leadership of solutions.
The Services segment is anticipated to grow at the fastest CAGR of approximately 20.19% during the period 2025-2032, boosted by the demand for professional and managed services in supporting platform deployment, customization, and optimization. With businesses embedding video solutions within their operations, they need the help of professionals for implementation, security, and content management. The growth in cloud-based video services and expanding dependence on AI-driven consulting even more fuel this growth.
By Streaming Type
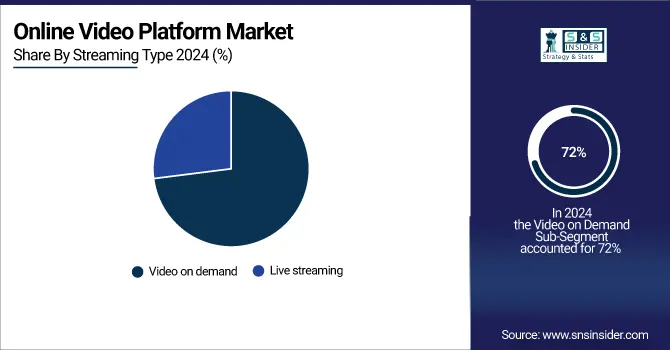
The Video on Demand segment led the Online Video Platform Market with a maximum revenue share of around 72% during 2024, owing to the growing need for on-demand consumption of content in entertainment, education, and corporate segments. The high deployment of OTT platforms, and rising subscriptions of streaming services have spurred demand for VoD offerings. Content customization, AI-driven recommendations, and the ability of users to opt for flexible views have also led to increased usage.
The Live Streaming segment will expand at the fastest CAGR of around 21.06% during 2025-2032, driven by growing popularity of real-time content on social media, gaming, sports, and events. Interactive and immersive experiences, including live Q&A sessions, webinars, and virtual events, are fueling adoption. Growing investments in 5G technology, ultra-low latency streaming, and monetization possibilities through advertisements and subscriptions are further fueling growth. The rise of influencer-led live content and business live communication further bolsters this segment's growth.

By End-user
The Media & Entertainment segment led the Online Video Platform Market with the largest revenue share of around 37% in 2024 due to the rising popularity of streaming services, movies, TV programs, and live events. The transition from linear broadcasting to on-demand consumption of content through OTT platforms has increased the segment's reach. Content creators, distributors, and media businesses are using video platforms to drive audience interaction, subscription- and advertisement-based monetization, and worldwide content delivery, further supporting its monopoly.
The Retail segment will expand at the fastest CAGR of approximately 22.83% during 2025-2032, fueled by the expansion of video usage in e-commerce, product demonstrations, and individualized customer interaction. Retailers are taking advantage of online video websites for virtual try-ons, live shopping events, and interactive ad campaigns. Increasing usage of AI to offer personal content recommendations and rising use of video advertisements across social media websites is driving growth as retailers need creative ways to entice customers and keep them loyal.
By Type
The Video Processing business led the Online Video Platform Market with the largest revenue share of nearly 38% in 2024 due to the surging need for high-quality video content. Encoding, transcoding, and compression are some video processing technologies used to optimize the delivery of video content on various devices and networks. With rising demand for 4K and high-definition videos, platforms count on sophisticated video processing to enable smooth streaming. This segment also supports content creators in producing and distributing polished video experiences.
The Video Analytics business is anticipated to expand at the fastest CAGR of approximately 22.12% during the period 2025-2032, powered by the escalating demand for insights based on data in video material. Video analytics solutions support monitoring in real time, tracking engagement, and optimization of content. The growing application of AI and machine learning capabilities for facial identification, behavior measurement, and viewing sentiment analysis spurs this development.
Online Video Platform Market Regional Analysis:
North America Online Video Platform Market Insights
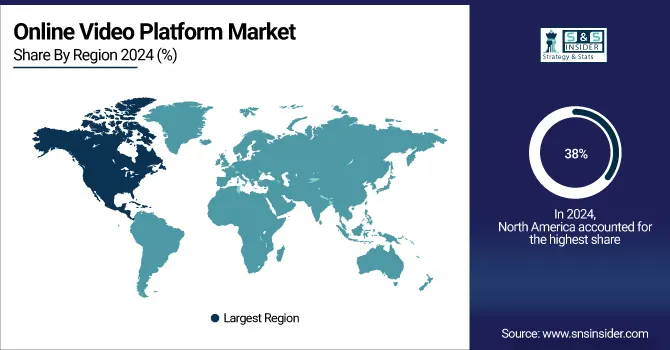
North America was the leader of the Online Video Platform Market in terms of maximum revenue share of 38% in 2024 due to the digital infrastructure strength, high penetration of internet, and strong consumer desire for OTT services in the region. Presence of big giants such as Netflix, Amazon Prime, and Hulu, coupled with a growing e-learning and business video market, has largely played a role in this leadership. Further, the region's huge penetration of smartphones and smart TVs also accelerates the video content demand on multiple platforms.

Need any customization research/data on Online Video Platform Market - Enquiry Now
Asia Pacific Online Video Platform Market Insights
The Asia Pacific market is projected to grow at the fastest CAGR of 21.00% during the forecast period from 2025-2032, spurred by the extensive growth of internet access, mobile phones, and emerging economies' escalating demand for video content. Growing middle class in the region, as well as the increasing popularity of OTT and mobile video platforms, is driving the expansion. The use of live streaming, e-commerce integration, and local content production also drive the expansion of the region's video platform market.
Europe Online Video Platform Market Insights
Europe’s online video platform market is expanding rapidly due to widespread adoption of OTT services, high-speed internet penetration, and growing social media engagement. Increasing demand for video-based learning, corporate training, and digital advertising drives market growth. AI-powered personalization, advanced analytics, and cross-device integration further enhance viewer experience, making video content a central medium for entertainment, education, and marketing across the region.
Latin America (LATAM) and Middle East & Africa (MEA) Online Video Platform Market Insights
The LATAM and MEA markets are witnessing strong growth in online video platforms, driven by increasing smartphone and internet penetration, rising social media usage, and growing demand for OTT content. Adoption of AI-driven recommendations, video monetization, and cloud-based streaming solutions is enabling improved engagement, accessibility, and content distribution, supporting market expansion in these emerging regions.
Online Video Platform Market Key Players:
Some of the Online Video Platform Market Companies are
-
Akamai Technologies (Adaptive Media Delivery, Ion Content Delivery Network)
-
Brightcove Inc. (Video Cloud, Brightcove Player)
-
Comcast Cable Communications Management, LLC (Xfinity Stream, Comcast Cloud Solutions)
-
Endavo Media (Endavo OTT, Video Platform)
-
Frame.io, Inc. (Cloud-Based Video Editing, Team Collaboration)
-
Kaltura, Inc. (Kaltura Video Platform, Kaltura MediaSpace)
-
Limelight Networks (Video Delivery, EdgeCompute)
-
Longtail Ad Solutions, Inc. (JW Player) (JW Player, JW Video Player)
-
MediaMelon Inc. (Intelligent Streaming, Video Optimization)
-
Panopto (Video Platform, Video Content Management)
-
SpotX, Inc. (SpotX Ad Server, SpotX Video Player)
-
Wistia Inc. (Wistia Video Hosting, Wistia Analytics)
-
YouTube (YouTube Live, YouTube Premium)
-
Comcast Technology Solutions (Xfinity On Demand, Comcast Cloud Solutions)
-
Netflix (Netflix Originals, Netflix Streaming)
-
Amazon (Prime Video, Twitch) (Prime Video, Amazon Studios)
-
Meta Platforms, Inc. (Facebook Watch, Instagram Video) (Facebook Video, Instagram TV)
-
ByteDance (TikTok) (TikTok Video Platform, TikTok Ads)
-
Disney Streaming (Disney+, Hulu) (Disney+, Hulu Streaming)
-
Warner Bros. Discovery (HBO Max, Discovery+) (HBO Max, Discovery+)
-
Paramount Global ((Paramount+, Pluto TV) (Paramount+, Pluto TV Streaming)
-
Comcast (Peacock) (Peacock Streaming, Peacock Premium)
-
Apple Inc. (Apple TV+, Apple TV App)
Competitive Landscape for Online Video Platform Market:
Akamai Technologies is a global leader in content delivery and cloud services, providing high-performance solutions for online video platforms. Its Adaptive Media Delivery and Ion Content Delivery Network optimize streaming quality, reduce latency, and ensure seamless video experiences across devices. Akamai supports media companies, OTT services, and enterprises in delivering scalable, reliable, and secure video content worldwide.
-
In September 2024, Akamai introduced new video workflow capabilities, empowering media companies with greater flexibility and control over their video delivery processes, enhancing their ability to meet growing consumer demands.
Disney Streaming is a leading provider of online video platforms, offering services like Disney+ and Hulu. The company delivers high-quality, on-demand streaming content across devices, leveraging advanced content delivery networks and AI-driven personalization. Disney Streaming enhances user engagement, supports global audience reach, and enables seamless access to entertainment, educational, and original media content worldwide.
-
In September 2024, Disney and DIRECTV reached an agreement in principle to distribute Disney's linear networks and direct-to-consumer streaming services, expanding access for subscribers.
| Report Attributes | Details |
| Market Size in 2024 | USD 12.05 Billion |
| Market Size by 2032 | USD 49.12 Billion |
| CAGR | CAGR of 19.26% From 2025 to 2032 |
| Base Year | 2024 |
| Forecast Period | 2025-2032 |
| Historical Data | 2021-2023 |
| Report Scope & Coverage | Market Size, Segments Analysis, Competitive Landscape, Regional Analysis, DROC & SWOT Analysis, Forecast Outlook |
| Key Segments | • By Component (Solution, Services) • By Type (Video Processing, Video Management, Video Distribution, Video Analytics, Others) • By Streaming Type (Live Streaming, Video on Demand) • By End-User (Media & Entertainment, BFSI, Retail, Education, IT and Telecom, Others) |
| Regional Analysis/Coverage | North America (US, Canada), Europe (Germany, UK, France, Italy, Spain, Russia, Poland, Rest of Europe), Asia Pacific (China, India, Japan, South Korea, Australia, ASEAN Countries, Rest of Asia Pacific), Middle East & Africa (UAE, Saudi Arabia, Qatar, South Africa, Rest of Middle East & Africa), Latin America (Brazil, Argentina, Mexico, Colombia, Rest of Latin America). |
| Company Profiles | Akamai Technologies, Brightcove Inc., Comcast Cable Communications Management, LLC, Endavo Media, Frame.io, Inc., Kaltura, Inc., Limelight Networks, Longtail Ad Solutions, Inc. (JW Player), MediaMelon Inc., Ooyala Inc. (Telstra), Panopto, SpotX, Inc., Wistia Inc., YouTube, Comcast Technology Solutions, Google (YouTube), Netflix, Amazon, Meta Platforms, Inc., ByteDance, Disney Streaming, Warner Bros. Discovery, Paramount Global, Comcast, Apple Inc. |

